Viewing entries in
Forex News Trading

Comment

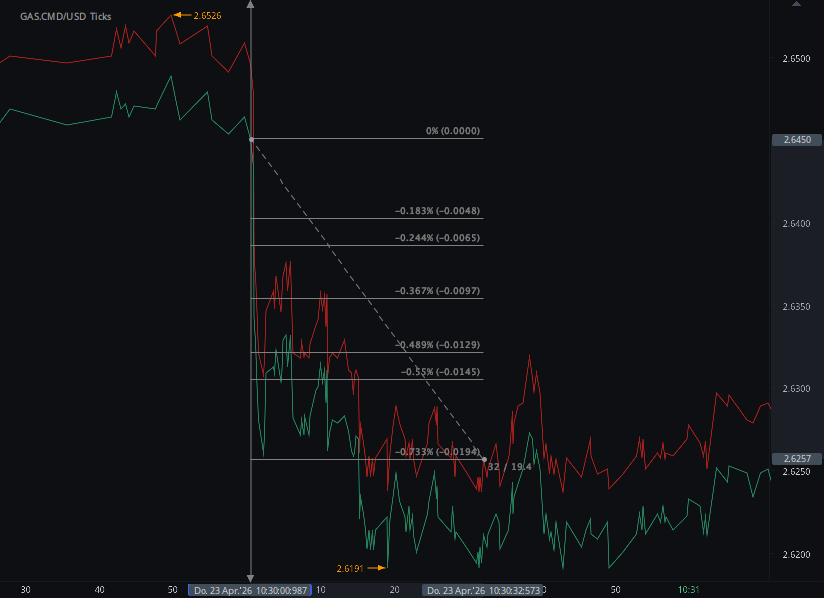
19 ticks potential profit in 32 seconds on 23 April 2026, analysis on futures news trading natural gas on DOE Natural Gas Storage Report (WNGSR) data

According to our analysis natural gas moved 19 ticks on DOE Natural Gas Storage Report (WNGSR) data on 23 April 2026.

Natural gas (19 ticks)

Charts are exported from JForex (Dukascopy).


U.S. Natural Gas Storage Builds Strongly as Injection Season Gains Momentum

The latest Weekly Natural Gas Storage Report from the U.S. Energy Information Administration (EIA) shows a robust start to the injection season, with storage levels rising sharply for the week ending April 17, 2026. The data signals a healthy supply position and offers important insights into regional dynamics and market balance heading into the warmer months.

A Triple-Digit Injection Surprises to the Upside

Working gas in underground storage increased by 103 billion cubic feet (Bcf) compared to the previous week, bringing total inventories to 2,063 Bcf. This sizable build exceeds typical seasonal norms and reflects a combination of moderate demand and steady production.

The latest injection pushes storage levels:

  • 142 Bcf above the same time last year

  • 137 Bcf above the five-year average of 1,926 Bcf

Despite the strong surplus, total inventories remain comfortably within the historical five-year range, suggesting no immediate imbalance but a clear cushion forming early in the season.

Regional Contributions: Broad-Based Growth

All regions reported net injections, with particularly strong contributions from the South Central and Midwest regions:

  • South Central: +40 Bcf

  • Midwest: +33 Bcf

  • East: +26 Bcf

  • Mountain: +2 Bcf

  • Pacific: +2 Bcf

The South Central region—home to key storage hubs and salt caverns—continues to play a central role in balancing supply, accounting for nearly 40% of the weekly build.

Storage Levels vs. Historical Benchmarks

A closer look at regional storage reveals mixed positioning relative to historical norms:

  • The Mountain and Pacific regions stand significantly above their five-year averages, up 59.1% and 46.2%, respectively.

  • The East and Midwest regions remain slightly below their five-year averages, indicating room for further injections.

  • The South Central region sits modestly above average, reflecting stable conditions.

Overall, the national surplus suggests a market that is well-supplied but not excessively saturated.

Data Revisions: Minor but Noteworthy

The report also includes revisions to historical storage data covering late August 2025 through early April 2026. These adjustments were largely due to reclassifications of gas from working to base storage.

Key impacts:

  • Average downward revision of 10 Bcf per week

  • Minimal effect on weekly net changes

  • Prior week’s total (April 10) revised from 1,970 Bcf to 1,960 Bcf

While these revisions slightly alter historical comparisons, they do not materially change the broader supply outlook.

What This Means for the Market

The strong injection early in the refill season may have several implications:

  • Price pressure: Higher-than-average inventories can weigh on natural gas prices, especially if mild weather persists.

  • Supply confidence: Elevated storage levels provide a buffer against potential summer demand spikes or supply disruptions.

  • Injection pace: Continued builds at this rate could push inventories well above average by mid-summer.

However, much will depend on upcoming weather patterns, LNG export demand, and production trends.

Looking Ahead

The next storage report, scheduled for release on April 30, 2026, will offer further clues on whether this strong injection trend continues. Market participants will be watching closely to see if supply remains this resilient as seasonal demand begins to shift.

For now, the takeaway is clear: the U.S. natural gas market is entering the injection season in a position of strength, with inventories building faster than usual and supply comfortably exceeding historical benchmarks.

Disclaimer: This blog post is for informational purposes only and should not be construed as financial advice. Always conduct thorough research and consider seeking advice from a financial professional before making any investment decisions.

Source: https://ir.eia.gov/ngs/ngs.html


Start futures forex fx commodity news trading with Haawks G4A low latency machine-readable data, one of the fastest data feeds for DOE data.

Please let us know your feedback. If you are interested in timestamps, please send us an email to sales@haawks.com.

Comment

Comment

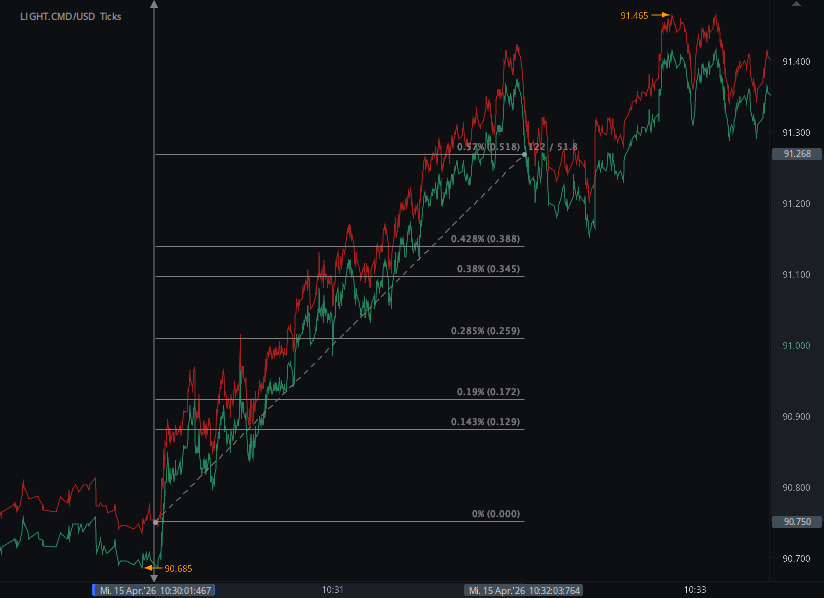
51 ticks potential profit in 122 seconds on 15 April 2026, analysis on futures news trading crude oil on DOE Petroleum Status Report (WPSR) data

According to our analysis crude oil moved 51 ticks on DOE Petroleum Status Report (WPSR) data on 15 April 2026.

Light sweet crude oil (51 ticks)

Charts are exported from JForex (Dukascopy).


A Snapshot of the U.S. Oil Market: What the Latest Data Tells Us

The latest weekly petroleum data from the Energy Information Administration offers a revealing look into the current state of the U.S. oil market. From refinery activity to fuel prices, the numbers highlight a complex balance between supply, demand, and pricing pressures shaping the energy landscape in April 2026.

Refinery Activity Slows Slightly

U.S. refineries processed an average of 16.0 million barrels per day during the week ending April 10, marking a modest decline of 208,000 barrels per day compared to the previous week. Refinery utilization also dipped to 89.6% of capacity, signaling a slight slowdown in operations.

Despite this, gasoline production saw a small boost, reaching 9.8 million barrels per day, while distillate fuel production fell to 4.9 million barrels per day. This divergence suggests refiners may be adjusting output in response to shifting demand patterns.

Imports and Inventories: A Mixed Picture

Crude oil imports dropped sharply, falling by 1.0 million barrels per day to an average of 5.3 million barrels per day. Over a four-week period, imports averaged 6.1 million barrels per day, slightly below last year’s levels.

Inventory data tells another important story:

  • Crude oil inventories declined by 0.9 million barrels but remain about 1% above the five-year average

  • Gasoline inventories fell significantly by 6.3 million barrels

  • Distillate stocks dropped by 3.1 million barrels and sit 6% below the five-year average

  • Propane inventories increased and are a striking 68% above the seasonal norm

Overall, total commercial petroleum inventories decreased by 9.0 million barrels, indicating tightening supply conditions in certain segments.

Demand Trends Show Growth

Demand appears to be strengthening. Total petroleum products supplied averaged 20.6 million barrels per day over the past four weeks—an increase of 5.6% compared to last year.

Breaking it down:

  • Gasoline demand rose by 3.6%

  • Distillate demand increased by 2.2%

  • Jet fuel demand saw a slight decline of 0.2%

This suggests steady economic activity, with transportation fuels driving most of the growth.

Prices Surge Year Over Year

Energy prices remain a key concern. The benchmark West Texas Intermediate (WTI) crude oil price reached $98.34 per barrel, a dramatic increase of $36.43 compared to a year ago.

Fuel prices reflect this upward pressure:

  • Gasoline (retail average): $4.123 per gallon

  • Diesel (retail average): $5.608 per gallon

While gasoline prices edged up slightly week-over-week, diesel prices saw a small decline—but both remain significantly higher than last year.

What It All Means

The current data paints a picture of an oil market under pressure:

  • Supply constraints are emerging in refined products like gasoline and distillates

  • Demand is rising, particularly for transportation fuels

  • Prices remain elevated, driven by both global crude costs and domestic supply dynamics

At the same time, high propane inventories and declining imports suggest uneven conditions across different energy segments.

Final Thoughts

As we move deeper into 2026, the oil market continues to navigate a delicate balance. Refinery adjustments, shifting demand, and global price pressures will remain critical factors to watch. For consumers, businesses, and policymakers alike, these trends underscore the importance of closely monitoring energy data in the months ahead.

Disclaimer: This blog post is for informational purposes only and should not be construed as financial advice. Always conduct thorough research and consider seeking advice from a financial professional before making any investment decisions.

Source: https://www.eia.gov/petroleum/supply/weekly/archive/2026/2026_04_15/pdf/highlights.pdf


Start futures forex fx commodity news trading with Haawks G4A low latency machine-readable data, one of the fastest data feeds for DOE data.

Please let us know your feedback. If you are interested in timestamps, please send us an email to sales@haawks.com.

Comment

628 pips, US500 56 points, XAU/USD 16 points and BTC 177 points potential futures forex fx news trading profit from 14 events in the first quarter of 2026 with Haawks G4A machine-readable data feed

Comment

628 pips, US500 56 points, XAU/USD 16 points and BTC 177 points potential futures forex fx news trading profit from 14 events in the first quarter of 2026 with Haawks G4A machine-readable data feed

We are pleased to announce that there was a potential of 628 pips/ticks, US500 56 points (224 ticks), XAU/USD 16 points and BTC 177 points profit out of the following 14 events in the first quarter of 2026 based on our ex-post analysis. The potential performance for 2025 was 1,828 pips/ticks.

Q1 2026

Cumulative potential, indicative performance Q1 2026, please see all releases below.

Total trading time would have been around 11 minutes in 3 months! (preparation time not included)

You can click on each release for detailed information.


628 Pips, XAUUSD 16 Points, US500 56 Points and BTC 177 Points Potential Trading Performance from 14 Events in Q1 2026 with Haawks G4A Machine-Readable Data Feed

According to Haawks G4A analysis, the first quarter of 2026 generated a cumulative 628 pips / ticks of potential trading performance, plus notable moves in XAUUSD, US500 and BTC, across major U.S. macroeconomic and commodity data releases.

From USDA crop reports and DOE energy inventories to CPI and Employment Situation releases, Q1 2026 once again showed how scheduled economic data can trigger sharp, short-lived market reactions across futures, FX, equities, gold and crypto.

The key takeaway was clear: news-driven volatility remains fast, measurable and highly time-sensitive.

Q1 2026 Performance Snapshot

Across January, February and March 2026, Haawks G4A tracked potential trading opportunities from the following events:

  • January 2026: 391 pips / ticks, US500 13 points, BTC 177 points

  • February 2026: 183 pips / ticks, US500 12 points

  • March 2026: 54 pips / ticks, XAUUSD 16 points, US500 31 points

Total Q1 2026 indicative performance:
628 pips / ticks, plus XAUUSD 16 points, US500 56 points and BTC 177 points

For comparison, the full-year potential performance in 2025 was 1,828 pips / ticks.

Events Covered in Q1 2026

The following releases generated measurable short-term market reactions:

January 2026

USDA WASDE — World Agricultural Supply and Demand Estimates
200 ticks / 12 January 2026

US BLS Consumer Price Index
5 pips, US500 13 points, BTC 177 points / 13 January 2026

DOE Natural Gas Storage Report
66 ticks / 15 January 2026

DOE Natural Gas Storage Report
103 ticks / 22 January 2026

DOE Natural Gas Storage Report
17 ticks / 29 January 2026

February 2026

US Employment Situation — Non-farm Payrolls
60 pips / 11 February 2026

DOE Natural Gas Storage Report
23 ticks / 12 February 2026

US BLS Consumer Price Index
16 pips, US500 12 points / 13 February 2026

DOE Natural Gas Storage Report
41 ticks / 19 February 2026

DOE Petroleum Status Report
17 ticks / 25 February 2026

DOE Natural Gas Storage Report
26 ticks / 26 February 2026

March 2026

DOE Natural Gas Storage Report
14 ticks / 5 March 2026

US Employment Situation — Non-farm Payrolls
XAUUSD 16 points, US500 31 points / 6 March 2026

USDA Grain Stocks and USDA Prospective Plantings
40 ticks / 31 March 2026

Total trading time across these events would have been only a few minutes, excluding preparation time.

January 2026: USDA, CPI and DOE Reports Drive the Strongest Month

January was the most active month of Q1, producing 391 pips / ticks of potential performance, plus significant moves in US500 and BTC.

The strongest single move came from the USDA WASDE report on 12 January 2026, which generated approximately 200 ticks across grains.

The report confirmed a supply-heavy agricultural backdrop, with record U.S. corn production, higher ending stocks and large global crop supplies. Soybeans, corn and wheat all reacted sharply as traders priced in abundant supply and shifting expectations for demand.

The following day, the US CPI release on 13 January 2026 generated short-term volatility across multiple asset classes:

  • EURUSD: 5 pips

  • US500: 13 points

  • BTC: 177 points

The inflation data showed price pressures remaining steady rather than accelerating. Headline CPI rose 0.3% month-on-month, while annual CPI stood at 2.7%. Core CPI remained at 2.6%, with shelter and services inflation still important for market expectations.

Natural gas was also a major source of volatility in January. Three DOE Natural Gas Storage Reports generated:

  • 66 ticks on 15 January

  • 103 ticks on 22 January

  • 17 ticks on 29 January

The January 22 report was the largest energy-related move of the month, with a 120 Bcf withdrawal triggering a sharp reaction in natural gas futures. Despite strong withdrawals, inventories remained above five-year averages, which helped keep the broader supply picture relatively comfortable.

February 2026: Macro and Energy Volatility Continue

February produced 183 pips / ticks of potential performance, plus US500 12 points, across six key events.

The month began with a major macro catalyst: the US Employment Situation report on 11 February 2026. The release generated a combined 60-pip move across USDJPY and EURUSD within a short reaction window.

The employment data showed:

  • 130,000 jobs added

  • Unemployment rate at 4.3%

  • Average hourly earnings up 0.4%

The report was mixed, with strong gains in healthcare, social assistance and construction, but weakness in federal government and financial activities employment.

Two days later, the US CPI release on 13 February 2026 generated further volatility:

  • USDJPY and EURUSD: 16 pips combined

  • US500: 12 points

The CPI data showed continued inflation moderation, with monthly CPI at 0.2%, annual CPI at 2.4% and core CPI at 2.5%. Energy prices declined, while shelter and medical care remained firm.

Energy reports were again central to February’s performance. DOE Natural Gas Storage Reports generated:

  • 23 ticks on 12 February

  • 41 ticks on 19 February

  • 26 ticks on 26 February

The February 19 release was the strongest natural gas event of the month, with a 144 Bcf withdrawal and inventories 123 Bcf below the five-year average.

The DOE Petroleum Status Report on 25 February 2026 added another 17 ticks in crude oil futures, driven by a significant inventory build and lower refinery activity.

March 2026: NFP, Gold, Equities and USDA Grains

March produced fewer events, but still delivered meaningful market reactions: 54 pips / ticks, plus XAUUSD 16 points and US500 31 points.

The first major event was the DOE Natural Gas Storage Report on 5 March 2026, which generated 14 ticks. The report showed a 132 Bcf withdrawal, with working gas at 1,886 Bcf. The market reaction reflected a balanced but sensitive supply picture, with storage above last year but slightly below the five-year average.

The biggest cross-asset move of the month came from the US Employment Situation report on 6 March 2026.

The data showed an unexpected decline in payrolls:

  • Payrolls: -92,000 jobs

  • Unemployment rate: 4.4%

  • Wage growth: 3.8% year-on-year

Gold and equities reacted sharply:

  • XAUUSD: 16 points

  • US500: 31 points

Gold benefited from risk-off sentiment, while equity markets repriced growth expectations within seconds of the release.

The final major event of Q1 was the USDA Grain Stocks and Prospective Plantings report on 31 March 2026, which generated approximately 40 ticks in soybean futures.

The report showed a bearish-leaning supply picture:

  • Soybean stocks up 10% year-on-year

  • Off-farm stocks up 16%

  • Planted acreage up 4%

  • Demand slightly weaker

Even though the data pointed toward rising supply, the market reaction highlighted how positioning, uncertainty and liquidity gaps can create significant short-term volatility around scheduled agricultural releases.

Key Themes from Q1 2026

1. Energy Data Remained a Reliable Volatility Driver

DOE Natural Gas Storage Reports were among the most consistent sources of short-term futures volatility in Q1.

Across January, February and March, WNGSR releases generated repeated tradable reactions, especially when withdrawals differed from seasonal expectations.

The strongest natural gas move came on 22 January 2026, with a 103-tick reaction.

2. USDA Reports Continued to Move Grain Futures

Agricultural data remained highly relevant for futures traders.

The January WASDE report generated the largest single event move of Q1 at 200 ticks, while the March Grain Stocks and Prospective Plantings release added another 40 ticks.

The main market drivers were:

  • Record or elevated crop production

  • Rising ending stocks

  • Acreage shifts

  • Weather risk

  • Export and demand uncertainty

3. U.S. Macro Releases Moved Multiple Asset Classes

CPI and Employment Situation reports affected FX, equities, gold and crypto.

The January CPI release generated moves across EURUSD, US500 and BTC, while February’s CPI moved both FX and equities. The March Employment Situation report produced notable reactions in gold and US500 after a negative payrolls surprise.

This highlights the cross-market nature of macro news trading.

4. Reaction Windows Were Extremely Short

Many of the moves occurred within seconds or under two minutes of the release.

This reinforces the importance of:

  • Low-latency data delivery

  • Machine-readable formats

  • Predefined event preparation

  • Automated parsing and execution infrastructure

In modern news trading, speed is often the difference between capturing and missing the move.

Final Thoughts

Q1 2026 showed that scheduled economic and commodity data releases continued to generate fast, measurable trading opportunities across multiple markets.

From USDA reports and natural gas inventories to CPI and NFP, market reactions were often immediate and short-lived. The strongest opportunities came from events where the released data differed meaningfully from expectations or forced traders to quickly reassess supply, demand, inflation or growth assumptions.

The main lesson from the quarter is simple:

Data still moves markets — but the window to act is extremely small.

For professional news traders, machine-readable data is no longer optional. It is a core part of competing in markets where reactions are measured in milliseconds and execution speed matters as much as interpretation.

Disclaimer: This blog post is for informational purposes only and should not be construed as financial advice. Always conduct thorough research and consider seeking advice from a financial professional before making any investment decisions.


Start futures/forex/oil/grains news trading with Haawks G4A low latency machine-readable data today, we offer one of the fastest machine-readable data feeds for US macro-economic and commodity data and macro-economic data from Norway, Sweden, Switzerland Turkey and ECB interest rates and statement.

Please let us know your feedback and check out our G4A low latency data feed.

All data is machine readable and available via API access in Chicago, New York and London. Free trials.

Comment

Comment

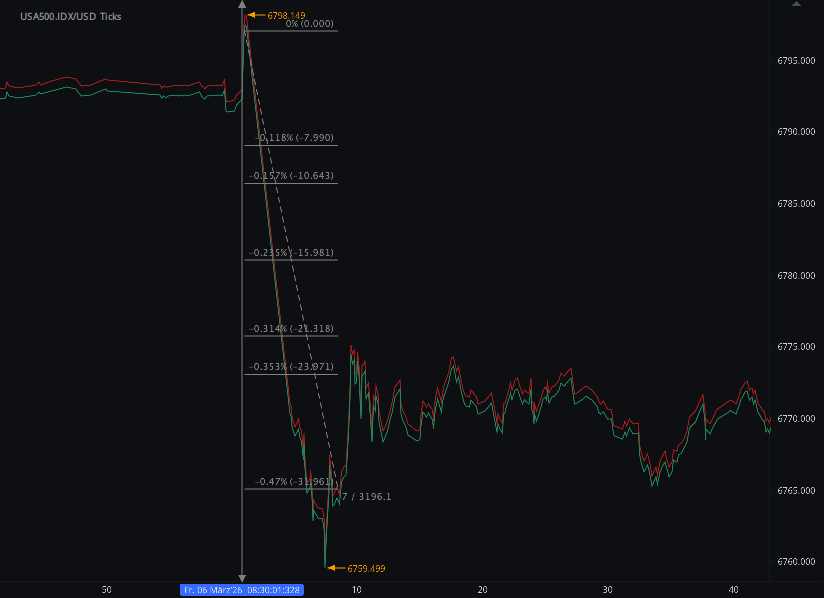
XAUUSD 16 points, US500 31 points potential profit in 24 seconds on 6 March 2026, analysis on forex fx futures news trading XAUUSD (spot gold) and US500 on US Employment Situation (NFP)

According to our analysis XAUUSD (spot gold) moved 16 points and US500 moved 31 points on US Employment Situation (Non-farm payrolls / NFP) data on 6 March 2026.

XAUUSD (16 points)

US500 (31 points)

Charts are exported from JForex (Dukascopy).


U.S. Jobs Report – February 2026: Payrolls Slip While Unemployment Holds Steady

The U.S. labor market showed signs of cooling in February 2026, according to the latest Employment Situation report from the Bureau of Labor Statistics (BLS). While the unemployment rate remained relatively stable, total nonfarm payroll employment declined slightly, highlighting a labor market that is still resilient but facing pockets of weakness across certain industries.

Payroll Employment Declines Slightly

Total nonfarm payroll employment fell by 92,000 jobs in February, reversing part of January’s gain of 126,000 jobs. The drop was largely influenced by job losses in specific sectors, particularly health care, information, and federal government employment.

Despite the monthly decline, the broader labor market picture remains mixed rather than sharply negative. Job growth throughout 2025 had already slowed considerably, and February’s figures suggest a continuation of that gradual moderation.

Unemployment Rate Holds at 4.4%

The unemployment rate remained unchanged at 4.4%, with approximately 7.6 million people unemployed in February. Across demographic groups—including adult men, adult women, teenagers, and major racial and ethnic categories—unemployment rates showed little change during the month.

However, one area of concern is long-term unemployment. The number of individuals unemployed for 27 weeks or longer reached 1.9 million, up from 1.5 million a year ago. Long-term unemployed workers now account for 25.3% of all unemployed people.

Labor Force Participation Remains Flat

Labor force participation and employment ratios also showed minimal movement:

  • Labor force participation rate: 62.0%

  • Employment-population ratio: 59.3%

Both measures have remained relatively stable over the past year. However, new population estimates from the U.S. Census Bureau affected the underlying data, particularly due to demographic shifts such as fewer men aged 25–54 and more women aged 65 and older—groups that historically participate in the workforce at different rates.

Sector Breakdown: Where Jobs Were Lost and Gained

Several industries experienced notable changes in February:

Health Care
Employment declined by 28,000 jobs, largely due to strike activity affecting physicians’ offices, which lost 37,000 jobs. Hospitals, however, added 12,000 positions.

Information Sector
The information industry continued its downward trend, shedding 11,000 jobs in February and averaging monthly losses over the past year.

Federal Government
Federal employment fell by 10,000 jobs. Since October 2024, federal employment has declined by 330,000 positions, representing an 11% drop.

Social Assistance
One of the few areas of consistent growth, social assistance added 9,000 jobs, primarily in individual and family services.

Transportation and Warehousing
Employment was mostly unchanged overall but saw losses in courier and messenger services, partially offset by gains in air transportation.

Wage Growth Continues

Despite softer employment numbers, wage growth remained solid.

  • Average hourly earnings: $37.32 (up $0.15 in February)

  • Year-over-year wage growth: 3.8%

Production and nonsupervisory employees saw earnings rise to $32.03 per hour, reflecting steady—though not accelerating—income growth for workers.

Workweek and Hours

The average workweek remained stable:

  • All private employees: 34.3 hours

  • Manufacturing: 40.1 hours (slightly lower)

  • Overtime in manufacturing: 3.0 hours

Stable hours suggest that employers are maintaining current staffing levels rather than significantly expanding or cutting back.

Data Revisions

The BLS also revised previous job numbers:

  • December 2025: Revised from +48,000 to –17,000

  • January 2026: Revised from +130,000 to +126,000

These revisions mean employment for those two months combined is 69,000 lower than previously reported.

Population Data Adjustments

February’s report also incorporated updated population estimates based on the 2020 Census. These revisions affected measures like labor force participation but did not change the unemployment rate.

The updated data indicates:

  • A decline in the number of men aged 25–54

  • An increase in women aged 65 and older

  • Changes in the racial composition of the population, including increases in Asian and multiracial populations

These demographic shifts slightly lowered overall labor force participation estimates.

What It Means for the Economy

February’s employment report paints a picture of a labor market that is stable but slowing. Unemployment remains low by historical standards, and wages continue to rise. However, job growth is weakening, certain industries are contracting, and long-term unemployment is creeping upward.

Economists will be watching closely to see whether February’s job losses represent temporary disruptions—such as strike activity—or the beginning of a more pronounced labor market slowdown.

The next Employment Situation report, covering March 2026, will be released on April 3, 2026.

Disclaimer: This blog post is for informational purposes only and should not be construed as financial advice. Always conduct thorough research and consider seeking advice from a financial professional before making any investment decisions.

Source: https://www.bls.gov/news.release/empsit.nr0.htm


Start forex fx futures news trading with Haawks G4A low latency machine-readable data today, one of the fastest news data feeds for US macro-economic and commodity data.

Please let us know your feedback. If you are interested in timestamps, please send us an email to sales@haawks.com.

Comment

Comment

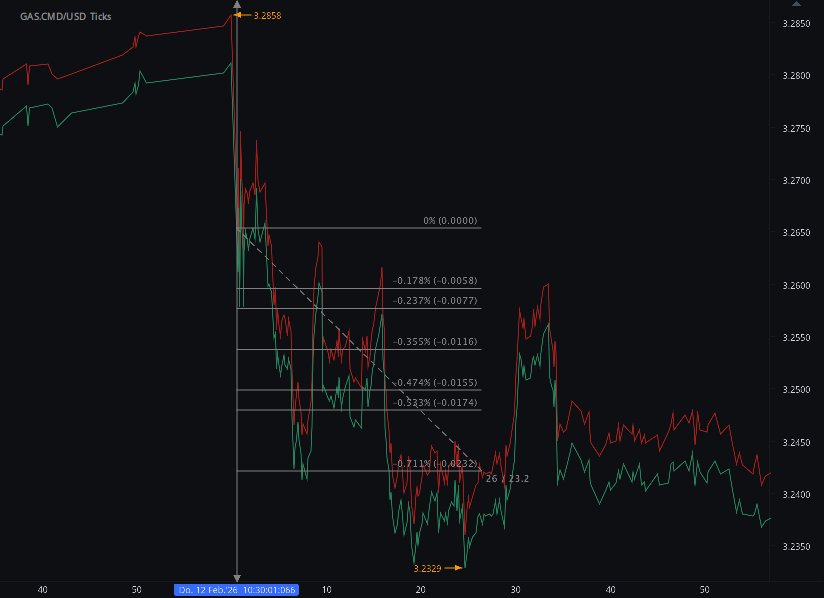
14 ticks potential profit in 12 seconds on 5 March 2026, analysis on futures news trading natural gas on DOE Natural Gas Storage Report (WNGSR) data

According to our analysis natural gas moved 14 ticks on DOE Natural Gas Storage Report (WNGSR) data on 5 March 2026.

Natural gas (14 ticks)

Charts are exported from JForex (Dukascopy).


U.S. Natural Gas Storage Update: Inventories Decline 132 Bcf but Remain Within Historical Range

The latest Weekly Natural Gas Storage Report from the U.S. Energy Information Administration (EIA), released on March 5, 2026, shows a significant withdrawal from underground natural gas storage for the week ending February 27, 2026. Despite the drawdown, overall storage levels remain within the typical five-year range, suggesting the market is still relatively balanced heading into the final stretch of winter.

Total U.S. Natural Gas Storage

Working gas in underground storage across the Lower 48 states totaled 1,886 billion cubic feet (Bcf) as of February 27, 2026. This represents a net withdrawal of 132 Bcf compared with the previous week, when inventories stood at 2,018 Bcf.

Although inventories declined sharply week-over-week, storage levels are still 115 Bcf higher than the same time last year. However, they remain 43 Bcf below the five-year average of 1,929 Bcf for this time of year.

Overall, the current level of working gas remains within the historical five-year range, indicating that supply levels are neither unusually tight nor excessively high relative to recent seasonal norms.

Regional Storage Changes

The weekly withdrawal was distributed across most major storage regions in the United States.

  • East Region: Stocks fell by 42 Bcf, dropping from 364 Bcf to 322 Bcf.

  • Midwest Region: Storage declined 44 Bcf, bringing inventories down to 397 Bcf.

  • Mountain Region: A modest 3 Bcf withdrawal reduced stocks to 198 Bcf.

  • Pacific Region: Storage slipped 2 Bcf to 257 Bcf.

  • South Central Region: Inventories decreased 41 Bcf to 712 Bcf.

Within the South Central region, withdrawals occurred in both storage types:

  • Salt facilities: down 10 Bcf to 169 Bcf

  • Nonsalt facilities: down 29 Bcf to 544 Bcf

Comparison with Historical Levels

While regional changes were broadly negative for the week, comparisons with historical data reveal mixed trends.

  • The East and Midwest regions remain below their respective five-year averages by 17.0% and 16.2%.

  • Conversely, the Mountain and Pacific regions are significantly above their historical norms, exceeding the five-year averages by 53.5% and 46.0%, respectively.

  • The South Central region sits 6.6% below its five-year average but remains 7.6% higher than last year.

These regional differences highlight the uneven distribution of natural gas inventories across the country, reflecting variations in production, demand, and storage capacity.

Market Context

Large winter withdrawals are typical as heating demand peaks across the United States. A 132 Bcf draw is substantial but not unusual during late winter, particularly during colder periods.

Despite the weekly decline, total inventories remaining above last year’s levels provide a measure of supply security. However, the fact that stocks are still slightly below the five-year average may keep markets attentive to weather patterns and remaining winter demand.

Looking Ahead

The next EIA Weekly Natural Gas Storage Report is scheduled for release on March 12, 2026. As the heating season approaches its final weeks, traders and analysts will closely monitor whether withdrawals continue at a strong pace or begin to slow as temperatures moderate.

How inventories evolve over the coming weeks will help shape expectations for the transition into the spring injection season and the broader natural gas market outlook for 2026.

Disclaimer: This blog post is for informational purposes only and should not be construed as financial advice. Always conduct thorough research and consider seeking advice from a financial professional before making any investment decisions.

Source: https://ir.eia.gov/ngs/ngs.html


Start futures forex fx commodity news trading with Haawks G4A low latency machine-readable data, one of the fastest data feeds for DOE data.

Please let us know your feedback. If you are interested in timestamps, please send us an email to sales@haawks.com.

Comment

Comment

26 ticks potential profit in 74 seconds on 26 February 2026, analysis on futures news trading natural gas on DOE Natural Gas Storage Report (WNGSR) data

According to our analysis natural gas moved 26 ticks on DOE Natural Gas Storage Report (WNGSR) data on 26 February 2026.

Natural gas (26 ticks)

Charts are exported from JForex (Dukascopy).


Weekly Natural Gas Storage Report

Week Ending February 20, 2026
Released: February 26, 2026

The latest Weekly Natural Gas Storage Report shows a moderate draw in inventories as winter demand continues to shape supply dynamics across the Lower 48 states.

Inventory Snapshot

As of February 20, 2026, working gas in underground storage totaled 2,018 billion cubic feet (Bcf). This represents a net decrease of 52 Bcf from the prior week’s level of 2,070 Bcf.

Despite the weekly draw, inventories remain:

  • 141 Bcf higher than the same week last year

  • 7 Bcf below the five-year average (2,025 Bcf)

  • Within the five-year historical range

The current storage level reflects a relatively balanced market position for late February, with stocks tracking close to seasonal norms.

Regional Breakdown

East Region

  • Current stocks: 364 Bcf

  • Weekly change: -24 Bcf

  • 1.6% below last year

  • 13.9% below five-year average

The East saw the largest absolute draw this week, continuing a trend of tighter inventories compared to historical norms.

Midwest

  • Current stocks: 441 Bcf

  • Weekly change: -16 Bcf

  • 1.6% above last year

  • 13.5% below five-year average

The Midwest remains moderately tight versus its five-year average, though slightly above year-ago levels.

Mountain

  • Current stocks: 201 Bcf

  • Weekly change: -6 Bcf

  • 18.2% above last year

  • 50.0% above five-year average

Mountain region inventories remain significantly elevated relative to historical benchmarks.

Pacific

  • Current stocks: 259 Bcf

  • Weekly change: -12 Bcf

  • 30.2% above last year

  • 42.3% above five-year average

The Pacific region continues to carry robust inventory levels compared to both last year and the five-year norm.

South Central

  • Current stocks: 753 Bcf

  • Weekly change: +6 Bcf

Unlike other regions, South Central recorded a net injection this week.

Breakdown:

  • Salt facilities: 179 Bcf (+11 Bcf)

  • Nonsalt facilities: 573 Bcf (-6 Bcf)

South Central inventories are:

  • 7.0% above last year

  • 3.0% below the five-year average

Market Context

The 52 Bcf draw aligns with typical late-winter demand patterns, though regional disparities remain notable:

  • Eastern and Midwestern storage levels are still meaningfully below five-year averages.

  • Western regions (Mountain and Pacific) are running comfortably above historical norms.

  • The South Central region’s net injection highlights regional supply flexibility, particularly in salt cavern facilities.

Overall, total working gas inventories sit just slightly below the five-year average, suggesting a relatively stable supply environment heading toward the final stretch of the winter heating season.

Reliability and Sampling

The report indicates:

  • A total coefficient of variation for stocks of 0.5%

  • A standard error for the net change of 0.8 Bcf

These low sampling variability measures suggest a high degree of statistical confidence in the reported estimates.

Looking Ahead

With inventories still within the five-year range and materially above year-ago levels, the market appears adequately supplied as February closes. Attention now turns to:

  • Late-season cold risk

  • Early spring weather patterns

  • Production trends

  • LNG export demand

The next Weekly Natural Gas Storage Report will be released on March 5, 2026.

As winter winds down, weekly draws and regional storage balances will continue to shape market sentiment and price direction.

Disclaimer: This blog post is for informational purposes only and should not be construed as financial advice. Always conduct thorough research and consider seeking advice from a financial professional before making any investment decisions.

Source: https://ir.eia.gov/ngs/ngs.html


Start futures forex fx commodity news trading with Haawks G4A low latency machine-readable data, one of the fastest data feeds for DOE data.

Please let us know your feedback. If you are interested in timestamps, please send us an email to sales@haawks.com.

Comment

Comment

17 ticks potential profit in 57 seconds on 25 February 2026, analysis on futures news trading crude oil on DOE Petroleum Status Report (WPSR) data

According to our analysis crude oil moved 17 ticks on DOE Petroleum Status Report (WPSR) data on 25 February 2026.

Light sweet crude oil (17 ticks)

Charts are exported from JForex (Dukascopy).


Weekly U.S. Petroleum Update: Inventories Surge as Refinery Activity Slows

The latest Weekly Petroleum Status data for the week ending February 20, 2026 shows a notable build in crude oil inventories, softer refinery activity, and mixed signals across fuel production and demand. Here’s a breakdown of what happened and what it may mean for the market.

Refinery Activity Slows

U.S. crude oil refinery inputs averaged 15.7 million barrels per day (bpd), down 416,000 bpd from the previous week. Refinery utilization stood at 88.6% of operable capacity, reflecting ongoing seasonal maintenance typical for this time of year.

Fuel production also edged lower:

  • Gasoline production averaged 9.2 million bpd

  • Distillate fuel production (diesel and heating oil) averaged 4.8 million bpd, down 136,000 bpd

Overall, while this week’s headline crude build is substantial, broader inventory levels and demand trends suggest a market that remains relatively balanced heading into the spring transition period.

Disclaimer: This blog post is for informational purposes only and should not be construed as financial advice. Always conduct thorough research and consider seeking advice from a financial professional before making any investment decisions.
Source: https://ir.eia.gov/wpsr/wpsrsummary.pdf


Start futures forex fx commodity news trading with Haawks G4A low latency machine-readable data, one of the fastest data feeds for DOE data.

Please let us know your feedback. If you are interested in timestamps, please send us an email to sales@haawks.com.

Comment

Comment

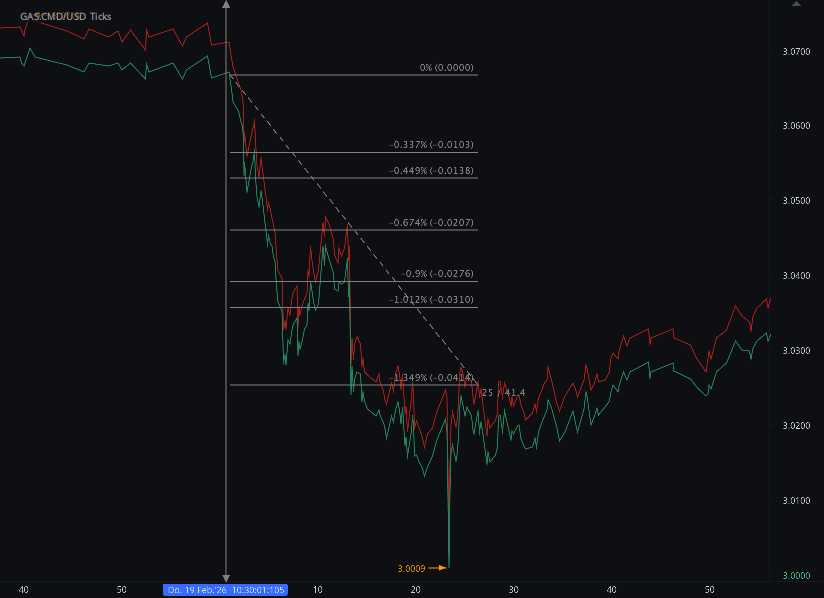
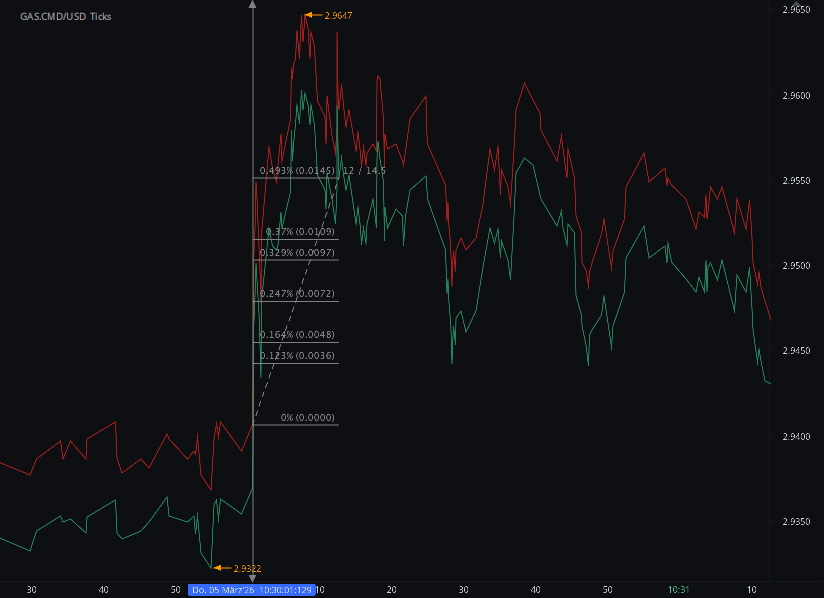
41 ticks potential profit in 25 seconds on 19 February 2026, analysis on futures news trading natural gas on DOE Natural Gas Storage Report (WNGSR) data

According to our analysis natural gas moved 41 ticks on DOE Natural Gas Storage Report (WNGSR) data on 19 February 2026.

Natural gas (41 ticks)

Charts are exported from JForex (Dukascopy).


Weekly Natural Gas Storage Update: Inventories Fall 144 Bcf as Winter Withdrawals Continue

The latest Weekly Natural Gas Storage Report released February 19, 2026, by the U.S. Energy Information Administration (EIA) shows a substantial drawdown in natural gas inventories for the week ending February 13, 2026. As winter demand remains elevated, working gas in underground storage across the Lower 48 states declined by 144 billion cubic feet (Bcf).

Total Storage Snapshot

As of February 13, total working gas in storage stands at 2,070 Bcf, down from 2,214 Bcf the previous week. Key comparisons include:

  • 59 Bcf below the same week in 2025

  • 123 Bcf below the five-year average (2,193 Bcf)

  • Still within the five-year historical range

While inventories are trailing both last year and the five-year average, they remain within normal seasonal boundaries—suggesting that, despite strong withdrawals, storage levels are not yet in concerning territory.

Regional Breakdown

East Region

  • Current stocks: 388 Bcf

  • Weekly change: –50 Bcf

  • 8.9% below last year

  • 16.9% below five-year average

The East posted one of the largest weekly withdrawals, reflecting persistent heating demand in densely populated markets.

Midwest

  • Current stocks: 457 Bcf

  • Weekly change: –53 Bcf

  • 9.1% below last year

  • 18.4% below five-year average

The Midwest experienced the largest regional draw, consistent with colder seasonal temperatures and strong residential and commercial demand.

South Central

  • Current stocks: 747 Bcf

  • Weekly change: –37 Bcf

  • 7.4% below last year

  • 10.2% below five-year average

    • Salt facilities: 168 Bcf (–8 Bcf week over week)

    • Nonsalt facilities: 579 Bcf (–29 Bcf week over week)

Salt storage facilities, often used for high-deliverability needs during peak demand, continue to see steady withdrawals.

Mountain Region

  • Current stocks: 207 Bcf

  • Weekly change: –2 Bcf

  • 12.5% above last year

  • 44.8% above five-year average

The Mountain region remains notably stronger than historical norms, providing a relative buffer compared to other regions.

Pacific Region

  • Current stocks: 271 Bcf

  • Weekly change: –2 Bcf

  • 29.0% above last year

  • 41.1% above five-year average

The Pacific region continues to maintain comfortable inventory levels relative to both last year and the five-year average.

Market Context

A 144 Bcf withdrawal is a sizable weekly decline, typical of mid-February when winter demand often peaks. The cumulative deficit versus the five-year average has widened to 123 Bcf, but overall inventories remain within seasonal norms.

From a market perspective, traders and analysts will closely monitor:

  • Late-season cold weather risks

  • Production trends

  • LNG export demand

  • End-of-season storage projections

If withdrawals continue at an above-average pace, the market could enter injection season with tighter inventories than desired, potentially supporting upward price pressure.

Statistical Reliability

The EIA reports a coefficient of variation of 0.5% for total stocks, indicating a high level of statistical reliability. The standard error for the net change is 0.9 Bcf, suggesting that the reported 144 Bcf draw is well outside the margin of sampling variability.

Looking Ahead

The next storage report will be released February 26, 2026. With only a few weeks remaining in the traditional withdrawal season, attention is shifting toward:

  • End-of-March storage levels

  • Early injection season dynamics

  • Summer supply-demand balance

For now, inventories remain adequate but leaner than historical norms—a dynamic that could shape market sentiment heading into spring.

As always, natural gas storage remains one of the most closely watched indicators of U.S. energy market health.

Disclaimer: This blog post is for informational purposes only and should not be construed as financial advice. Always conduct thorough research and consider seeking advice from a financial professional before making any investment decisions.
Source: https://ir.eia.gov/ngs/ngs.html


Start futures forex fx commodity news trading with Haawks G4A low latency machine-readable data, one of the fastest data feeds for DOE data.

Please let us know your feedback. If you are interested in timestamps, please send us an email to sales@haawks.com.

Comment

Comment

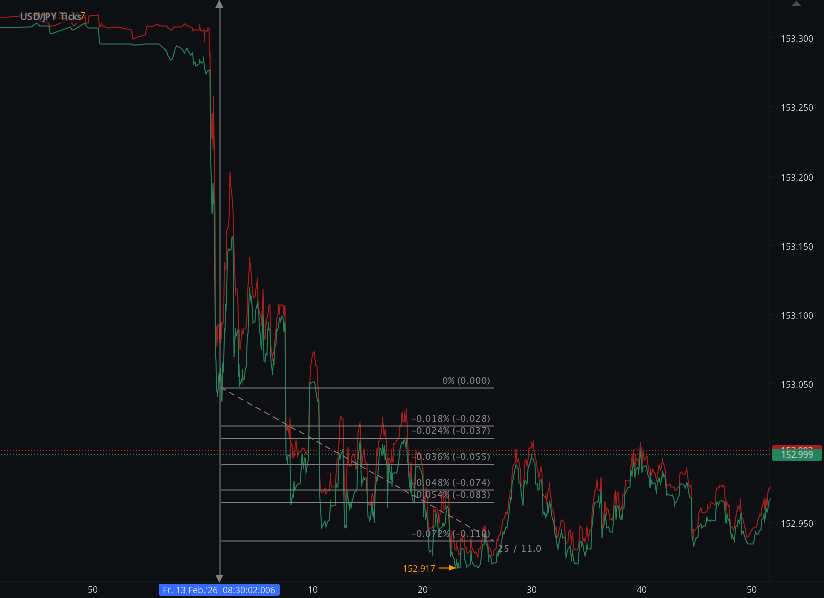
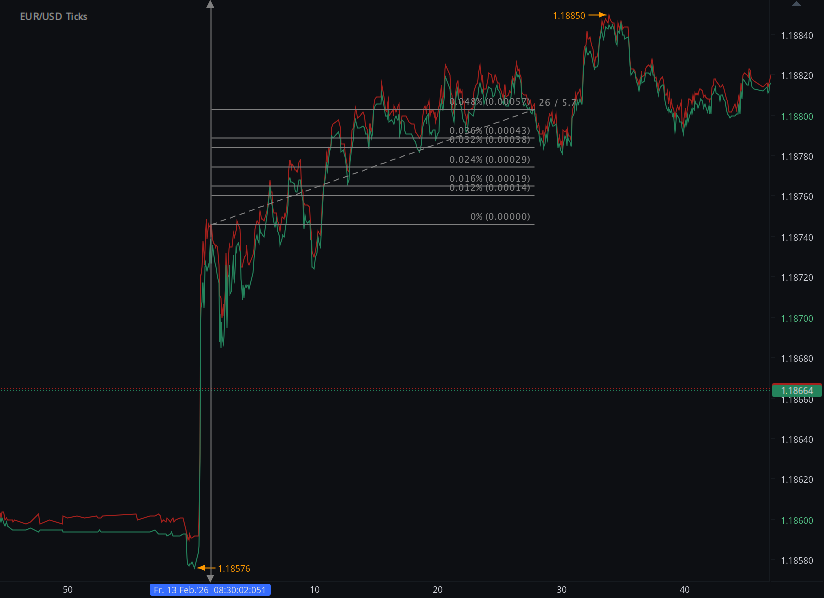
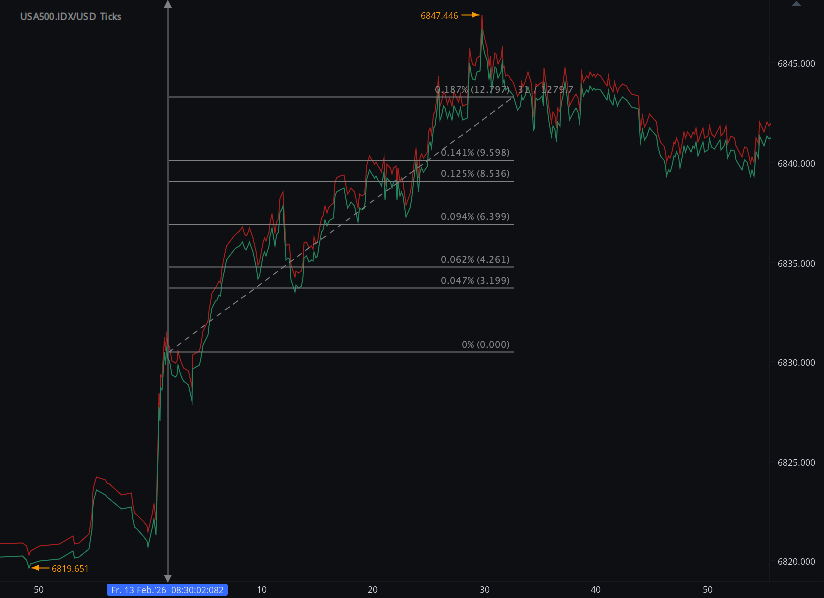
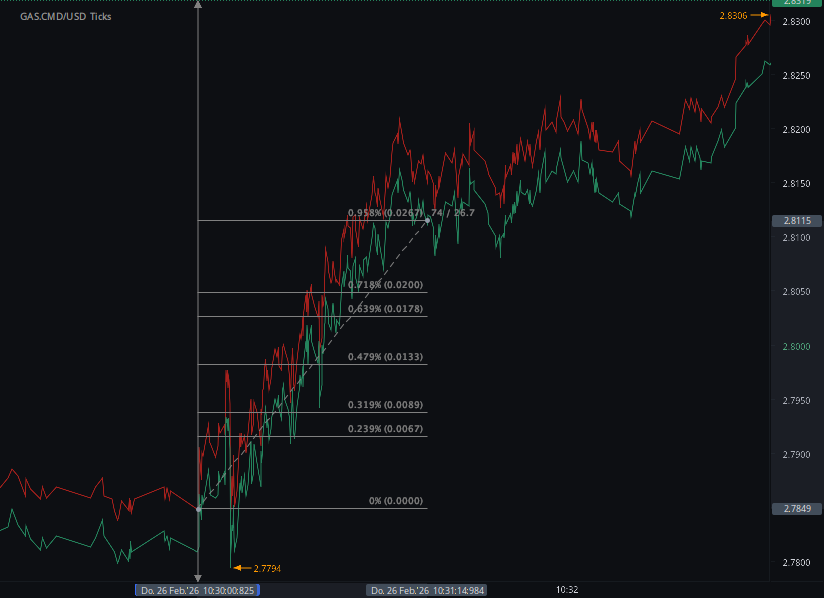
16 pips, US500 12 points points potential profit in 31 seconds on 13 February 2026, analysis on futures forex fx low latency news trading USDJPY, EURUSD and US500 on US Consumer Price Index (CPI)

According to our analysis USDJPY and EURUSD moved 16 pips and US500 moved 12 points on US BLS Consumer Price Index (CPI) data on 13 February 2026.

USDJPY (11 pips)

EURUSD (5 pips)

US500 (12 points)

Charts are exported from JForex (Dukascopy).


Inflation Cools Further in January 2026 as Energy Prices Fall

The latest data from the U.S. Bureau of Labor Statistics show that inflation continued to moderate in January 2026, with overall price growth easing on both a monthly and annual basis.

Headline Inflation: Modest Monthly Increase

The Consumer Price Index for All Urban Consumers (CPI-U) rose 0.2 percent in January (seasonally adjusted). Over the past 12 months, prices increased 2.4 percent, down from 2.7 percent in December.

This marks continued progress toward price stability, with year-over-year inflation now firmly in the mid-2 percent range.

What Drove January’s Increase?

Several categories contributed to the monthly increase:

  • Shelter: +0.2%

  • Food: +0.2%

  • Core inflation (all items less food and energy): +0.3%

However, falling energy prices helped offset some of the upward pressure.

Energy Prices: A Key Relief Factor

Energy prices declined 1.5 percent in January, providing a notable offset to increases elsewhere.

  • Gasoline: −3.2% (−7.5% over the past year)

  • Electricity: −0.1% (but +6.3% over the past year)

  • Natural gas: +1.0% (+9.8% over the past year)

Over the last 12 months, overall energy prices are down 0.1 percent, largely due to the steep annual decline in gasoline.

Food Prices: Gradual but Persistent Growth

Food prices increased 0.2 percent in January.

Grocery Prices (Food at Home): +0.2%

Five of six major grocery categories rose:

  • Cereals and bakery products: +1.2%

  • Dairy products: +0.8%

  • Meats, poultry, fish, and eggs: +0.2%

  • Fruits and vegetables: +0.1%

  • Nonalcoholic beverages: +0.1%

On a 12-month basis, grocery prices are up 2.1 percent.

Dining Out (Food Away from Home): +0.1%

Restaurant prices rose more modestly in January but are still up 4.0 percent over the past year, with:

  • Full service meals: +4.7%

  • Limited service meals: +3.2%

Restaurant inflation continues to outpace grocery inflation.

Core Inflation: Services Still Firm

Core CPI (excluding food and energy) rose 0.3 percent in January and is up 2.5 percent year-over-year.

Key contributors:

Shelter

  • +0.2% in January

  • +3.0% over the past year

Owners’ equivalent rent and rent both rose 0.2% for the month.

Transportation Services

  • +1.4% in January

  • Airline fares surged 6.5% for the month.

Medical Care

  • +0.3% in January

  • +3.9% over the past year

  • Hospital services: +0.9% in January

Used Cars

  • −1.8% in January

  • −2.0% over the past year

Vehicle prices continue to normalize after earlier volatility.

Big Picture: Inflation Is Cooling, But Not Gone

Here’s where inflation stands:

Category12-Month ChangeAll Items2.4%Core (less food & energy)2.5%Food2.9%Energy−0.1%Shelter3.0%

The overall trend shows:

  • Energy prices helping moderate inflation.

  • Core services (especially shelter and medical care) continuing to rise.

  • Restaurant inflation remaining elevated.

  • Goods prices (like used vehicles) generally softening.

Additional Notes

  • The CPI index level now stands at 325.252 (1982–84 = 100).

  • CPI-W (Urban Wage Earners and Clerical Workers) rose 2.2% year-over-year.

  • The Chained CPI (C-CPI-U) increased 2.2% year-over-year.

  • October and November 2025 data were unavailable due to the 2025 lapse in appropriations.

  • Seasonal adjustment factors were revised, affecting data back five years.

What to Watch Next

The February 2026 CPI report will be released on March 11, 2026.

Markets and policymakers will be watching closely to see:

  • Whether energy continues to ease pressure,

  • If shelter inflation continues to moderate,

  • And whether core services remain sticky.

For now, January’s data suggest inflation is gradually stabilizing, though certain categories—particularly services—remain areas of persistent upward pressure.

Disclaimer: This blog post is for informational purposes only and should not be construed as financial advice. Always conduct thorough research and consider seeking advice from a financial professional before making any investment decisions.
Source: https://www.bls.gov/news.release/cpi.nr0.htm


Start futures forex fx news trading with Haawks G4A low latency machine-readable data, one of the fastest machine-readable news trading feed for US macro-economic and commodity data.

Please let us know your feedback. If you are interested in timestamps, please send us an email to sales@haawks.com.

Comment

Comment

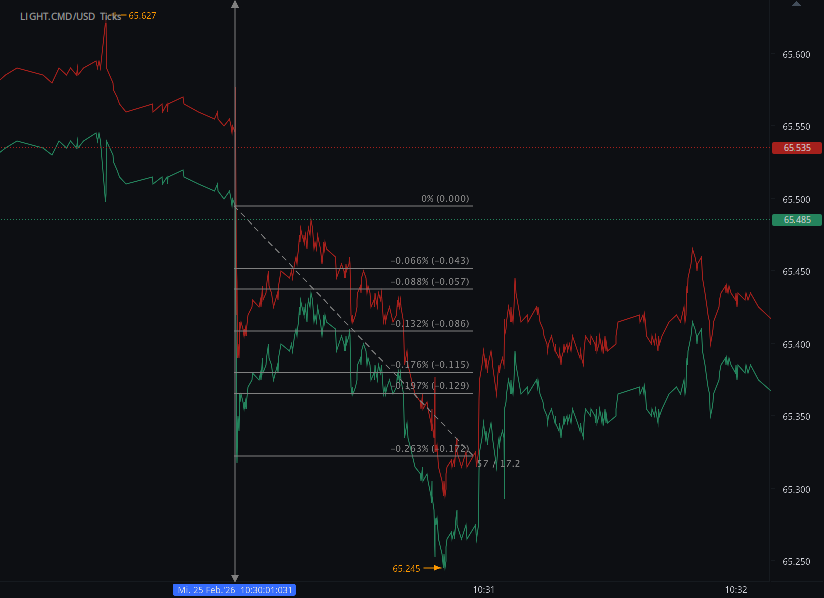
23 ticks potential profit in 26 seconds on 12 February 2026, analysis on futures news trading natural gas on DOE Natural Gas Storage Report (WNGSR) data

According to our analysis natural gas moved 23 ticks on DOE Natural Gas Storage Report (WNGSR) data on 12 February 2026.

Natural gas (23 ticks)

Charts are exported from JForex (Dukascopy).


Weekly Natural Gas Storage Update

Week Ending February 6, 2026

The latest data from the U.S. Energy Information Administration (EIA) shows a substantial withdrawal from U.S. natural gas storage as winter demand continues to impact inventories nationwide.

As of Friday, February 6, 2026, working gas in underground storage totaled 2,214 billion cubic feet (Bcf). This represents a net decrease of 249 Bcf from the previous week — one of the larger withdrawals typical of peak winter demand season.

Storage Levels at a Glance

Here’s how current inventories compare:

  • 97 Bcf lower than this time last year

  • 130 Bcf below the five-year average (2021–2025) of 2,344 Bcf

  • Still within the five-year historical range

While inventories are trailing both last year’s level and the five-year average, total working gas remains within the normal seasonal range, suggesting supply conditions are tight but not abnormal.

Regional Breakdown

East Region

  • Current stocks: 438 Bcf

  • Weekly change: -64 Bcf

  • 7.6% below last year

  • 13.4% below five-year average

The East region saw a significant draw as heating demand remained elevated.

Midwest Region

  • Current stocks: 510 Bcf

  • Weekly change: -74 Bcf

  • 9.9% below last year

  • 16.5% below five-year average

The Midwest experienced one of the largest withdrawals of the week, consistent with sustained cold temperatures across major population centers.

Mountain Region

  • Current stocks: 209 Bcf

  • Weekly change: -4 Bcf

  • 7.7% above last year

  • 37.5% above five-year average

The Mountain region remains comparatively well-supplied, with inventories well above historical norms.

Pacific Region

  • Current stocks: 273 Bcf

  • Weekly change: +1 Bcf

  • 21.3% above last year

  • 35.1% above five-year average

The Pacific region recorded a slight net injection and continues to hold comfortable inventory levels.

South Central Region

  • Current stocks: 784 Bcf

  • Weekly change: -107 Bcf

Breakdown:

  • Salt facilities: -52 Bcf

  • Nonsalt facilities: -55 Bcf

The South Central region posted the largest regional withdrawal, reflecting strong residential demand and ongoing LNG export activity along the Gulf Coast.

Data Reliability

The EIA reports a 0.5% coefficient of variation for total stocks, indicating high statistical confidence in overall inventory estimates. The standard error for the weekly net change was 1.7 Bcf, small relative to the 249 Bcf withdrawal.

Market Implications

Large winter withdrawals are typical in early February, but inventories running below both last year and the five-year average can add upward pressure to natural gas prices — particularly if:

  • Cold weather persists,

  • LNG exports remain strong,

  • Or late-season winter storms increase heating demand.

For now, storage levels remain within historical norms, which helps reduce concerns about supply shortages. However, the pace of withdrawals over the next several weeks will be critical in shaping market expectations as winter progresses.

The next storage report is scheduled for release on February 19, 2026.

Disclaimer: This blog post is for informational purposes only and should not be construed as financial advice. Always conduct thorough research and consider seeking advice from a financial professional before making any investment decisions.
Source: https://ir.eia.gov/ngs/ngs.html


Start futures forex fx commodity news trading with Haawks G4A low latency machine-readable data, one of the fastest data feeds for DOE data.

Please let us know your feedback. If you are interested in timestamps, please send us an email to sales@haawks.com.

Comment