According to our analysis natural gas moved 17 ticks on DOE Natural Gas Storage Report (WNGSR) data on 29 January 2026.
Natural gas (17 ticks)
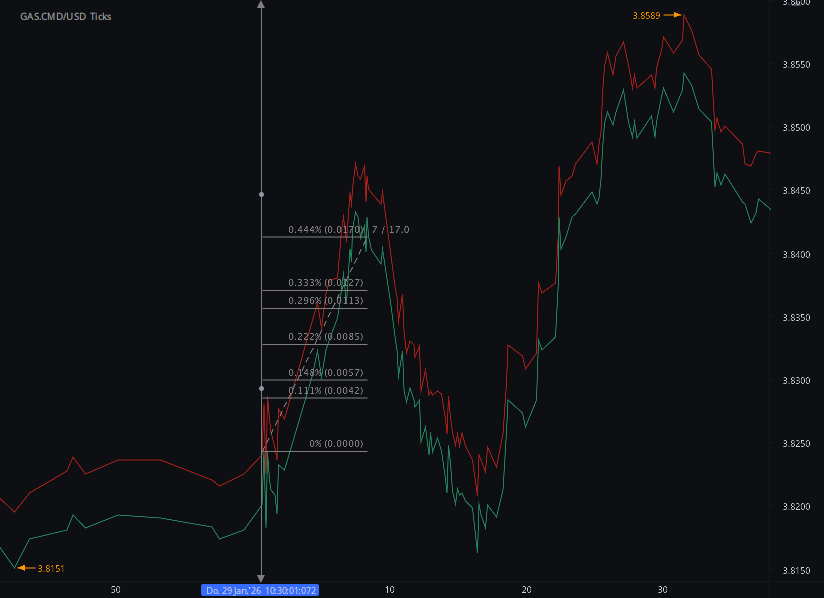
Charts are exported from JForex (Dukascopy).
Natural Gas Storage Update: A Big Winter Draw, But Still Comfortable
The latest Weekly Natural Gas Storage Report from the U.S. Energy Information Administration (EIA) delivers a headline-grabbing number: a 242 billion cubic feet (Bcf) withdrawal for the week ending January 23, 2026. That’s a hefty pull from storage—but zooming out, the U.S. gas market remains in a relatively solid position for late January.
Let’s break down what’s happening and why it matters.
The Big Picture: Where Storage Stands
As of January 23, working gas in underground storage totaled 2,823 Bcf across the Lower 48 states. That’s:
206 Bcf higher than this time last year
143 Bcf above the five-year average of 2,680 Bcf
Within the historical five-year range, despite the large weekly draw
In short: winter demand is clearly doing its thing, but inventories are still comfortably padded.
Regional Breakdown: Who Pulled the Most?
Every region saw withdrawals last week, with cold-driven demand leaving a visible mark.
South Central Leads the Way
−89 Bcf on the week
Total storage now at 1,050 Bcf
Still 14.1% above last year and 8.6% above the five-year average
Salt caverns accounted for a sizable portion of the draw, which is typical during periods of high, short-term demand.
Midwest Feels the Chill
−76 Bcf weekly change
Storage sits at 676 Bcf
Nearly flat versus last year, but 6.4% below the five-year average
This suggests the Midwest is leaning more heavily on storage relative to recent norms.
East Region Stays Balanced
−55 Bcf withdrawal
Ending the week at 577 Bcf
Slightly above last year, slightly below the five-year average
West Holds Strong
Mountain: −14 Bcf, but a striking 34% above the five-year average
Pacific: −9 Bcf, nearly 33% above the five-year average
The West continues to stand out for its strong inventory cushion.
A Large Draw—But Not a Red Flag
A 242 Bcf withdrawal is significant, especially compared with milder winters in recent years. Still, context matters:
Storage levels remain well above normal
Sampling variability is low (total coefficient of variation just 0.4%)
There’s no immediate signal of supply stress
Unless colder-than-normal weather persists deep into February or production falters, the market appears well-positioned to ride out the remainder of winter.
What to Watch Next
Looking ahead to the next EIA release on February 5, key questions include:
Will withdrawals stay this large, or ease with moderating temperatures?
Can storage remain above the five-year average through peak winter demand?
How will regional imbalances—especially in the Midwest—evolve?
For now, the takeaway is clear: winter is biting, but storage is holding up.
Stay tuned—February is often where the real storage story gets written.
Disclaimer: This blog post is for informational purposes only and should not be construed as financial advice. Always conduct thorough research and consider seeking advice from a financial professional before making any investment decisions.
Source: https://ir.eia.gov/ngs/ngs.html
Start futures forex fx commodity news trading with Haawks G4A low latency machine-readable data, one of the fastest data feeds for DOE data.
Please let us know your feedback. If you are interested in timestamps, please send us an email to sales@haawks.com.