According to our analysis natural gas moved 66 ticks on DOE Natural Gas Storage Report data on 15 January 2026.
Natural gas (66 ticks)
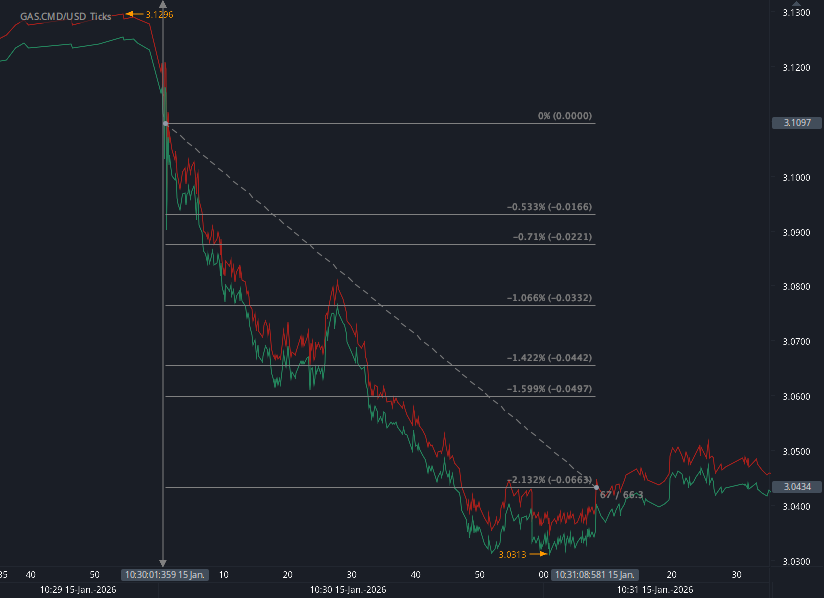
Charts are exported from JForex (Dukascopy).
U.S. Natural Gas Storage Update: A Comfortable Cushion Heading Into Mid-January
The latest Weekly Natural Gas Storage Report from the U.S. Energy Information Administration (EIA) shows that U.S. natural gas inventories remain solidly above normal as the winter heating season continues.
As of Friday, January 9, 2026, working gas in underground storage across the Lower 48 states totaled 3,185 billion cubic feet (Bcf). That represents a weekly withdrawal of 71 Bcf, in line with typical winter demand but notably less aggressive than what might be expected during periods of severe cold.
Big Picture: Above Average and Within Range
Despite the weekly draw, storage levels continue to offer a strong buffer:
33 Bcf higher than this time last year
106 Bcf above the five-year average of 3,079 Bcf
Firmly within the historical five-year range
This positioning suggests that, nationally, the market remains well supplied, reducing the risk of near-term shortages even if colder weather emerges later in the season.
Regional Breakdown: Where the Gas Moved
Most regions saw withdrawals during the week, reflecting seasonal heating demand:
East:
Stocks fell by 33 Bcf, leaving inventories 2.2% below last year and 5.8% below the five-year average—a sign of tighter conditions in the region most sensitive to winter heating loads.Midwest:
A 31 Bcf draw pushed inventories 3.4% below last year and 6.2% under the five-year norm, continuing a trend of stronger winter usage.Mountain & Pacific:
Smaller declines of 5 Bcf and 2 Bcf, respectively. Both regions remain well above historical averages, with the Mountain region more than 30% above its five-year average.South Central:
Notably, no net change week over week. Salt storage increased by 12 Bcf, while nonsalt facilities declined by the same amount—keeping total inventories steady and comfortably above both last year and the five-year average.
What This Means for the Market
The data paints a picture of a well-balanced natural gas market:
Storage remains ample despite winter withdrawals
Regional tightness exists, particularly in the East and Midwest
Producing and storage hubs in the South Central region continue to provide stability
Unless prolonged extreme cold materializes, inventories appear sufficient to carry the market through the remainder of winter without major stress.
Looking Ahead
The next EIA storage report will be released on January 22, 2026. With winter far from over, traders and consumers alike will be watching whether withdrawals accelerate—or if above-average storage continues to keep prices and supply risks in check.
For now, the message is clear: the U.S. entered mid-January with a healthy natural gas safety net.
Disclaimer: This blog post is for informational purposes only and should not be construed as financial advice. Always conduct thorough research and consider seeking advice from a financial professional before making any investment decisions.
Source: https://ir.eia.gov/ngs/ngs.html
Start futures forex fx commodity news trading with Haawks G4A low latency machine-readable data, one of the fastest data feeds for DOE data.
Please let us know your feedback. If you are interested in timestamps, please send us an email to sales@haawks.com.