According to our analysis natural gas moved 26 ticks on DOE Natural Gas Storage Report (WNGSR) data on 26 February 2026.
Natural gas (26 ticks)
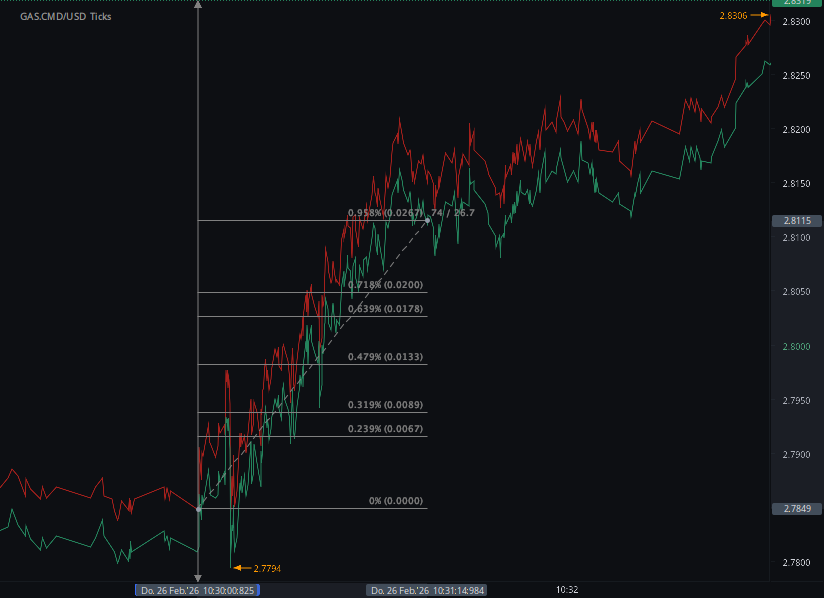
Charts are exported from JForex (Dukascopy).
Weekly Natural Gas Storage Report
Week Ending February 20, 2026
Released: February 26, 2026
The latest Weekly Natural Gas Storage Report shows a moderate draw in inventories as winter demand continues to shape supply dynamics across the Lower 48 states.
Inventory Snapshot
As of February 20, 2026, working gas in underground storage totaled 2,018 billion cubic feet (Bcf). This represents a net decrease of 52 Bcf from the prior week’s level of 2,070 Bcf.
Despite the weekly draw, inventories remain:
141 Bcf higher than the same week last year
7 Bcf below the five-year average (2,025 Bcf)
Within the five-year historical range
The current storage level reflects a relatively balanced market position for late February, with stocks tracking close to seasonal norms.
Regional Breakdown
East Region
Current stocks: 364 Bcf
Weekly change: -24 Bcf
1.6% below last year
13.9% below five-year average
The East saw the largest absolute draw this week, continuing a trend of tighter inventories compared to historical norms.
Midwest
Current stocks: 441 Bcf
Weekly change: -16 Bcf
1.6% above last year
13.5% below five-year average
The Midwest remains moderately tight versus its five-year average, though slightly above year-ago levels.
Mountain
Current stocks: 201 Bcf
Weekly change: -6 Bcf
18.2% above last year
50.0% above five-year average
Mountain region inventories remain significantly elevated relative to historical benchmarks.
Pacific
Current stocks: 259 Bcf
Weekly change: -12 Bcf
30.2% above last year
42.3% above five-year average
The Pacific region continues to carry robust inventory levels compared to both last year and the five-year norm.
South Central
Current stocks: 753 Bcf
Weekly change: +6 Bcf
Unlike other regions, South Central recorded a net injection this week.
Breakdown:
Salt facilities: 179 Bcf (+11 Bcf)
Nonsalt facilities: 573 Bcf (-6 Bcf)
South Central inventories are:
7.0% above last year
3.0% below the five-year average
Market Context
The 52 Bcf draw aligns with typical late-winter demand patterns, though regional disparities remain notable:
Eastern and Midwestern storage levels are still meaningfully below five-year averages.
Western regions (Mountain and Pacific) are running comfortably above historical norms.
The South Central region’s net injection highlights regional supply flexibility, particularly in salt cavern facilities.
Overall, total working gas inventories sit just slightly below the five-year average, suggesting a relatively stable supply environment heading toward the final stretch of the winter heating season.
Reliability and Sampling
The report indicates:
A total coefficient of variation for stocks of 0.5%
A standard error for the net change of 0.8 Bcf
These low sampling variability measures suggest a high degree of statistical confidence in the reported estimates.
Looking Ahead
With inventories still within the five-year range and materially above year-ago levels, the market appears adequately supplied as February closes. Attention now turns to:
Late-season cold risk
Early spring weather patterns
Production trends
LNG export demand
The next Weekly Natural Gas Storage Report will be released on March 5, 2026.
As winter winds down, weekly draws and regional storage balances will continue to shape market sentiment and price direction.
Disclaimer: This blog post is for informational purposes only and should not be construed as financial advice. Always conduct thorough research and consider seeking advice from a financial professional before making any investment decisions.
Source: https://ir.eia.gov/ngs/ngs.html
Start futures forex fx commodity news trading with Haawks G4A low latency machine-readable data, one of the fastest data feeds for DOE data.
Please let us know your feedback. If you are interested in timestamps, please send us an email to sales@haawks.com.