According to our analysis natural gas moved 23 ticks on DOE Natural Gas Storage Report (WNGSR) data on 12 February 2026.
Natural gas (23 ticks)
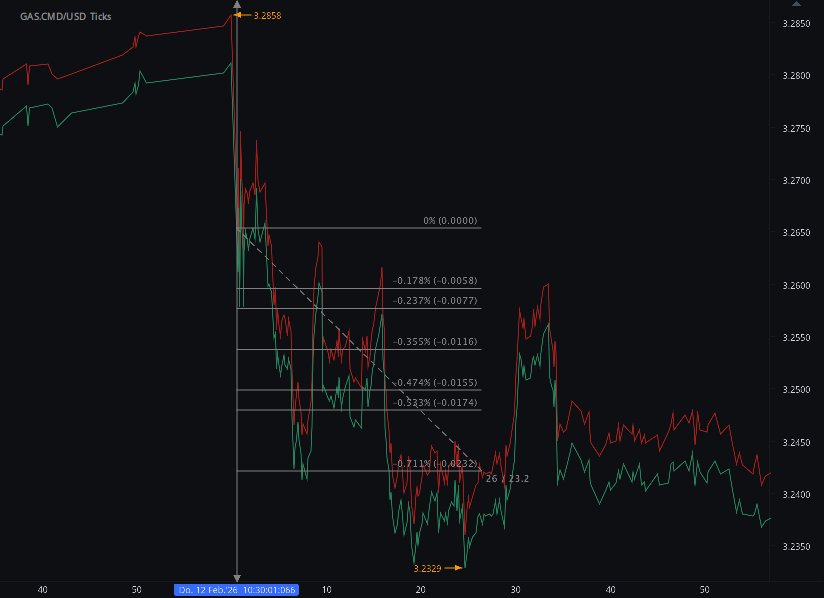
Charts are exported from JForex (Dukascopy).
Weekly Natural Gas Storage Update
Week Ending February 6, 2026
The latest data from the U.S. Energy Information Administration (EIA) shows a substantial withdrawal from U.S. natural gas storage as winter demand continues to impact inventories nationwide.
As of Friday, February 6, 2026, working gas in underground storage totaled 2,214 billion cubic feet (Bcf). This represents a net decrease of 249 Bcf from the previous week — one of the larger withdrawals typical of peak winter demand season.
Storage Levels at a Glance
Here’s how current inventories compare:
97 Bcf lower than this time last year
130 Bcf below the five-year average (2021–2025) of 2,344 Bcf
Still within the five-year historical range
While inventories are trailing both last year’s level and the five-year average, total working gas remains within the normal seasonal range, suggesting supply conditions are tight but not abnormal.
Regional Breakdown
East Region
Current stocks: 438 Bcf
Weekly change: -64 Bcf
7.6% below last year
13.4% below five-year average
The East region saw a significant draw as heating demand remained elevated.
Midwest Region
Current stocks: 510 Bcf
Weekly change: -74 Bcf
9.9% below last year
16.5% below five-year average
The Midwest experienced one of the largest withdrawals of the week, consistent with sustained cold temperatures across major population centers.
Mountain Region
Current stocks: 209 Bcf
Weekly change: -4 Bcf
7.7% above last year
37.5% above five-year average
The Mountain region remains comparatively well-supplied, with inventories well above historical norms.
Pacific Region
Current stocks: 273 Bcf
Weekly change: +1 Bcf
21.3% above last year
35.1% above five-year average
The Pacific region recorded a slight net injection and continues to hold comfortable inventory levels.
South Central Region
Current stocks: 784 Bcf
Weekly change: -107 Bcf
Breakdown:
Salt facilities: -52 Bcf
Nonsalt facilities: -55 Bcf
The South Central region posted the largest regional withdrawal, reflecting strong residential demand and ongoing LNG export activity along the Gulf Coast.
Data Reliability
The EIA reports a 0.5% coefficient of variation for total stocks, indicating high statistical confidence in overall inventory estimates. The standard error for the weekly net change was 1.7 Bcf, small relative to the 249 Bcf withdrawal.
Market Implications
Large winter withdrawals are typical in early February, but inventories running below both last year and the five-year average can add upward pressure to natural gas prices — particularly if:
Cold weather persists,
LNG exports remain strong,
Or late-season winter storms increase heating demand.
For now, storage levels remain within historical norms, which helps reduce concerns about supply shortages. However, the pace of withdrawals over the next several weeks will be critical in shaping market expectations as winter progresses.
The next storage report is scheduled for release on February 19, 2026.
Disclaimer: This blog post is for informational purposes only and should not be construed as financial advice. Always conduct thorough research and consider seeking advice from a financial professional before making any investment decisions.
Source: https://ir.eia.gov/ngs/ngs.html
Start futures forex fx commodity news trading with Haawks G4A low latency machine-readable data, one of the fastest data feeds for DOE data.
Please let us know your feedback. If you are interested in timestamps, please send us an email to sales@haawks.com.