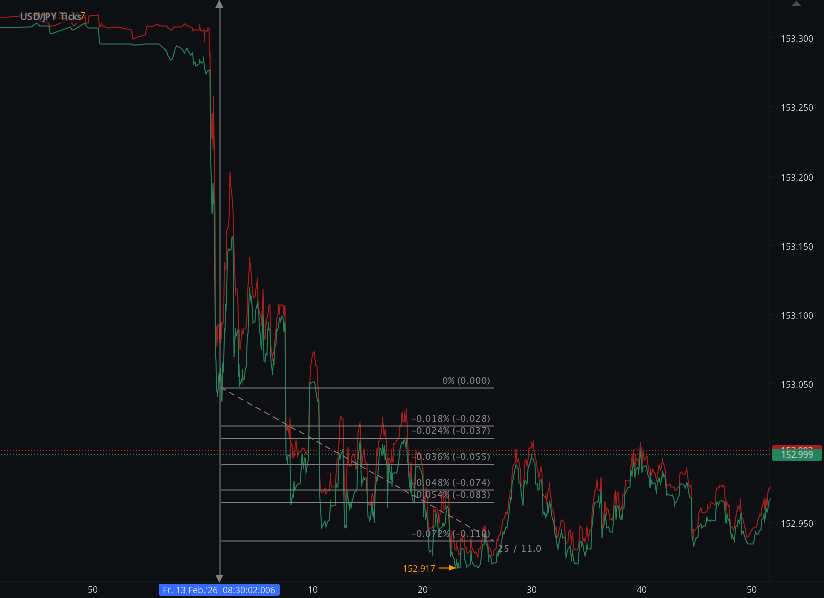
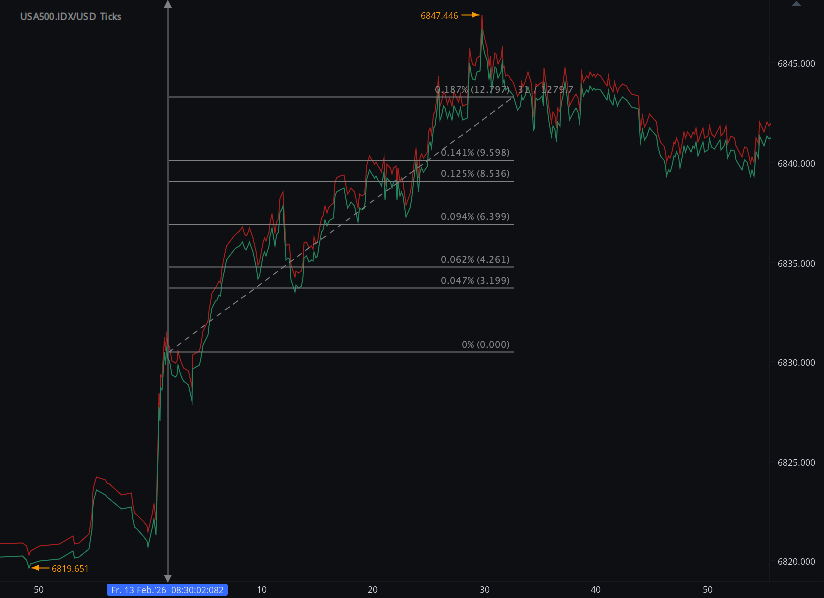
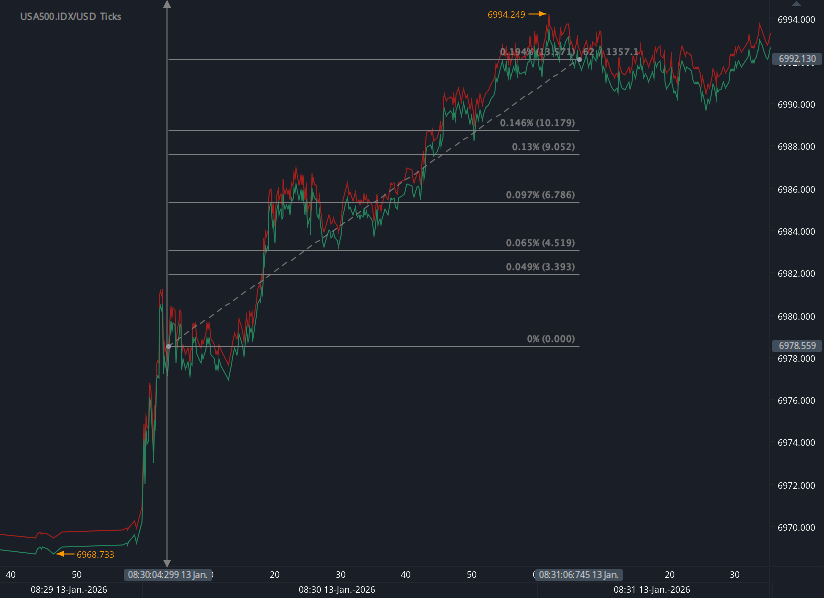
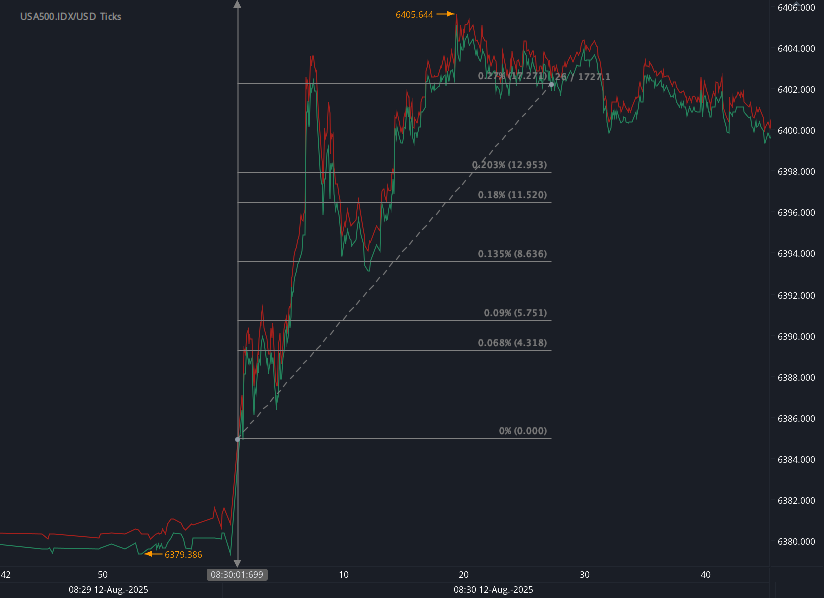
According to our analysis US500 moved 5 points (20 ticks) on US BLS Producer Price Index (PPI) data on 13 May 2026.
US500 (5 points / 20 ticks)
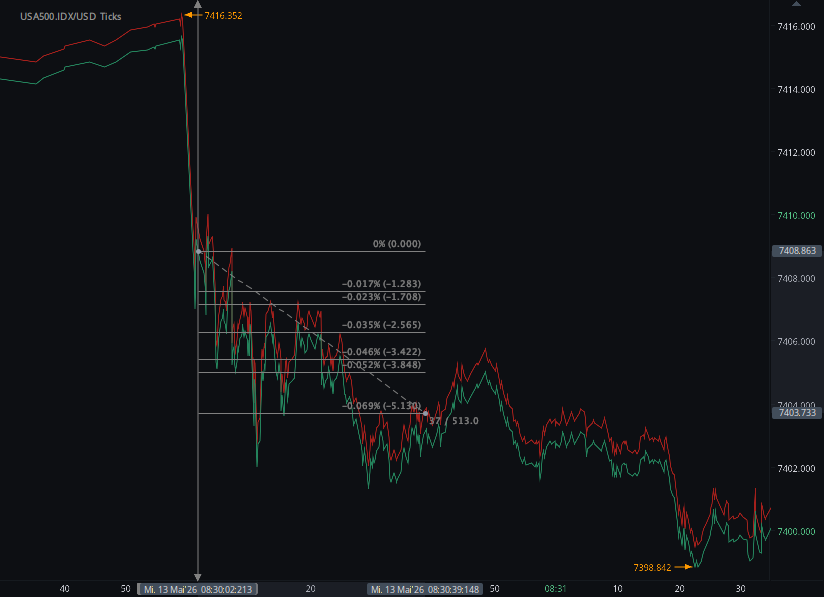
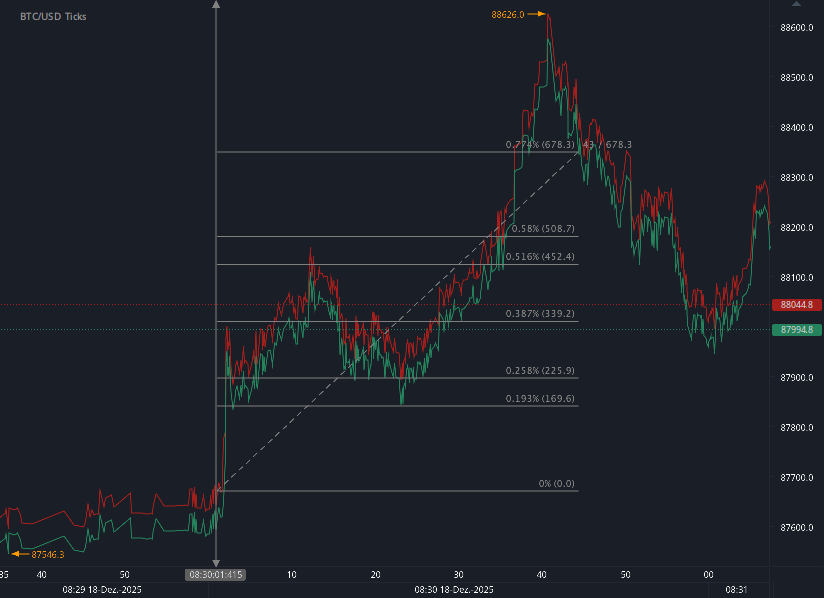
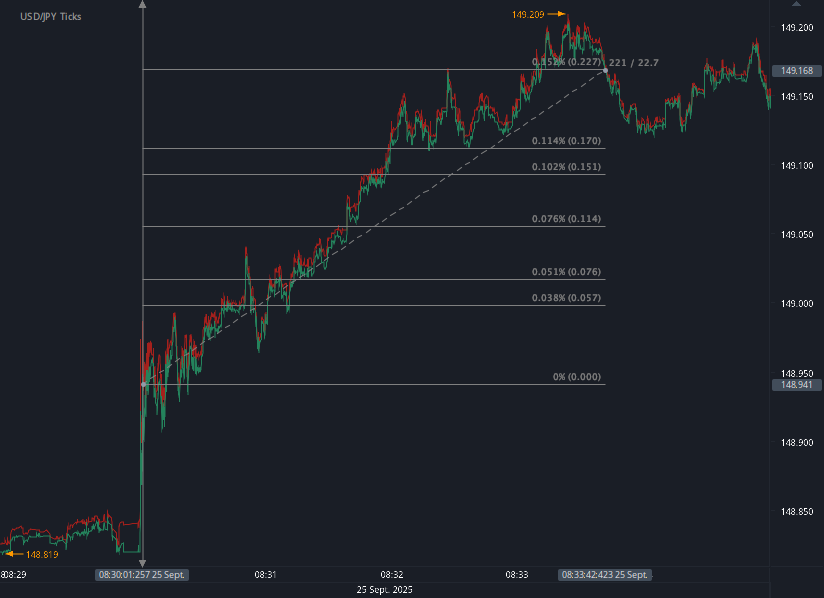
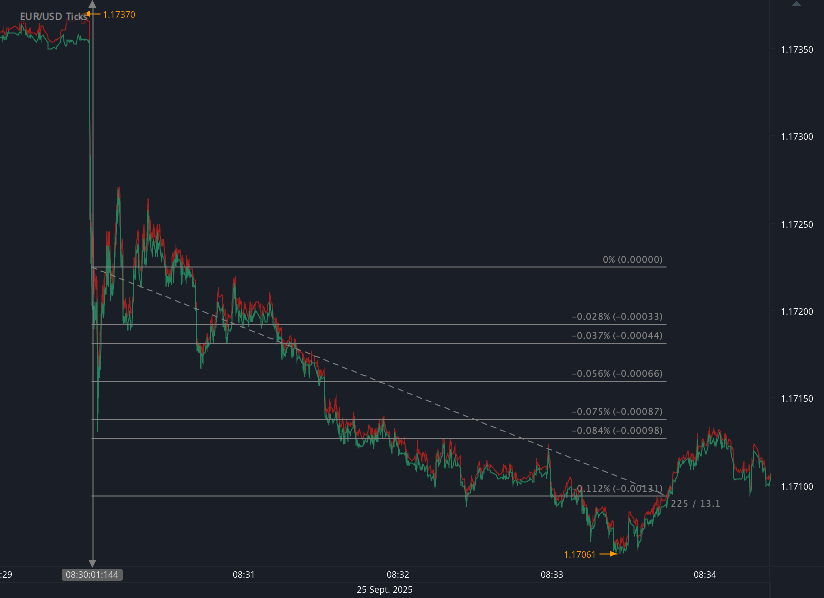
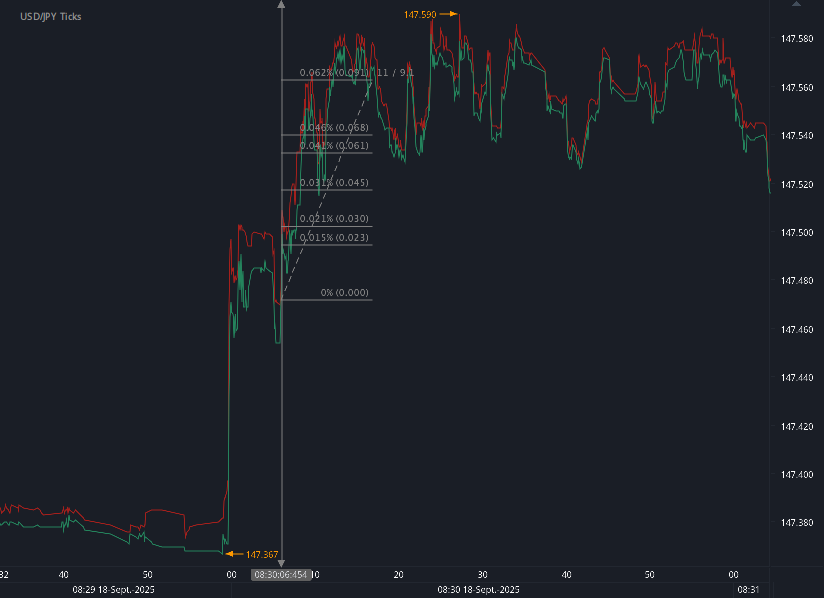
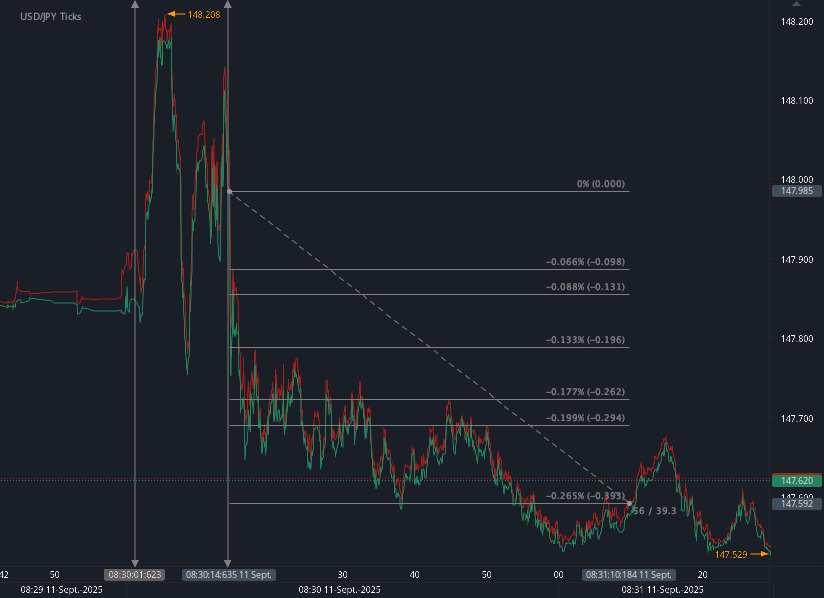
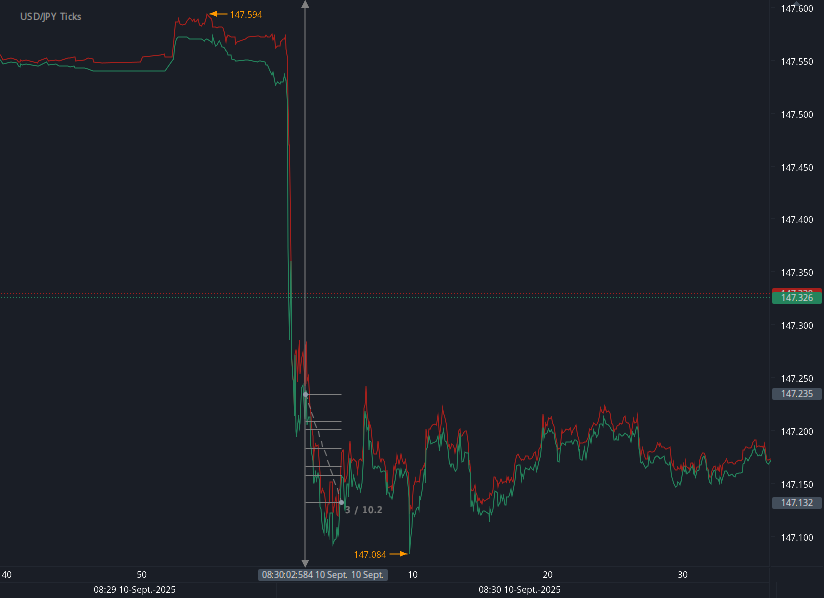
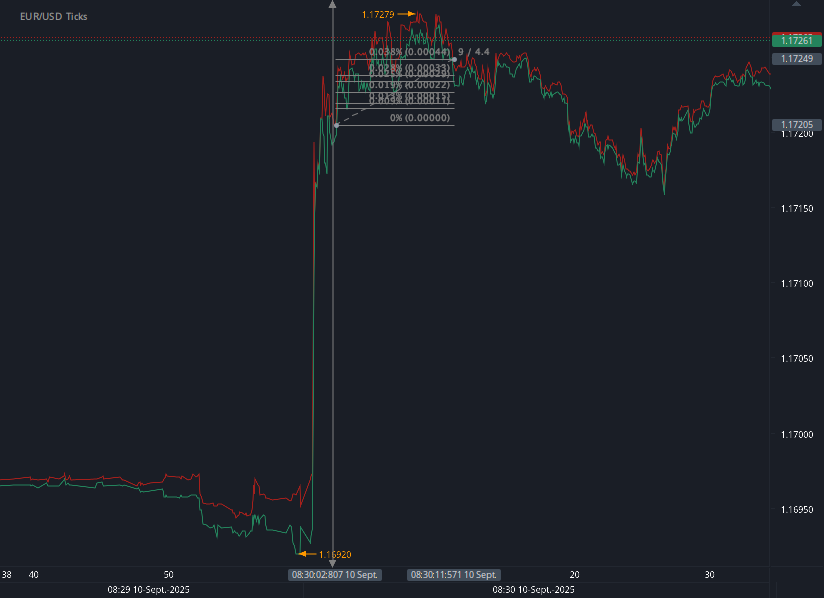
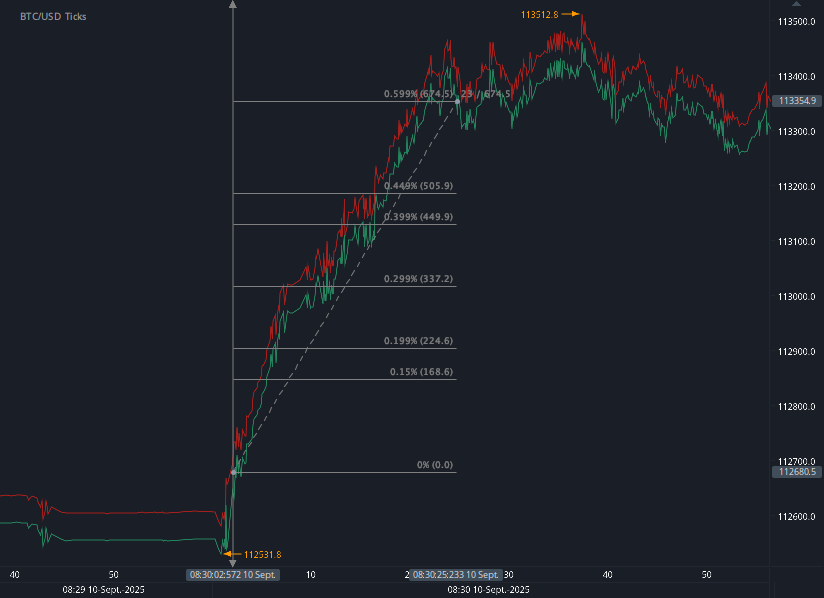
Charts are exported from JForex (Dukascopy).
April 2026 PPI: Wholesale Inflation Surges as Energy, Freight, and Trade Margins Jump
The April 2026 Producer Price Index report delivered a clear signal: price pressures at the producer level accelerated sharply.
The Producer Price Index for final demand rose 1.4% in April, seasonally adjusted, according to the U.S. Bureau of Labor Statistics. That followed increases of 0.7% in March and 0.6% in February, making April the largest monthly gain since March 2022.
On a year-over-year basis, final demand prices were up 6.0%, the largest 12-month increase since December 2022.
For businesses, consumers, and policymakers, the report suggests that inflation pressures are not just lingering; they may be broadening again across key parts of the economy.
Services Did Most of the Heavy Lifting
Nearly 60% of April’s increase in final demand prices came from services. The index for final demand services rose 1.2%, its largest monthly increase since March 2022.
A major driver was trade services, where margins received by wholesalers and retailers jumped 2.7%. Transportation and warehousing services also surged, rising 5.0% in the month.
Several categories contributed to the rise, including:
Machinery and equipment wholesaling
Truck transportation of freight
Fuels and lubricants retailing
Health, beauty, and optical goods retailing
Chemicals and allied products wholesaling
Legal services
Not every service category moved higher. Portfolio management prices fell 2.4%, while food retailing margins and metals, minerals, and ores wholesaling margins also declined.
Still, the services side of the report was notably strong, especially in areas tied to distribution, freight, and wholesale margins.
Goods Prices Also Rose Sharply
Final demand goods prices increased 2.0% in April after rising 1.9% in March.
Energy was the main story. Final demand energy prices jumped 7.8%, accounting for more than three-quarters of the overall goods increase.
Gasoline alone rose 15.6% and accounted for more than 40% of the April rise in final demand goods prices. Other energy-related increases included jet fuel, diesel fuel, and residual fuels.
There were also increases in fresh and dry vegetables and industrial chemicals.
One striking exception was chicken eggs, whose index dropped 49.7%. Nonferrous scrap and residential natural gas prices also declined.
Core Producer Inflation Picked Up Too
The index for final demand less foods, energy, and trade services rose 0.6% in April. That was the largest increase since October 2025.
Over the past 12 months, this core measure increased 4.4%, the largest year-over-year gain since February 2023.
That matters because this measure strips out some of the most volatile categories. A strong increase here suggests the April report was not only about energy swings. Underlying price pressure also strengthened.
Intermediate Demand Shows Pipeline Pressure
The report also showed strong increases earlier in the production chain.
Processed goods for intermediate demand rose 2.7% in April, the sixth straight monthly increase. Processed energy goods rose 7.8%, while processed materials excluding food and energy increased 1.5%.
Over the past year, processed goods for intermediate demand rose 9.4%, the largest 12-month increase since October 2022.
Unprocessed goods prices rose even faster, climbing 4.1% in April. The biggest driver was unprocessed energy materials, up 9.2%. Crude petroleum rose 11.3%, accounting for nearly three-quarters of the advance in unprocessed goods.
The 12-month increase for unprocessed goods reached 20.9%, the largest since September 2022.
These intermediate demand numbers suggest that cost pressures are building not only at the final stage but also deeper in the supply chain.
Freight and Transportation Costs Stand Out
Transportation was one of the clearest pressure points in the report.
Final demand transportation and warehousing services rose 5.0%, while transportation and warehousing services for intermediate demand jumped 3.7%.
Truck transportation of freight was especially important. It contributed to increases in both final demand services and intermediate demand services, with truck freight prices rising 8.1% in the intermediate demand category.
Higher freight costs can ripple through the economy because they affect the cost of moving raw materials, intermediate goods, and finished products. When transportation costs rise quickly, businesses may face pressure to raise prices or absorb lower margins.
Production Flow Data Point to Broad-Based Increases
The production flow measures also showed broad price gains across stages of production.
Stage 4 intermediate demand rose 0.9%, the largest increase since January 2023. Stage 3 rose 2.3%, stage 2 increased 2.8%, and stage 1 advanced 2.1%.
The strongest monthly increase came from stage 2 intermediate demand, where goods inputs climbed 5.1%.
Year-over-year increases were also notable:
Stage 4 intermediate demand: 5.4%
Stage 3 intermediate demand: 5.9%
Stage 2 intermediate demand: 11.1%
Stage 1 intermediate demand: 8.9%
The especially large increases in earlier stages suggest cost pressures could continue feeding into later stages if they persist.
What This Means
April’s PPI report was hot across several dimensions.
Energy was a major contributor, especially gasoline, diesel, jet fuel, and crude petroleum. But the report was not limited to energy. Services prices, trade margins, freight costs, chemicals, and several wholesale categories also rose.
The rise in the core final demand measure adds to the significance of the report. When prices excluding food, energy, and trade services are rising at the fastest year-over-year pace in more than three years, it points to broader inflation pressure beneath the headline number.
For businesses, the report suggests higher input costs may be returning across transportation, energy, materials, and distribution channels. For consumers, the PPI does not directly measure retail prices, but producer cost increases can eventually flow through to consumer prices.
For policymakers, the April data complicates the inflation picture. A single month does not make a trend, but this report showed acceleration across headline PPI, core PPI, goods, services, and intermediate demand.
Bottom Line
The April 2026 Producer Price Index report showed a sharp acceleration in wholesale inflation. Final demand prices rose 1.4% for the month and 6.0% from a year earlier, both marking the strongest readings in years.
Energy was the biggest driver, but services, freight, trade margins, and intermediate goods also showed meaningful price pressure.
The next PPI report, covering May 2026, is scheduled for release on Thursday, June 11, 2026, at 8:30 a.m. ET.
Disclaimer: This blog post is for informational purposes only and should not be construed as financial advice. Always conduct thorough research and consider seeking advice from a financial professional before making any investment decisions.
Start futures forex fx news trading with Haawks G4A low latency machine-readable data, one of the fastest machine-readable news trading feed for US economic and commodity data.
Please let us know your feedback. If you are interested in timestamps, please send us an email to sales@haawks.com.