Viewing entries tagged
USDA

USDA Crop Progress: Market Impact on Futures, Ethanol, ETFs, and Ag Stocks

Comment

USDA Crop Progress: Market Impact on Futures, Ethanol, ETFs, and Ag Stocks

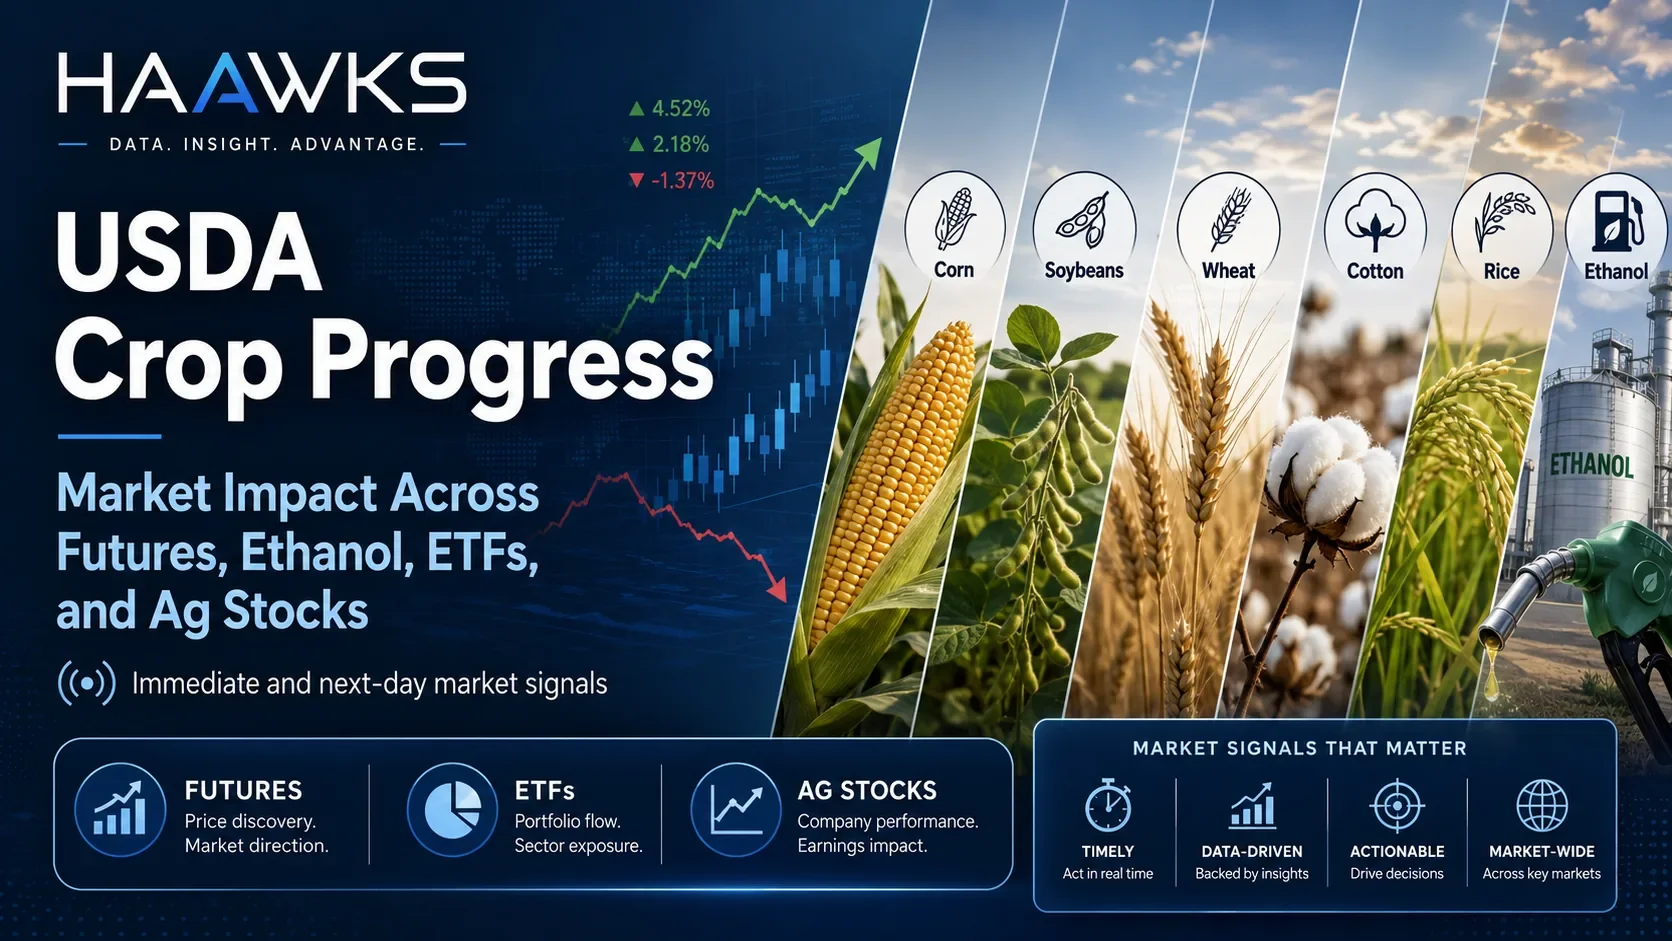
USDA Crop Progress: Immediate and Next-Day Market Impact Across Futures, Ethanol, ETFs, and Ag Stocks

HAAWKS graphic showing USDA Crop Progress market impact across futures, ethanol, ETFs, and agricultural stocks.

Every Monday during the U.S. growing season, the USDA Crop Progress Report gives agricultural markets a fresh read on planting, emergence, crop conditions, and harvest progress.

For traders and analysts, the report is more than an update on field activity. It is a weekly supply-side signal that can influence expectations for yield, production, input costs, and short-term price discovery across directly linked agricultural markets.

At HAAWKS, we are introducing structured weekly Crop Progress data points across major U.S. crops to help market participants analyze those signals faster and more consistently.

What HAAWKS will track

HAAWKS will disseminate 30 weekly data points from the USDA Crop Progress Report, covering six major U.S. crops:

Table 1: HAAWKS Crop Progress Data Coverage

Crop Data Points
Corn Planted, emerged, good/excellent condition, harvested
Soybeans Planted, emerged, good/excellent condition, harvested
Cotton Planted, squaring, good/excellent condition, harvested
Rice Planted, emerged, good/excellent condition, harvested
Winter wheat Planted, emerged, good/excellent condition, harvested
Spring wheat Planted, emerged, good/excellent condition, harvested

These indicators provide a high-frequency view of crop development and crop health before final yield and production estimates are known.

Why Crop Progress can move markets

The market does not react simply because a Crop Progress number is high or low.

It reacts when the number is different from what traders expected.

A corn crop rated 67% good/excellent may be bullish if the market expected 70%. The same 67% rating may be bearish if the market expected 64%. The important variable is the surprise.

In practice, the reaction framework is straightforward:

Table 2: Crop Progress Surprise and Typical Market Interpretation

Crop Progress Surprise Typical Market Interpretation
Better-than-expected good/excellent ratings Higher yield potential, usually bearish for futures
Worse-than-expected good/excellent ratings Greater production risk, usually bullish for futures
Faster-than-expected planting Lower acreage or timing risk, often bearish
Slower-than-expected planting Higher acreage or yield risk, often bullish
Faster-than-expected harvest More near-term supply availability, often bearish nearby futures
Slower-than-expected harvest Delayed supply movement, often supportive nearby futures

The strongest research evidence is in corn and soybeans, where academic work has found that USDA Crop Progress and condition information can affect futures price discovery around the report window. The effect is especially important during the most weather-sensitive periods of the growing season.

Immediate impact: the first tradable window

The USDA Crop Progress Report is released at 4:00 PM ET. That timing matters.

Most directly linked U.S. agricultural futures markets are already closed when the report is published. As a result, the first clean futures reaction usually happens when markets reopen in the evening session.

Table 3: First Direct Reaction Window by Market

Market First Direct Reaction Window
Corn futures Monday evening reopen, around 8:00 PM ET
Soybean futures Monday evening reopen, around 8:00 PM ET
Wheat futures Monday evening reopen, around 8:00 PM ET
Rough rice futures Monday evening reopen, around 8:00 PM ET
Cotton No. 2 futures Monday evening reopen, around 9:00 PM ET
Ethanol futures Potentially same day, because ethanol futures are generally still open at the 4:00 PM ET release time

This means Crop Progress data is often digested before the evening futures reopen. Traders have time to compare the USDA figures against estimates, prior-week levels, five-year averages, weather forecasts, and crop-stage sensitivity.

Next-day impact

For many users, the most practical impact window is the next trading day.

Tuesday’s session reflects a more complete market response, including overnight futures trading, new analyst commentary, updated weather models, and broader liquidity from U.S. equity and ETF markets.

Useful next-day measures include:

Table 4: Next-Day Market Impact Measures

Metric What It Captures
Monday settlement to evening reopen First futures repricing opportunity
First 30–60 minutes after reopen Immediate futures price discovery
Monday settlement to Tuesday settlement Full next-day futures impact
Tuesday ETF open vs. prior close Equity-market translation of the futures move
Tuesday stock open vs. prior close Operational exposure repricing

This distinction is important for ETFs and stocks. U.S. equities close at 4:00 PM ET, the same time the USDA report is released. While after-hours trading may exist, the cleaner and more liquid equity-market reaction usually occurs the next regular trading day.

Directly linked futures markets

Crop Progress data is most directly relevant for futures tied to the underlying crops.

Table 5: Directly Linked Futures Markets

Crop Progress Data Direct Futures Market
Corn CBOT corn futures and options
Soybeans CBOT soybean futures and options
Winter wheat CBOT wheat and KC hard red winter wheat futures and options
Spring wheat Minneapolis hard red spring wheat futures and options
Cotton ICE Cotton No. 2 futures and options
Rice CBOT rough rice futures and options
Corn supply outlook CME denatured fuel ethanol futures

The futures impact is usually clearest in corn and soybeans because these markets are highly liquid and because Crop Progress data directly informs expectations around planting success, crop health, yield potential, and harvest timing.

The corn–ethanol connection

Ethanol belongs in the Crop Progress discussion because corn is the primary feedstock for U.S. ethanol production.

A stronger-than-expected corn crop can reduce concern about corn availability and input costs for ethanol producers. A weaker-than-expected corn crop can raise concern about feedstock costs and pressure ethanol margins.

The connection is not always one-directional. Ethanol prices also depend on gasoline blending economics, energy prices, Renewable Identification Numbers, export demand, operating rates, inventories, and policy. Still, Crop Progress data can directly affect the corn-cost side of the ethanol margin equation.

A simplified framework:

Table 6: Corn Crop Progress and Ethanol Market Relevance

Crop Progress Signal Corn Market Effect Possible Ethanol-Market Relevance
Better corn condition than expected Bearish corn input-cost signal May support ethanol margins if ethanol prices hold
Worse corn condition than expected Bullish corn input-cost signal May pressure ethanol margins
Faster harvest than expected More near-term corn availability Can ease feedstock availability concerns
Slower harvest than expected Delayed corn movement Can tighten local supply and basis conditions

For this reason, ethanol futures and ethanol-exposed companies are directly linked to corn Crop Progress data, even if the reaction is filtered through margins rather than through crop price alone.

Directly linked ETFs

For equity-market participants, the cleanest ETF links are futures-based agriculture funds.

Table 7: Directly Linked ETFs

ETF Direct Link
CORN Corn futures exposure
SOYB Soybean futures exposure
WEAT Wheat futures exposure
DBA Broad agriculture futures basket
TILL Futures exposure to corn, wheat, soybeans, and sugar

These ETFs are not Crop Progress instruments themselves. Their link comes from the futures they hold or reference. If Crop Progress creates a meaningful move in corn, soybean, or wheat futures, the effect may be reflected in the relevant futures-based ETF during the next ETF trading session.

Directly linked stocks

Stocks are less pure than futures or futures-based ETFs, but several companies have direct operational exposure to corn, ethanol, grain merchandising, or oilseed processing.

Table 8: Directly Linked Stocks

Stock Crop Progress Link
Green Plains Corn feedstock costs and ethanol crush margins
Alto Ingredients Renewable fuels, specialty alcohols, and ethanol-market exposure
The Andersons Grain merchandising and ethanol/renewables exposure
Archer-Daniels-Midland Corn processing, ethanol, oilseeds, and grain merchandising
Bunge Global Oilseed processing, grain origination, and merchandising
Valero Energy Ethanol segment exposure, though diluted by larger refining operations

For stocks, the Crop Progress signal is usually indirect at the share-price level. A corn condition surprise may affect ethanol margins or merchandising opportunities, but company-specific news, energy prices, crush margins, balance-sheet factors, and broader equity-market conditions can dominate.

The cleanest stock impact is usually in companies with meaningful ethanol or grain-processing exposure, particularly when the Crop Progress surprise is large enough to change expectations for corn costs, soybean supply, or harvest timing.

Public sources for pre-release estimates

Because markets react to surprises, estimates matter.

The most useful comparison is:

Actual USDA value minus pre-release consensus estimate.

Publicly available estimate sources may include:

Table 9: Public Sources for Pre-Release Estimates

Source Type Use
Reuters analyst polls, often republished by agricultural media Consensus expectations for planting, harvest, or condition ratings
Pro Farmer Pre-report estimate summaries and market commentary
Agriculture.com / Successful Farming Reuters-based Crop Progress estimates and report coverage
Farm Progress / Farm Futures Analyst expectations and post-report comparisons
Barchart / Brugler commentary Estimate references, crop-rating commentary, and condition-index interpretation
DTN / Progressive Farmer USDA Crop Progress summaries and analyst context
USDA NASS prior week and five-year average Historical baseline, not a consensus estimate

Prior-week values and five-year averages are important context, but they are not the same as market expectations. A number can be above the five-year average and still disappoint traders if expectations were even higher.

How HAAWKS helps

The value of Crop Progress data is highest when it can be used immediately.

HAAWKS structures the weekly USDA Crop Progress release into clean, real-time data points so users can compare the latest report against the previous week, historical benchmarks, and market estimates.

This helps traders, analysts, and agricultural market participants answer the key questions quickly:

Did the USDA number beat or miss expectations?

Was the surprise large enough to matter?

Which futures markets are directly linked?

Could the reaction carry into ethanol, ETFs, or directly exposed ag stocks the next day?

Conclusion

USDA Crop Progress data is one of the most important weekly inputs for U.S. agricultural market analysis during the growing season.

The strongest immediate and next-day impact is typically seen in directly linked futures markets, especially corn and soybeans. The data can also influence ethanol through the corn feedstock channel and may carry into futures-based agriculture ETFs and directly exposed ag stocks during the next equity-market session.

For market participants, the key is not the absolute number. It is the surprise versus expectations, the seasonal timing of the report, and the market’s ability to translate crop progress into supply, yield, and margin expectations.

By delivering structured Crop Progress data, HAAWKS helps users move from raw USDA figures to market-relevant analysis faster.

Disclaimer: This blog post is for informational purposes only and should not be construed as financial advice. Always conduct thorough research and consider seeking advice from a financial professional before making any investment decisions.

Sources

  1. USDA National Agricultural Statistics Service — Crop Progress
    Source for the Crop Progress report description, coverage, and weekly release schedule.
    https://esmis.nal.usda.gov/publication/crop-progress

  2. CME Group — Corn Futures Contract Specifications
    Source for CME grain futures trading hours, including the evening reopen schedule relevant to corn, soybeans, wheat, and rough rice.
    https://www.cmegroup.com/markets/agriculture/grains/corn.html

  3. ICE — Cotton No. 2 Futures
    Source for ICE Cotton No. 2 trading hours.
    https://www.ice.com/products/254/Cotton-No-2-Futures

  4. CME Group — Denatured Fuel Ethanol Futures FAQ
    Source for ethanol futures trading hours and the daily maintenance window.
    https://www.cmegroup.com/articles/faqs/faq-denatured-fuel-ethanol.html

  5. CME Group — Are Corn and Ethanol Markets Correlated?
    Source for the corn–ethanol market connection, including corn as the primary U.S. ethanol input and ethanol’s share of domestic corn disappearance.
    https://www.cmegroup.com/openmarkets/energy/2024/Are-Corn-and-Ethanol-Markets-Correlated.html

  6. USDA Economic Research Service — Global Demand for Fuel Ethanol Through 2030
    Source for the statement that ethanol manufacturers use about 40% of the U.S. corn crop for ethanol and related co-products.
    https://www.ers.usda.gov/publications/pub-details?pubid=105761

  7. Lehecka, G. V. — The Value of USDA Crop Progress and Condition Information: Reactions of Corn and Soybean Futures Markets
    Academic source supporting the market impact of USDA Crop Progress and condition information on corn and soybean futures.
    https://ideas.repec.org/a/ags/jlaare/168261.html

  8. Bethlem et al. — The Impact of the USDA Soybean Crop Condition Reports on Soybean Futures Prices
    Academic source supporting next-day soybean futures price reaction to changes in good/excellent soybean crop ratings.
    https://www.scielo.br/j/resr/a/vcxYjcBRQYWDd6HL6Vq85WF/?lang=en

  9. Bain and Fortenbery — Impact of Crop Condition Reports on National and Local Wheat Markets
    Academic source showing weaker or mixed evidence for wheat crop condition reports compared with corn and soybeans.
    https://www.cambridge.org/core/journals/journal-of-agricultural-and-applied-economics/article/impact-of-crop-condition-reports-on-national-and-local-wheat-markets/F0BC21D69B41FEE1FF420ADD6FC65431

  10. Teucrium — CORN Fund
    Source for futures-based ETF exposure to corn.
    https://teucrium.com/corn

  11. Teucrium — SOYB Fund
    Source for futures-based ETF exposure to soybeans.
    https://teucrium.com/soybeans

  12. Teucrium — WEAT Fund
    Source for futures-based ETF exposure to wheat.
    https://teucrium.com/weat

  13. Teucrium — TILL Fund
    Source for broader futures-based agricultural exposure.
    https://teucrium.com/till

  14. Invesco — DB Agriculture Fund (DBA)
    Source for DBA’s exposure to a rules-based index of agricultural commodity futures.
    https://www.invesco.com/us/en/financial-products/etfs/invesco-db-agriculture-fund.html

  15. Green Plains Annual Report
    Source for Green Plains’ corn feedstock exposure in dry-mill ethanol production.
    https://gpreinc.com/wp-content/uploads/2024/03/Green-Plains-2023-Annual-Report_Web.pdf

  16. ADM — Industrial Ethanol Products
    Source for ADM ethanol production from corn feedstock.
    https://www.adm.com/en-us/products-services/industrial-biosolutions/products/ethanol/

Comment

116 ticks potential profit on 30 June 2026, analysis on trading corn, wheat and soybeans futures on USDA Grain Stocks and USDA Acreage data

Comment

116 ticks potential profit on 30 June 2026, analysis on trading corn, wheat and soybeans futures on USDA Grain Stocks and USDA Acreage data

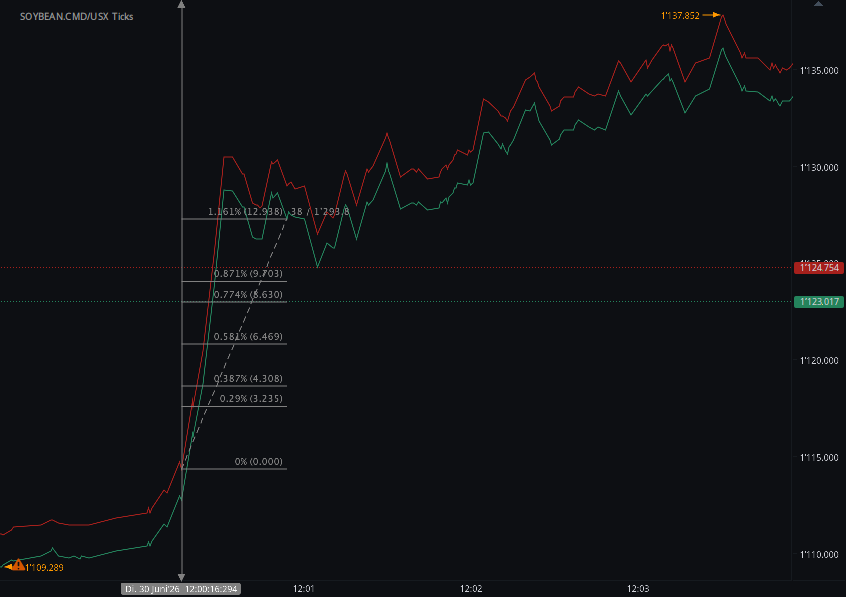
According to our analysis corn (ZC), wheat (ZW) and soybeans (ZS) futures prices moved around 28 / 40 / 48 ticks (total 116) on USDA Grain Stocks and USDA Acreage data on 30 June 2026.

Soybeans (48 ticks)

Charts are exported from JForex (Dukascopy).


USDA June Data: Bearish Old-Crop Stocks Meet a New-Crop Acreage Reset

Meta description: USDA’s June 2026 Acreage and Grain Stocks reports give grain traders a fresh setup: heavier old-crop corn, soybean, and wheat stocks, lower corn and wheat acreage, and a larger soybean footprint heading into summer weather risk.

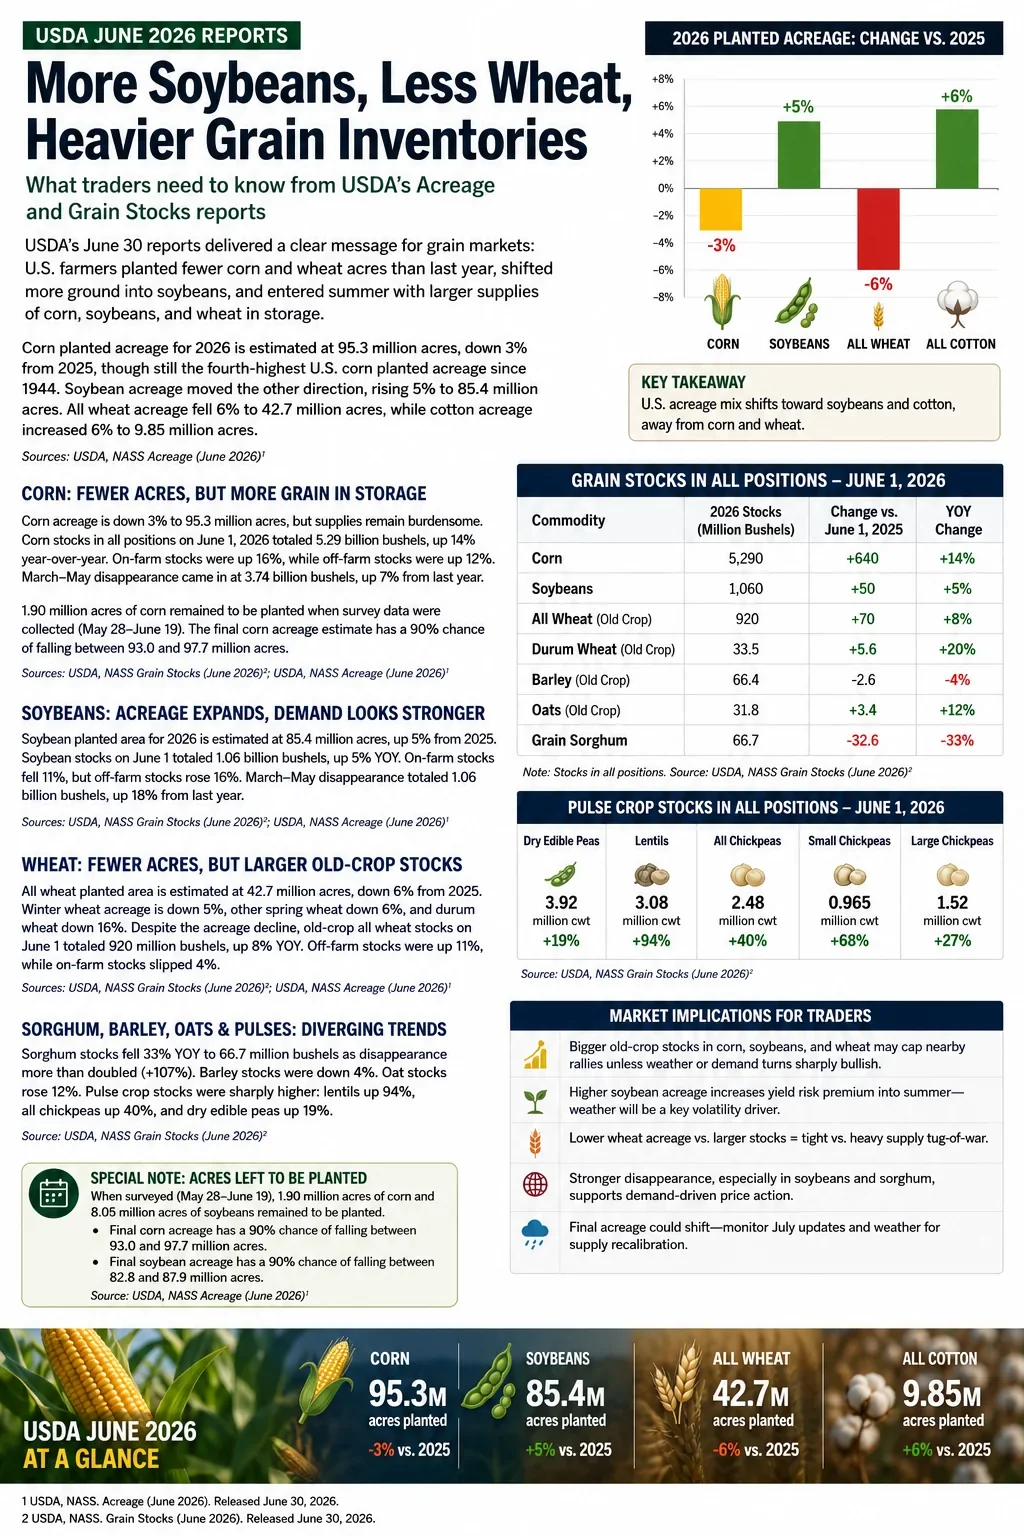
USDA June 2026 grain market infographic showing lower corn and wheat acreage, higher soybean acreage, and larger corn, soybean, and wheat stocks.

The Trade Setup

USDA’s June 30 Acreage and Grain Stocks reports gave traders a classic two-sided summer market: old-crop supplies look heavier, but new-crop acreage introduces fresh risk premium.

The headline acreage numbers were clear. Corn planted area is estimated at 95.3 million acres, down 3% from 2025. Soybean planted area rose 5% to 85.4 million acres. All wheat planted area dropped 6% to 42.7 million acres, while cotton acreage increased 6% to 9.85 million acres. USDA reported larger year-over-year inventories for the three major grain and oilseed contracts. June 1 corn stocks were 5.29 billion bushels, up 14% from last year. Soybean stocks were 1.06 billion bushels, up 5%. Old-crop all wheat stocks were 920 million bushels, up 8%.

For traders, the immediate read is not simply “bearish” or “bullish.” It is more nuanced: nearby supply is comfortable, but the acreage mix changes the sensitivity of new-crop balance sheets to July and August weather.

Corn: Stocks Lean Bearish, Acreage Keeps Weather Premium Alive

Corn gave the market a bearish old-crop signal. USDA’s 5.29 billion bushels of June 1 corn stocks were up 14% year over year. On-farm stocks rose 16%, while off-farm stocks rose 12%. March-May indicated disappearance was 3.74 billion bushels, compared with 3.50 billion during the same quarter last year.

That disappearance number shows demand wimply “bearish” or “bullish.” It is more nuanced: nearby supply is comfortable, but the acreage mix changes the sensitivity of new-crop balance sheets to July and August weather.

Corn: Stocks Lean Bearish, Acreage Keeps Weather Premium Alive

Corn gave the market a bearish old-crop signal. USDA’s 5.29 billion bushels of June 1 corn stocks were up 14% year over year. On-farm stocks rose 16%, while off-farm stocks rose 12%. March-May indicated disappearance was 3.74 billion bushels, compared with 3.50 billion during the same quarter last year.

That disappearance number shows demand was better than last year, but not enough to offset the larger supply cushion. The larger on-farm stock figure also matters for basis. If producers remain patient, cash markets may stay supported locally. If futures rally on weather and farmer selling accelerates, basis could soften quickly in surplus regions.

The acreage number complicates the bearish stocks story. Corn planted acreage at 95.3 million acres is down from last year, with harvested-for-grain acreage forecast at 87.4 million acres. USDA also noted that 1.90 million acres of corn were still left to be planted when survey data were collected, and that final planted acreage has a 90% historical range of 93.0 million to 97.7 million acres around the current estimate.

Trader read: Old-crop corn stocks cap nearby rallies, but lower acreage means December corn can still build weather premium quickly if forecasts turn hot and dry. The cleanest trade lens is old-crop pressure versus new-crop weather optionality.

Soybeans: Acreage Expands, But Demand Is the Bullish Detail

Soybeans delivered a larger acreage number, which is naturally bearish for new-crop supply assumptions. USDA estimated soybean planted acreage at 85.4 million acres, up 5% from 2025, with harvested acreage forecast at 84.4 million acres.

But the stocks report was not one-dimensional. June 1 soybean stocks were **1.06 bDecember corn can still build weather premium quickly if forecasts turn hot and dry. The cleanest trade lens is old-crop pressure versus new-crop weather optionality.

Soybeans: Acreage Expands, But Demand Is the Bullish Detail

Soybeans delivered a larger acreage number, which is naturally bearish for new-crop supply assumptions. USDA estimated soybean planted acreage at 85.4 million acres, up 5% from 2025, with harvested acreage forecast at 84.4 million acres.

But the stocks report was not one-dimensional. June 1 soybean stocks were 1.06 billion bushels, up 5% from last year. However, on-farm stocks were down 11%, while off-farm stocks rose 16%. March-May indicated disappearance was also 1.06 billion bushels, up 18% from the same period a year earlier.

That stronger disappearance figure is the key for traders. Expanded acres pressure the new-crop balances been active enough to keep the bull case alive, especially if crush margins, export demand, or weather risk tighten the forward outlook.

USDA also reported 8.05 million soybean acres left to be planted during the survey window, and the final soybean planted acreage estimate has a 90% historical range of 82.8 million to 87.9 million acres around the current estimate.

Trader read: November soybeans may struggle if weather is benign, but demand signals make the market vulnerable to sharp rallies if August weather turns threatening. Soybean spreads may remain especially sensitive to crush demand and export headlines.

Wheat: Lower Acres Versus Larger Stocks

Wheat has the clearest acreage contraction. USDA estimated all wheat planted area at 42.7 million acres, down 6% from 2025. Winter wheat area was 31.5 million acres, down 5%, while other spring wheat fell 6% and Durum acreage dropped 16%.

At the same time, old-crop wheat stocks were not tight. USDA reported 920 million bushels of old-crop all wheat in storage as of June 1, up *ather turns threatening. Soybean spreads may remain especially sensitive to crush demand and export headlines.

Wheat: Lower Acres Versus Larger Stocks

Wheat has the clearest acreage contraction. USDA estimated all wheat planted area at 42.7 million acres, down 6% from 2025. Winter wheat area was 31.5 million acres, down 5%, while other spring wheat fell 6% and Durum acreage dropped 16%.

At the same time, old-crop wheat stocks were not tight. USDA reported 920 million bushels of old-crop all wheat in storage as of June 1, up 8% from a year earlier. On-farm stocks were down 4%, but off-farm stocks were up 11%.

For futures, that mix argues for caution chasing rallies that are based only on acreage. Lower acres matter, but higher old-crop stocks reduce urgency unless yield, quality, export demand, or global wheat news adds fuel.

Trader read: Wheat needs a catalyst. Lower acreage supports the structure, but larger inventories make weather and export demand the deciding variables.

Sorghum and Pulses: Smaller Markets, Bigger Percentage Moves

Sorghum was one of the sharper stocks stories. June 1 grain sorghum stocks totaled 66.7 million bushels, down 33% from a year ago. March-May indicated disappearance was 105 million bushels, up 107% from the same period last year.

That is a meaningful tightening signal, even if sorghum does not drive the main board the way corn, soybeans, and wheat do. Regional feed demand, export interest, and relative value against corn could become more important.

Pulse crop stocks also moved sharply. Lentil stocks were up 94%, all chickpea stocks were up 40%, and dry edible pea stocks were up 19% from June 1, 2025.

Trader read: These markets matter most for regional cash trade and specialty-crop pricing, but the percentage changes are too large to ignore.

What Traders Should Watch Next

The June reports shift at, or global wheat news adds fuel.

Trader read: Wheat needs a catalyst. Lower acreage supports the structure, but larger inventories make weather and export demand the deciding variables.

Sorghum and Pulses: Smaller Markets, Bigger Percentage Moves

Sorghum was one of the sharper stocks stories. June 1 grain sorghum stocks totaled 66.7 million bushels, down 33% from a year ago. March-May indicated disappearance was 105 million bushels, up 107% from the same period last year.

That is a meaningful tightening signal, even if sorghum does not drive the main board the way corn, soybeans, and wheat do. Regional feed demand, export interest, and relative value against corn could become more important.

Pulse crop stocks also moved sharply. Lentil stocks were up 94%, all chickpea stocks were up 40%, and dry edible pea stocks were up 19% from June 1, 2025.

Trader read: These markets matter most for regional cash trade and specialty-crop pricing, but the percentage changes are too large to ignore.

What Traders Should Watch Next

The June reports shift attention to three market drivers.

First, weather now carries more weight for corn and soybeans. Corn acreage is lower, soybean acreage is higher, and both final acreage estimates still have uncertainty because survey data were collected before planting was fully complete.

Second, basis behavior will matter. Larger corn and wheat stocks can pressure cash markets, especially if futures rallies trigger farmer selling. Soybeans are more complicated because total stocks are higher, but on-farm stocks are lower and spring disappearance was strong.

Third, spreads may tell the story before flat price does. Heavy old-crop stocks argue against panic in nearby supply, while new-crop acreage and weather risk create room for volatility farther out the curve.

Bottom Line

USDA’s June numbers are not a directional signal. They are a volatility setup.

Corn carries bearish old-crop stocks but still has new-crop weather risk. Soybeans gained acres, but demand has been strong enough to keep traders alert. Wheat lost acreage, but larger old-crop stocks mean rallies need confirmation from weather, quality, or export demand.

The practical takeaway for traders: respect the supply cushion, but do not ignore the summer risk premium. The market now moves from acreage math to weather execution.

Disclaimer: This blog post is for informational purposes only and should not be construed as financial advice. Always conduct thorough research and consider seeking advice from a financial professional before making any investment decisions.

Sources: https://esmis.nal.usda.gov/sites/default/release-files/795959/grst0626.pdf, https://esmis.nal.usda.gov/sites/default/release-files/795961/acrg0626.pdf


Haawks G4A is one of the fastest machine-readable data feeds for USDA data. We are beating big names in the industry by seconds. Coverage includes monthly USDA WASDE (World Agricultural Supply and Demand Estimates), quarterly USDA Grain Stocks, yearly USDA Prospective Plantings and USDA Acreage and weekly USDA Crop Progress.

Please let us know your feedback. If you are interested in timestamps, please send us an email to sales@haawks.com.

Comment

HAAWKS Adds Weekly USDA Crop Progress Data for Major U.S. Crops

Comment

HAAWKS Adds Weekly USDA Crop Progress Data for Major U.S. Crops

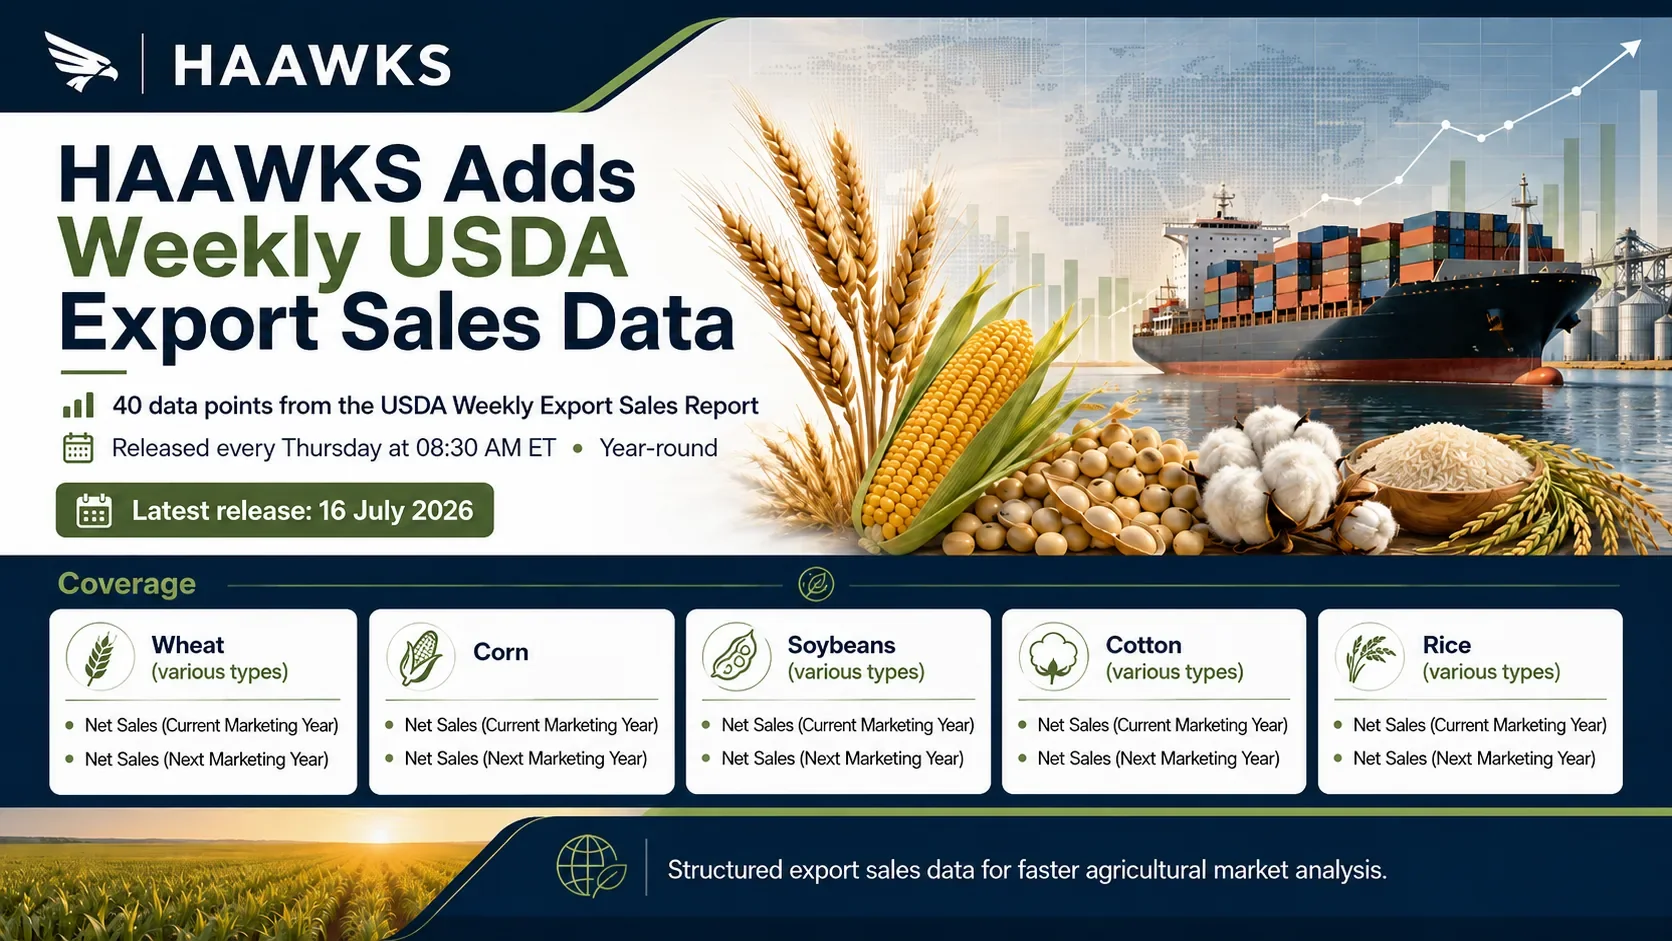
HAAWKS Expands Agricultural Coverage with Weekly USDA Crop Progress Data

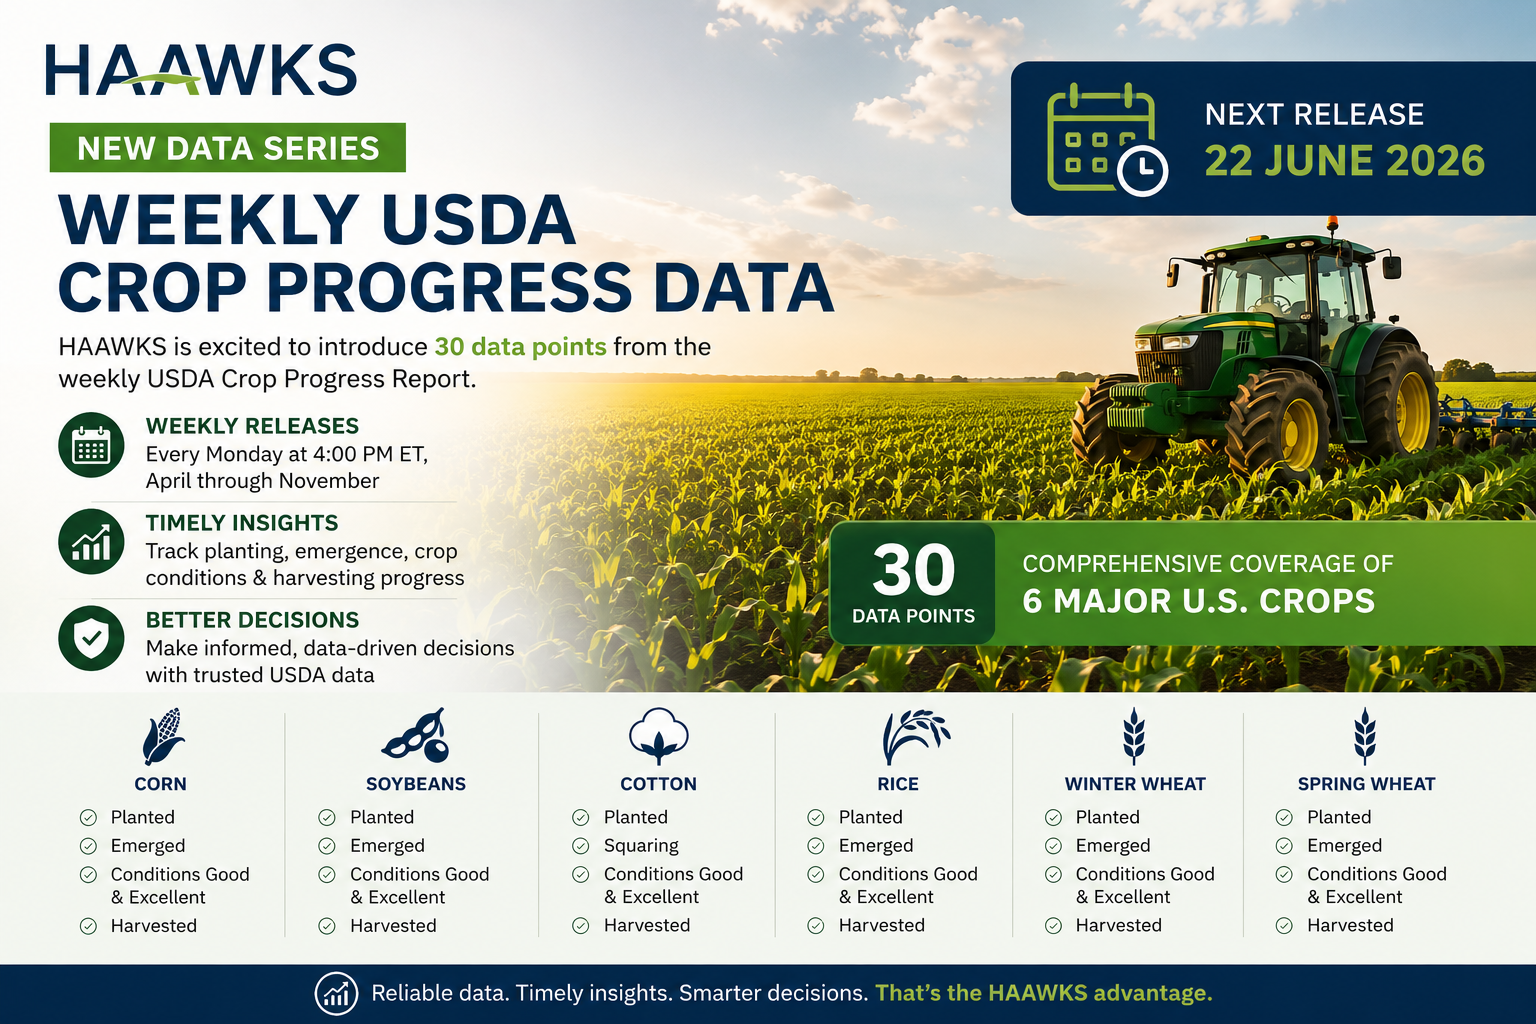
HAAWKS announcement graphic for weekly USDA Crop Progress Data covering 30 data points across six major U.S. crops.

HAAWKS is pleased to announce the upcoming introduction and dissemination of new data points from the weekly USDA Crop Progress Report, one of the key reference sources for monitoring the development and condition of major U.S. crops throughout the growing season.

Released every Monday at 4:00 PM ET from April through November, the USDA Crop Progress Report provides timely updates on planting, emergence, crop conditions, and harvesting progress across major agricultural commodities. The next release is scheduled for 22 June 2026.

To support faster analysis and better market visibility, HAAWKS will introduce 30 weekly crop progress data points, covering six major U.S. crops:

Corn
Planted, emerged, conditions good & excellent, harvested

Soybeans
Planted, emerged, conditions good & excellent, harvested

Cotton
Planted, squaring, conditions good & excellent, harvested

Rice
Planted, emerged, conditions good & excellent, harvested

Winter Wheat
Planted, emerged, conditions good & excellent, harvested

Spring Wheat
Planted, emerged, conditions good & excellent, harvested

By making these data points available in a structured and timely format, HAAWKS helps traders, analysts, and agricultural market participants track crop development more efficiently and respond more quickly to changing supply-side conditions.

The addition of USDA Crop Progress data further strengthens HAAWKS’ commitment to delivering high-quality, market-relevant agricultural data that supports informed decision-making across the commodity markets.

Disclaimer: This blog post is for informational purposes only and should not be construed as financial advice. Always conduct thorough research and consider seeking advice from a financial professional before making any investment decisions.

Source: https://esmis.nal.usda.gov/publication/crop-progress

Comment

40 ticks potential profit on 31 March 2026, analysis on trading soybeans futures on USDA Grain Stocks and USDA Prospective Plantings data

Comment

40 ticks potential profit on 31 March 2026, analysis on trading soybeans futures on USDA Grain Stocks and USDA Prospective Plantings data

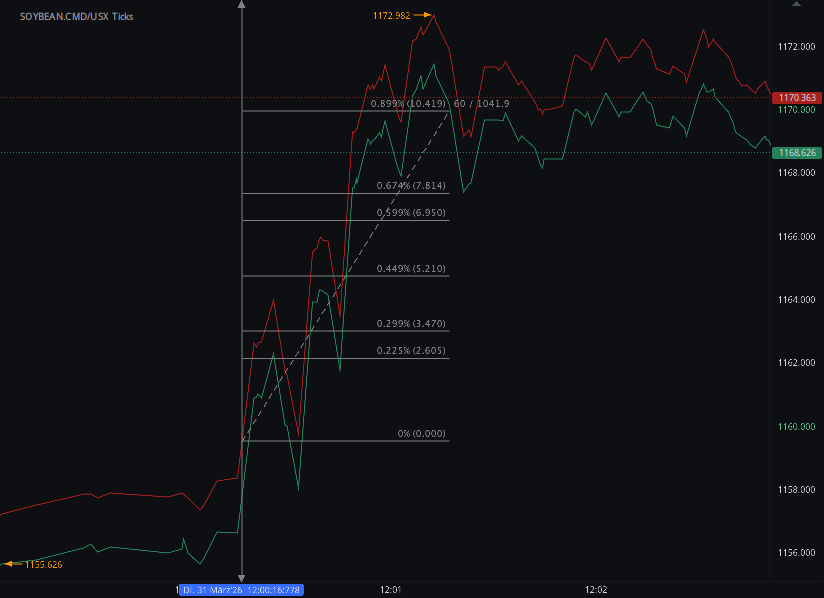
According to our analysis soybeans (ZS) futures prices moved around 40 ticks on USDA Grain Stocks and USDA Prospective Plantings data on 31 March 2026.

Soybeans (40 ticks)

Charts are exported from JForex (Dukascopy).


U.S. Grain Markets in 2026: Bigger Stocks, Shifting Acreage, and Weather Risks Ahead

The latest reports from the USDA National Agricultural Statistics Service paint a complex picture of the U.S. agricultural landscape in early 2026. Grain supplies are generally rising, planting intentions are shifting across key crops, and weather risks are quietly building in the background.

Here’s what it all means for markets, farmers, and global supply.

Grain Stocks: Broad Increase Led by Corn

As of March 1, 2026, U.S. grain inventories show a clear upward trend:

  • Corn: 9.02 billion bushels (+11% YoY)

  • Soybeans: 2.10 billion bushels (+10%)

  • All wheat: 1.30 billion bushels (+5%)

Key takeaway:

Supply is loosening, especially for corn and soybeans.

What’s driving this?

  • On-farm corn stocks surged 21%, suggesting farmers are holding more grain.

  • Off-farm corn stocks fell slightly (-2%), indicating slower commercial movement.

  • Soybeans saw a large increase in off-farm stocks (+16%), hinting at weaker demand or slower exports.

Meanwhile, wheat stocks rose modestly, but with an important twist:

  • On-farm wheat stocks declined (-3%)

  • Off-farm stocks increased (+8%)

This suggests wheat is moving into commercial channels more actively than corn.

Demand Signals: Mixed Across Crops

“Disappearance” (a proxy for demand) reveals diverging trends:

  • Corn demand increased (4.28 vs. 3.93 billion bushels)

  • Soybean demand slightly declined (-1%)

  • Wheat demand jumped (+12%)

Interpretation:

  • Corn demand remains strong (feed, ethanol, exports).

  • Soybeans may be facing export or crush headwinds.

  • Wheat demand is tightening supply despite higher stocks.

Smaller Crops Beyond the Big Three

Not all grains followed the same pattern:

  • Sorghum: +15% stocks (strong growth)

  • Barley: -10% (tightening supply)

  • Oats: -3% (slight decline)

  • Sunflower: +41% (major increase)

These smaller crops often reflect niche demand and regional shifts—but sunflower’s surge stands out as particularly significant.

2026 Planting Intentions: A Strategic Shift

Farmers are adjusting acreage in response to prices, costs, and risk.

Major crops:

  • Corn: 95.3 million acres (-3%)

  • Soybeans: 84.7 million acres (+4%)

  • Wheat: 43.8 million acres (-3%, lowest since 1919)

  • Cotton: 9.64 million acres (+4%)

What this suggests:

  • Farmers are rotating away from corn into soybeans

  • Wheat continues a long-term structural decline

  • Cotton is regaining attractiveness, likely due to pricing

Why This Matters for Markets

1. Corn: High Supply, Strong Demand

  • Rising stocks + strong usage = balanced but heavy market

  • Price pressure possible if demand weakens

2. Soybeans: More Acres, Softer Demand

  • Increased planting + weaker disappearance = potential oversupply risk

3. Wheat: Lower Acres, Strong Demand

  • Could tighten later in the year despite current stock increase

Weather: The Hidden Risk Factor

Despite solid supply numbers, weather conditions are raising concerns:

  • Drought expanded sharply (over 54% of U.S. affected)

  • Plains and Southern regions saw significant dryness

  • Low snowpack in the West threatens water availability

  • Winter wheat conditions deteriorated in key states like Nebraska

Implication:

Even with strong current stocks, 2026 production is far from guaranteed.

The Big Picture

The 2026 outlook can be summarized in three themes:

1. Supply is comfortable—for now

Grain stocks are up across most major crops.

2. Farmers are repositioning

Less corn, more soybeans, and historically low wheat acreage.

3. Weather could change everything

Drought and water risks introduce major uncertainty.

Final Thoughts

The U.S. grain market in 2026 is entering a transitional phase:

  • Short-term: ample supply and moderate demand

  • Medium-term: shifting acreage patterns

  • Wildcard: weather and climate pressures

For traders, policymakers, and farmers alike, the key question is no longer just how much grain we have—but how sustainable production will be going forward.

Disclaimer: This blog post is for informational purposes only and should not be construed as financial advice. Always conduct thorough research and consider seeking advice from a financial professional before making any investment decisions.

Source: https://esmis.nal.usda.gov/sites/default/release-files/795839/grst0326.pdf , https://esmis.nal.usda.gov/sites/default/release-files/795840/pspl0326.pdf


Haawks G4A is one of the fastest machine-readable data feeds for USDA data. We are beating big names in the industry by seconds. Coverage includes monthly USDA WASDE (World Agricultural Supply and Demand Estimates), quarterly USDA Grain Stocks and yearly USDA Prospective Plantings and USDA Acreage.

Please let us know your feedback. If you are interested in timestamps, please send us an email to sales@haawks.com.

Comment

200 ticks potential profit on 12 January 2026, analysis on trading soybeans, corn and wheat futures on USDA WASDE and USDA Grain Stocks data

Comment

200 ticks potential profit on 12 January 2026, analysis on trading soybeans, corn and wheat futures on USDA WASDE and USDA Grain Stocks data

According to our analysis soybeans (ZS), corn (ZC) and wheat (WC) futures prices moved around 200 ticks (80 ticks, 60 ticks and 60 ticks) on USDA WASDE (World Agricultural Supply and Demand Estimates) and USDA Grain Stocks data on 12 January 2026.


WASDE January 2026: Big Crops, Rising Stocks, and Mixed Price Signals

The January 2026 World Agricultural Supply and Demand Estimates (WASDE 667), approved by the World Agricultural Outlook Board and released by the United States Department of Agriculture, paints a clear picture of abundance across much of U.S. and global agriculture. Strong production gains—especially in corn, wheat, soybeans, and select global exporters—are building stocks and keeping a lid on prices, even as demand remains solid in several categories.

Below is a plain-language breakdown of the key takeaways that matter most for producers, merchandisers, and market watchers.

Wheat: Larger Stocks, Softer Prices

U.S. wheat supplies for 2025/26 are modestly higher due to increased beginning stocks reported by National Agricultural Statistics Service. Feed and residual use was cut sharply after weaker-than-expected disappearance in the first quarter, while exports remain unchanged at 900 million bushels.

  • Ending stocks: 926 million bushels (+25 million)

  • Season-average farm price: $4.90/bu (down $0.10)

Globally, wheat supplies are expanding as well. Argentina is harvesting a record crop, Russia’s production outlook improved, and world ending stocks climbed to 278.3 million tons. This reinforces a well-supplied global wheat market heading into 2026.

Corn & Coarse Grains: A Record Crop Changes the Tone

Corn is the headline story this month.

U.S. corn production is now estimated at 17.0 billion bushels, the largest on record—surpassing the previous high by a staggering 1.7 billion bushels. Higher yields and a sharp rise in harvested acres drove the increase.

  • Yield: 186.5 bu/acre

  • Ending stocks: 2.2 billion bushels

  • Season-average price: $4.10/bu (up $0.10)

Despite higher stocks, prices nudged higher thanks to strong feed demand. Globally, coarse grain production is also rising, led by China’s record corn crop of 301.2 million tons. World corn stocks now approach 291 million tons, underscoring the scale of supply.

Rice: Tighter U.S. Balance Sheet

Rice stands out as one of the tighter markets in this report.

U.S. rice supplies declined due to lower imports and slightly reduced production, while domestic use surged to a record level—driven entirely by long-grain consumption.

  • Ending stocks: 49.3 million cwt (down 9%)

  • All-rice season-average price: $11.80/cwt (up $0.20)

Globally, however, rice remains well supplied. Higher production and stocks in China and Japan pushed world ending stocks up to 190.3 million tons.

Oilseeds: Soybeans Face Global Competition

U.S. oilseed production rose modestly, with soybeans up to 4.3 billion bushels. Crushing demand remains strong, particularly for soybean meal, but exports were reduced as Brazil continues to dominate global trade.

  • U.S. soybean ending stocks: 350 million bushels

  • Season-average soybean price: $10.20/bu (down $0.30)

Brazil’s crop outlook improved again, with production raised to 178 million tons on favorable weather. Combined U.S. and Brazilian gains pushed global soybean ending stocks higher, keeping pressure on prices.

Sugar: Slightly Higher U.S. Supplies

U.S. sugar production increased marginally, more than offsetting reduced imports. Ending stocks ticked higher, pushing the stocks-to-use ratio near 16%.

In Mexico, sugar production is up from last year thanks to improved rainfall, but flooding and harvest delays forced a downward revision from last month. Exports to the U.S. remain capped by high U.S. inventories under the Suspension Agreements.

Livestock & Dairy: Production Up, Prices Mixed

Red meat and poultry production for 2025 was revised higher, with gains in pork and beef offsetting lower poultry output. Looking ahead to 2026:

  • Beef: Higher weights support production despite fewer cattle

  • Pork: Expansion continues on larger pig crops

  • Eggs: Lower production weighs on prices

  • Milk: 2026 output rises on higher production per cow

The all-milk price is now forecast at $18.25/cwt for 2026, reflecting weaker butter and cheese prices despite strong protein demand.

Cotton: Smaller Crop, Firmer Price

U.S. cotton production fell more than 2% due to lower yields in the Delta. Ending stocks declined to 4.2 million bales, tightening the balance sheet.

  • Season-average farm price: 61 cents/lb (up)

Globally, cotton stocks also fell as production slipped and consumption improved, pushing the world stocks-to-use ratio below 63%.

Grain Stocks: Abundance Confirmed

December 1 grain stocks reinforced the WASDE message:

  • Corn stocks: +10% year over year

  • Soybean stocks: +6%

  • All wheat stocks: +7%

Notably, grain sorghum stocks surged 26%, and most small grains showed higher inventories despite slower disappearance.

Final Thoughts

The January 2026 WASDE confirms a theme of ample supplies and heavy stocks across most major commodities. Corn and soybeans face the strongest headwinds from record production and global competition, while rice and cotton offer relative brightness due to tighter balances. Livestock markets remain demand-supported, but rising production will cap upside potential.

As we move deeper into 2026, weather, export competitiveness, and macroeconomic demand will determine whether these large supplies translate into sustained price pressure—or unexpected volatility.

Disclaimer: This blog post is for informational purposes only and should not be construed as financial advice. Always conduct thorough research and consider seeking advice from a financial professional before making any investment decisions.

Source: https://www.usda.gov/oce/commodity/wasde/wasde0126.pdf, https://esmis.nal.usda.gov/sites/default/release-files/795726/grst0126.pdf


Haawks G4A is one of the fastest machine-readable data feeds for USDA data. We are beating big names in the industry by seconds. Coverage includes monthly USDA WASDE (World Agricultural Supply and Demand Estimates), quarterly USDA Grain Stocks and yearly USDA Prospective Plantings and USDA Acreage.

Please let us know your feedback. If you are interested in timestamps, please send us an email to sales@haawks.com.

Comment

96 ticks potential profit on 12 August 2025, analysis on trading corn, wheat and soybeans futures on USDA WASDE data

Comment

96 ticks potential profit on 12 August 2025, analysis on trading corn, wheat and soybeans futures on USDA WASDE data

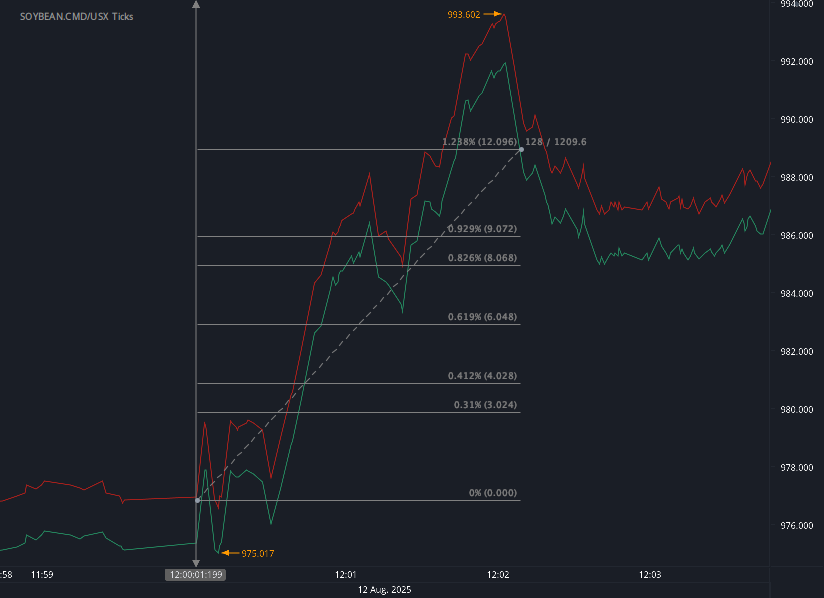
According to our analysis corn (ZC), wheat (WC) and soybeans (ZS) futures prices moved around 96 ticks (28 ticks, 20 ticks, 48 ticks) on USDA WASDE (World Agricultural Supply and Demand Estimates) data on 12 August 2025.

Soybeans (48 ticks)

Charts are exported from JForex (Dukascopy).


August 2025 WASDE Report: Record Crops, Price Shifts, and Global Supply Changes

The USDA’s latest World Agricultural Supply and Demand Estimates (WASDE), released August 12, 2025, paints a complex picture for the coming marketing year. While some U.S. crops are setting production records, others are tightening in supply, with global market ripples reaching nearly every major commodity. Here’s a breakdown of the key takeaways.

Wheat: Slightly Tighter in the U.S., Lower Stocks Worldwide

  • U.S. Outlook:

    • Supplies: Down slightly to 1.927 billion bushels due to reduced harvested area, even as yields tick up to 52.7 bu/acre.

    • Use: Domestic use trimmed by 5 million bushels (mainly food), but exports up 25 million thanks to strong sales of Hard Red Winter wheat.

    • Ending Stocks: Cut to 869 million bushels.

    • Price: Lowered 10 cents to $5.30/bu.

  • Global Outlook:

    • Supplies: Down 2.5 million tons due to lower production in China, Brazil, and Argentina.

    • Consumption: Down 1.1 million tons, with feed use weaker in several Asian countries.

    • Trade: Slightly higher, led by U.S. exports.

    • Ending Stocks: Dropped to 260.1 million tons, the lowest since 2015/16.

Corn & Coarse Grains: Record U.S. Crop, Prices Under Pressure

  • U.S. Corn:

    • Production: A record 16.7 billion bushels, up 1 billion from last month on bigger acreage and a yield forecast of 188.8 bu/acre.

    • Use: Domestic use up 545 million bushels, with feed demand surging.

    • Exports: Projected record 2.9 billion bushels.

    • Ending Stocks: Up to 2.1 billion bushels, highest since 2018/19.

    • Price: Lowered 30 cents to $3.90/bu.

  • Global Coarse Grains:

    • Production: Higher overall, but foreign output down in the EU and Serbia from heat/dryness.

    • Stocks: Global corn ending stocks up to 282.6 million tons.

Rice: Bigger U.S. Harvest, Global Stocks Ease

  • U.S. Outlook:

    • Production: 208.5 million cwt, higher on acreage despite a yield drop.

    • Exports: Up to 97 million cwt, with strong medium/short-grain sales to Japan.

    • Ending Stocks: 44.6 million cwt, down 12% year-over-year.

    • Price: Higher for California medium/short-grain, overall $14.20/cwt.

  • Global Outlook:

    • Supplies: Slight dip to 728.7 million tons.

    • Consumption: Record 542 million tons.

    • Ending Stocks: Down to 186.7 million tons.

Oilseeds: U.S. Soybeans Tighter on Lower Area

  • U.S. Soybeans:

    • Production: 4.3 billion bushels, down 43 million on smaller acreage despite higher yields (53.6 bu/acre).

    • Exports: Cut 40 million bushels on slow early sales.

    • Ending Stocks: Down to 290 million bushels.

    • Price: Unchanged at $10.10/bu.

  • Global Soybeans:

    • Production: Lower in the U.S. and Serbia.

    • Stocks: Down 1.2 million tons to 124.9 million.

Sugar: More U.S. Supply, Higher Stocks

  • 2025/26 U.S. Sugar:

    • Production: Higher for both beet and cane sugar, especially in Louisiana.

    • Ending Stocks: Up to 2.16 million STRV, boosting the stocks-to-use ratio to 17.75%.

Livestock, Poultry & Dairy: Shifts in Meat Mix, Firm Milk Output

  • Meat Production:

    • Beef & Pork: Lower on reduced slaughter and lighter weights.

    • Poultry: Broilers up; turkey down. Eggs slightly lower.

  • Prices:

    • Cattle & Hogs: Higher into 2026.

    • Broilers: Lower in the second half of 2025.

    • Turkey: Higher on tight red meat supplies.

    • Milk: Output forecasts raised; 2025 all-milk price steady at $22.00/cwt.

Cotton: Smaller U.S. Crop Tightens Supplies

  • Production: Cut to 13.2 million bales, down 1.4 million from July on higher abandonment in the Southwest.

  • Exports: Down 500,000 bales.

  • Ending Stocks: Down to 3.6 million bales.

  • Price: Up to 64¢/lb.

  • Global: Production, consumption, and trade all down; ending stocks reduced over 3.4 million bales.

The Big Picture

August’s WASDE tells two main stories: record corn production pushing prices down and tightness in wheat, soybeans, cotton, and some livestock products supporting prices. Global weather, shifting trade patterns, and domestic supply surges are setting up a marketing year of both opportunity and volatility.

Disclaimer: This blog post is for informational purposes only and should not be construed as financial advice. Always conduct thorough research and consider seeking advice from a financial professional before making any investment decisions.

Source: https://www.usda.gov/oce/commodity/wasde/wasde0825.pdf


Haawks G4A is one of the fastest machine-readable data feeds for USDA data. We are beating big names in the industry by seconds. Coverage includes monthly USDA WASDE (World Agricultural Supply and Demand Estimates), quarterly USDA Grain Stocks and yearly USDA Prospective Plantings and USDA Acreage.

Please let us know your feedback. If you are interested in timestamps, please send us an email to sales@haawks.com.

Comment

76 ticks potential profit on 11 July 2025, analysis on trading corn, wheat and soybeans futures on USDA WASDE data

Comment

76 ticks potential profit on 11 July 2025, analysis on trading corn, wheat and soybeans futures on USDA WASDE data

According to our analysis corn (ZC), wheat (WC) and soybeans (ZS) futures prices moved around 76 ticks (16 ticks, 32 ticks, 28 ticks) on USDA WASDE (World Agricultural Supply and Demand Estimates) data on 11 July 2025.

Soybeans (28 ticks)

Charts are exported from JForex (Dukascopy).


WASDE July 2025: Key Takeaways for U.S. and Global Agricultural Markets

The USDA’s World Agricultural Supply and Demand Estimates (WASDE) report for July 2025 presents a nuanced picture across key agricultural markets. From changing weather patterns and shifting trade dynamics to biofuel policy and disease-related disruptions, this month’s data reflect a global sector in flux. Here's what producers, analysts, and stakeholders need to know.

Wheat: U.S. Stocks Dip Despite Higher Output

The U.S. wheat outlook shows increased production (1.929 billion bushels) but lower ending stocks (890 million bushels) due to higher exports. Winter wheat production fell, but higher yields helped offset lower harvested area. Despite the drop, ending stocks are still 5% above last year. Prices remain at $5.40/bu, slightly below last year.

Globally, wheat supplies were trimmed due to reductions in Canada, Ukraine, and Iran, with trade falling by 1.3 million tons. Ending stocks are down 1.2 million tons to 261.5 million.

Corn & Coarse Grains: Supply Shrinks, Prices Hold

U.S. corn production is forecast 115 million bushels lower following reduced acreage. Ending stocks fell 90 million bushels, though prices are steady at $4.20/bu. Exports surged to a projected record of 2.8 billion bushels.

Oats and barley see modest increases, while sorghum production is down 25 million bushels.

Globally, coarse grain production dipped by 3.6 million tons. Notable developments include improved Brazil corn yields and reduced barley outlooks for several key producers. Global corn stocks fell 3.2 million tons to 272.1 million.

Rice: U.S. Impacted by Flooding, Prices Rise

Flooding in the Delta—especially Arkansas—cut U.S. rice production to 205 million cwt. With reduced area and lower use, ending stocks dropped 5% to 44.7 million cwt. Season-average prices rose across all types:

  • All rice: $14.00/cwt

  • Long grain: $13.00

  • Medium/short grain: $13.50

Globally, rice supplies were stable, but ending stocks were reduced for China and Burma. World consumption hit a new record at 541.6 million tons, driven by China's increased feed usage.

Oilseeds: Biofuel Demand Boosts U.S. Crush

U.S. soybean production edged lower, but domestic crush was raised by 50 million bushels to 2.54 billion. This is driven by booming biofuel demand, bolstered by new EPA mandates and the 45Z Clean Fuel Tax Credit. Soybean oil use for biofuel is now projected at 15.5 billion pounds, up 23% from the previous 3-year average.

Soybean exports were cut by 70 million bushels, with ending stocks rising to 310 million. Prices reflect these shifts:

  • Soybeans: $10.10/bu (↓$0.15)

  • Soybean oil: $0.53/lb (↑$0.07)

  • Soybean meal: $290/short ton (↓$20)

Globally, soybean production and stocks rose, while exports declined slightly. Brazil remains a dominant supplier.

Livestock, Poultry & Dairy: Mixed Shifts Across Proteins

2025 Highlights

  • Beef: Production lowered on slower slaughter; imports and exports raised.

  • Pork: Production and exports both increased.

  • Broilers: Higher production on increased weights; exports lowered due to competition.

  • Turkey & Eggs: Lower production and higher prices expected.

  • Milk: Output raised on cow numbers and productivity.

    • All milk price: $22.00/cwt

2026 Outlook

  • Beef: Production rebound expected (feedlot placements up).

  • Hogs: Higher slaughter from late-2025 pig crops; prices remain strong.

  • Eggs & Poultry: Stable production forecasts; egg prices unchanged.

  • Milk: Continues growth.

    • All milk price: $21.65/cwt

Mexico Sugar Trade: Shift in Export Patterns

Mexico’s 2025/26 beginning stocks rose by 27,342 metric tons, driven by lower 2024/25 use and slightly lower production. That same amount is added to 2025/26 exports, but shipments to the U.S. are down by 196,542 MT due to trade constraints. Exports to non-U.S. destinations rose 223,884 MT, indicating a pivot in trade strategy.

Cotton: More Harvested Acres, Bigger U.S. Crop

U.S. cotton production is up 600,000 bales to 14.60 million, with planted and harvested area both increased. However, yield per acre declined slightly. Ending stocks rose to 4.6 million bales, while the upland season-average price holds at 62 cents/lb.

Globally, higher production in China, the U.S., and Mexico drove up ending stocks by 520,000 bales, despite reduced beginning stocks. Consumption is up modestly, while trade expectations declined slightly.

Final Thoughts

The July 2025 WASDE report reveals a global ag sector navigating challenges and opportunities, from climate and disease to energy policy and evolving global trade. For producers and policymakers alike, the shifts in demand for biofuels, protein sources, and staple grains highlight the need for adaptability in a highly dynamic environment.

Stay tuned for future updates as the harvest season unfolds and global markets respond.

Disclaimer: This blog post is for informational purposes only and should not be construed as financial advice. Always conduct thorough research and consider seeking advice from a financial professional before making any investment decisions.

Source: https://www.usda.gov/oce/commodity/wasde/wasde0725.pdf


Haawks G4A is one of the fastest machine-readable data feeds for USDA data. We are beating big names in the industry by seconds. Coverage includes monthly USDA WASDE (World Agricultural Supply and Demand Estimates), quarterly USDA Grain Stocks and yearly USDA Prospective Plantings and USDA Acreage.

Please let us know your feedback. If you are interested in timestamps, please send us an email to sales@haawks.com.

Comment

64 ticks potential profit on 30 June 2025, analysis on trading soybeans futures on USDA Acreage and USDA Grain Stocks data

Comment

64 ticks potential profit on 30 June 2025, analysis on trading soybeans futures on USDA Acreage and USDA Grain Stocks data

According to our analysis soybeans (ZS) futures prices moved around 64 ticks on USDA Acreage and USDA Grain Stocks data on 30 June 2025.

Soybeans (64 ticks)

Charts are exported from JForex (Dukascopy).


USDA Grain & Crop Report: June 2025 Shows Mixed Signals for U.S. Agriculture

Released on June 30, 2025, by the USDA’s National Agricultural Statistics Service (NASS), the latest report offers a comprehensive look at U.S. grain stocks and planted acreage as of June 1, 2025. The data presents a mixed bag of trends for farmers, traders, and ag stakeholders, reflecting shifts in both supply and demand across key commodities.

Corn Stocks Drop, But Plantings Surge

Corn stocks totaled 4.64 billion bushels, down 7% from a year ago. Notably, on-farm stocks fell 16%, while off-farm stocks actually rose by 6%. Despite lower current supplies, the March–May disappearance (a proxy for usage) increased to 3.50 billion bushels, up from 3.36 billion a year earlier.

But in a significant development, corn planted acreage for 2025 surged to 95.2 million acres—up 5% from last year—making it the third highest corn acreage since 1944. The increase is widespread, with 41 out of 48 reporting states showing higher or unchanged plantings.

Soybeans: Higher Stocks, Lower Acreage

Total soybean stocks are up 4%, reaching 1.01 billion bushels, even as on-farm stocks declined 12%. The off-farm surge of 18% helped lift overall supply. Disappearance during March–May stood at 903 million bushels, a 3% increase from the same time last year.

However, soybean acreage is moving in the opposite direction. Estimated at 83.4 million acres, 2025 plantings are down 4%, with reductions noted in the majority of reporting states.

Wheat Stocks Up Across the Board, But Acreage Slides

Wheat stocks have rebounded, with total stocks at 851 million bushels, up a notable 22% year-over-year. On-farm wheat storage saw a strong 32% increase, while off-farm stocks rose 20%. Yet, the disappearance (or usage) of 386 million bushels is down 2% compared to the previous year.

Despite the rebound in stock levels, total wheat acreage dipped by 1%, estimated at 45.5 million acres. Spring wheat took the biggest hit—down 5%, while Durum wheat saw a 2% increase in plantings.

Other Small Grains & Sorghum

  • Barley stocks dropped 11% to 69.5 million bushels, largely due to a 28% fall in on-farm holdings.

  • Oats stocks are down 17%, reflecting both lower on-farm and off-farm storage.

  • Grain sorghum is the standout: stocks more than doubled to 99.5 million bushels, driven by a 110% increase in off-farm stocks. However, usage is down 10%.

Pulse Crops See Strong Increases

Pulse crop inventories also surged:

  • Dry edible peas: up 28%

  • Lentils: up 90%

  • All chickpeas: up 36%

    • Large chickpeas: up 47%

    • Small chickpeas: up 16%

This points to continued momentum in pulse production and storage, possibly tied to growing interest in plant-based foods and export markets.

Cotton Takes a Hit

Cotton is the outlier in terms of planting trends. All cotton acreage for 2025 fell by 10%, estimated at just 10.1 million acres. Both Upland and American Pima varieties saw declines, reflecting market pressures and possibly unfavorable weather or economics.

Key Takeaways

  • Corn and sorghum show strong planting numbers and/or stock growth, signaling confidence and demand.

  • Soybeans and cotton may face tighter futures with acreage cuts despite decent stocks.

  • Wheat’s rebound in stocks is promising, but lower spring wheat acreage may impact future supply.

  • Pulse crops continue to gain ground, perhaps reflecting broader dietary shifts.

As harvest season approaches, market watchers will keep a close eye on weather conditions, global demand, and policy changes that could further sway the outlook for U.S. agriculture in 2025 and beyond.

Disclaimer: This blog post is for informational purposes only and should not be construed as financial advice. Always conduct thorough research and consider seeking advice from a financial professional before making any investment decisions.

Source: https://downloads.usda.library.cornell.edu/usda-esmis/files/j098zb09z/4455bc157/6q184j42c/acrg0625.pdf, https://downloads.usda.library.cornell.edu/usda-esmis/files/j098zb09z/4455bc157/6q184j42c/acrg0625.pdf


Haawks G4A is one of the fastest machine-readable data feeds for USDA data. We are beating big names in the industry by seconds. Coverage includes monthly USDA WASDE (World Agricultural Supply and Demand Estimates), quarterly USDA Grain Stocks and yearly USDA Prospective Plantings and USDA Acreage.

Please let us know your feedback. If you are interested in timestamps, please send us an email to sales@haawks.com.

Comment

56 ticks potential profit on 12 May 2025, analysis on trading corn, wheat and soybeans futures on USDA WASDE data

Comment

56 ticks potential profit on 12 May 2025, analysis on trading corn, wheat and soybeans futures on USDA WASDE data

According to our analysis corn (ZC), wheat (WC) and soybeans (ZS) futures prices moved around 40 ticks (16 ticks, 20 ticks, 20 ticks) on USDA WASDE (World Agricultural Supply and Demand Estimates) data on 12 May 2025.

Soybeans (20 ticks)

Charts are exported from JForex (Dukascopy).


May 2025 WASDE Report: A Closer Look at Global Agricultural Trends

The May 2025 World Agricultural Supply and Demand Estimates (WASDE) report delivers a comprehensive outlook on global agricultural markets, highlighting key trends in wheat, corn, rice, and oilseeds. Here’s a breakdown of what to expect in the 2025/26 marketing year:

Wheat: U.S. Stocks Rise Amid Global Expansion

The U.S. wheat market is poised for increased supply, higher stocks, and competitive export pressure:

  • U.S. wheat production is projected at 1.921 billion bushels, down 3% from last year due to reduced acreage.

  • Ending stocks rise 10% to 923 million bushels—the highest in six years.

  • Exports drop to 800 million bushels as the U.S. faces tough competition from Russia, the EU, and Argentina.

  • Global wheat production hits a record 808.5 million metric tons with notable gains from India, China, and the EU.

  • Russia remains the top exporter at 45 million tons.

  • The global wheat market is increasingly robust, with consumption and trade both growing.

Corn: Record U.S. Production but Lower Prices

Corn is the standout crop this year, with production and usage reaching all-time highs:

  • U.S. corn production is forecast at a record 15.8 billion bushels.

  • Higher yields (181.0 bu/acre) and expanded acreage push total supplies to 17.3 billion bushels.

  • Exports grow to 2.7 billion bushels as lower prices fuel global demand.

  • Ending stocks jump by 385 million bushels, softening the average farm price to $4.20/bushel.

  • Globally, corn production is set to rise to 1.265 billion tons, but ending stocks decline due to strong consumption, especially in China and Vietnam.

Soybeans & Oilseeds: South America Surges, U.S. Share Shrinks

The soybean sector tells a story of rising global demand and shifting trade balances:

  • U.S. soybean production falls slightly to 4.34 billion bushels, but strong crush demand boosts domestic use.

  • Soybean meal exports gain momentum, while soybean oil exports decline amid global competition.

  • U.S. exports shrink to 1.815 billion bushels, reducing the U.S. share of global exports from 28% to 26%.

  • South America dominates, with Brazil forecast to produce a record 175 million tons.

  • Global soybean production and trade continue to grow, supported by strong demand from China and emerging markets.

Key Takeaways:

  • The U.S. is facing increased competition globally across all major crops.

  • Record supplies are the theme for wheat, corn, rice, and oilseeds.

  • Farm prices are trending lower, especially for corn and rice, due to higher stock levels.

  • China continues to be a major demand driver, particularly in corn and soybeans.

  • South America is strengthening its role as the world’s agricultural powerhouse.

As weather, trade policies, and geopolitical factors continue to evolve, these projections will remain dynamic. But as of now, the 2025/26 marketing year looks to be one of record output, intensifying global competition, and shifting market shares.

Disclaimer: This blog post is for informational purposes only and should not be construed as financial advice. Always conduct thorough research and consider seeking advice from a financial professional before making any investment decisions.

Source: https://www.usda.gov/oce/commodity/wasde/wasde0525.pdf


Haawks G4A is one of the fastest machine-readable data feeds for USDA data. We are beating big names in the industry by seconds. Coverage includes monthly USDA WASDE (World Agricultural Supply and Demand Estimates), quarterly USDA Grain Stocks and yearly USDA Prospective Plantings and USDA Acreage.

Please let us know your feedback. If you are interested in timestamps, please send us an email to sales@haawks.com.

Comment

40 ticks potential profit on 11 February 2025, analysis on trading corn and wheat futures on USDA WASDE data

Comment

40 ticks potential profit on 11 February 2025, analysis on trading corn and wheat futures on USDA WASDE data

According to our analysis corn (ZC) and wheat (WC) futures prices moved around 40 ticks (24 ticks and 16 ticks) on USDA WASDE (World Agricultural Supply and Demand Estimates) data on 11 February 2025.


WASDE February 2025: Market Insights for Agricultural Traders

The latest World Agricultural Supply and Demand Estimates (WASDE) report, released on February 11, 2025, provides key insights into global agricultural markets. With adjustments in supply, demand, and pricing across major commodities, traders should pay close attention to shifting trends in wheat, corn, rice, soybeans, and livestock.

Wheat Market: Lower Ending Stocks, Price Holds

The U.S. wheat outlook for 2024/25 reflects higher domestic use and lower ending stocks, which fell by 4 million bushels to 794 million. Despite this decline, stocks remain 14% above last year’s levels. The season-average farm price remains unchanged at $5.55 per bushel. Globally, wheat supplies increased slightly due to higher production in Kazakhstan and Argentina. However, world trade declined by 3.0 million tons due to reduced exports from the EU, Mexico, Russia, Turkey, and Ukraine. China’s wheat imports were significantly cut to 8.0 million tons—the lowest in five years.

Traders saw wheat futures decline by 16 ticks following the report, likely reflecting expectations of robust U.S. stocks and weaker global trade.

Corn Market: No Change in U.S. Outlook, Lower Global Production

The U.S. corn supply and use outlook remained unchanged this month, but the projected season-average farm price was raised by 10 cents to $4.35 per bushel. Globally, coarse grain production was forecasted 1.8 million tons lower, mainly due to yield losses in Argentina and Brazil caused by heat and dryness. With reduced production and smaller exports from Brazil, Ukraine, and South Africa, corn imports for China were also cut. Global ending stocks dropped to 290.3 million tons, a decrease of 3.0 million.

Corn futures fell by 24 ticks, as traders responded to the lowered global production outlook, offset by the lack of significant changes in U.S. supply and demand.

Rice: Rising Imports and Stocks, Price Drops

The U.S. rice market saw increased supplies due to higher imports, with long-grain imports rising while medium- and short-grain imports declined. Domestic use hit a record 166.0 million cwt, while exports fell by 4.0 million cwt. Ending stocks climbed 18% year-over-year to 47.0 million cwt—the highest in a decade. The season-average farm price dropped by $0.20 per cwt to $15.40.

Globally, rice supplies dipped slightly due to a production decline in Sri Lanka, while consumption and trade increased. India’s exports were raised to a near-record 22.0 million tons. Ending stocks fell by 0.5 million tons, mainly due to reductions in India and Sri Lanka.

Soybeans: Lower Global Stocks, U.S. Price Down

While the U.S. soybean balance sheet remained unchanged, the season-average price dropped by 10 cents to $10.10 per bushel. Global soybean production fell, particularly in Argentina and Paraguay, due to persistent heat and dryness. Brazilian production remained at 169.0 million tons, with strong performance in the Center-West offsetting losses in the south. Global soybean ending stocks declined by 4.0 million tons, primarily due to reductions in Argentina and Brazil.

Livestock and Dairy: Production Adjustments and Price Revisions

  • Beef: Increased U.S. production expectations led to higher export forecasts, supported by strong global demand. Cattle prices rose across all quarters.

  • Pork: Production was raised, but exports were lowered due to slower demand in key markets.

  • Poultry: Broiler and turkey production faced downward revisions due to Highly Pathogenic Avian Influenza (HPAI)-related culling.

  • Eggs: Lower production forecasts due to HPAI-related flock reductions pushed prices higher.

  • Dairy: Lower milk production forecasts resulted in tighter domestic supplies, while the all-milk price forecast was revised slightly down to $22.60 per cwt.

Cotton: Minimal Adjustments, Lower Farm Price

The U.S. cotton balance sheet saw minor changes, with domestic mill use lowered and ending stocks increased. The season-average upland farm price was reduced to 63.5 cents per pound. Global cotton production rose, largely due to a 1-million-bale increase in China’s crop, while consumption and trade saw nominal changes.

Key Takeaways for Traders:

  • Bearish Corn & Wheat Futures: Declines of 24 and 16 ticks, respectively, indicate market responses to global production trends and stock adjustments.

  • Soybean Prices Under Pressure: Lower global stocks suggest tight supplies, but weaker price action indicates concerns over demand.

  • Rice & Sugar Trends: Higher rice stocks could keep prices under pressure, while sugar market adjustments reflect shifting trade flows.

  • Livestock & Dairy: Price movements across cattle, hogs, and dairy suggest volatility tied to supply constraints and trade dynamics.

Final Thoughts

This WASDE report highlights the importance of monitoring weather-driven production risks, shifting trade flows, and evolving demand trends. With notable changes in global stocks and trade, traders should stay alert to potential market shifts in the coming months.

For those in the agricultural markets, the February 2025 WASDE offers both opportunities and risks. Stay informed, manage your positions wisely, and watch for further developments in weather, policy changes, and global demand trends.

Disclaimer: This blog post is for informational purposes only and should not be construed as financial advice. Always conduct thorough research and consider seeking advice from a financial professional before making any investment decisions.

Source: https://www.usda.gov/oce/commodity/wasde/wasde0225.pdf


Haawks G4A is one of the fastest machine-readable data feeds for USDA data. We are beating big names in the industry by seconds. Coverage includes monthly USDA WASDE (World Agricultural Supply and Demand Estimates), quarterly USDA Grain Stocks and yearly USDA Prospective Plantings and USDA Acreage.

Please let us know your feedback. If you are interested in timestamps, please send us an email to sales@haawks.com.

Comment