
According to our analysis soybeans (ZS) futures prices moved around 40 ticks on USDA Grain Stocks and USDA Prospective Plantings data on 31 March 2026.
Soybeans (40 ticks)
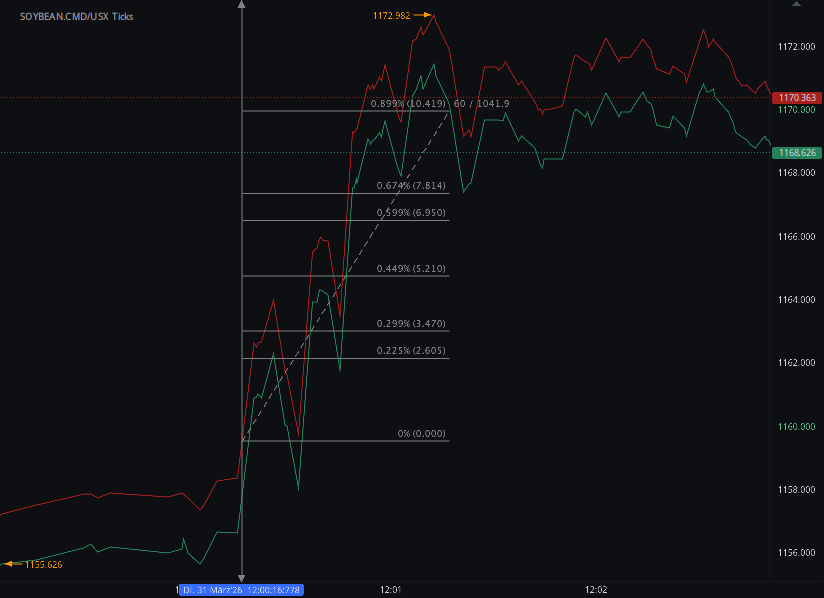
Charts are exported from JForex (Dukascopy).
U.S. Grain Markets in 2026: Bigger Stocks, Shifting Acreage, and Weather Risks Ahead
The latest reports from the USDA National Agricultural Statistics Service paint a complex picture of the U.S. agricultural landscape in early 2026. Grain supplies are generally rising, planting intentions are shifting across key crops, and weather risks are quietly building in the background.
Here’s what it all means for markets, farmers, and global supply.
Grain Stocks: Broad Increase Led by Corn
As of March 1, 2026, U.S. grain inventories show a clear upward trend:
Corn: 9.02 billion bushels (+11% YoY)
Soybeans: 2.10 billion bushels (+10%)
All wheat: 1.30 billion bushels (+5%)
Key takeaway:
Supply is loosening, especially for corn and soybeans.
What’s driving this?
On-farm corn stocks surged 21%, suggesting farmers are holding more grain.
Off-farm corn stocks fell slightly (-2%), indicating slower commercial movement.
Soybeans saw a large increase in off-farm stocks (+16%), hinting at weaker demand or slower exports.
Meanwhile, wheat stocks rose modestly, but with an important twist:
On-farm wheat stocks declined (-3%)
Off-farm stocks increased (+8%)
This suggests wheat is moving into commercial channels more actively than corn.
Demand Signals: Mixed Across Crops
“Disappearance” (a proxy for demand) reveals diverging trends:
Corn demand increased (4.28 vs. 3.93 billion bushels)
Soybean demand slightly declined (-1%)
Wheat demand jumped (+12%)
Interpretation:
Corn demand remains strong (feed, ethanol, exports).
Soybeans may be facing export or crush headwinds.
Wheat demand is tightening supply despite higher stocks.
Smaller Crops Beyond the Big Three
Not all grains followed the same pattern:
Sorghum: +15% stocks (strong growth)
Barley: -10% (tightening supply)
Oats: -3% (slight decline)
Sunflower: +41% (major increase)
These smaller crops often reflect niche demand and regional shifts—but sunflower’s surge stands out as particularly significant.
2026 Planting Intentions: A Strategic Shift
Farmers are adjusting acreage in response to prices, costs, and risk.
Major crops:
Corn: 95.3 million acres (-3%)
Soybeans: 84.7 million acres (+4%)
Wheat: 43.8 million acres (-3%, lowest since 1919)
Cotton: 9.64 million acres (+4%)
What this suggests:
Farmers are rotating away from corn into soybeans
Wheat continues a long-term structural decline
Cotton is regaining attractiveness, likely due to pricing
Why This Matters for Markets
1. Corn: High Supply, Strong Demand
Rising stocks + strong usage = balanced but heavy market
Price pressure possible if demand weakens
2. Soybeans: More Acres, Softer Demand
Increased planting + weaker disappearance = potential oversupply risk
3. Wheat: Lower Acres, Strong Demand
Could tighten later in the year despite current stock increase
Weather: The Hidden Risk Factor
Despite solid supply numbers, weather conditions are raising concerns:
Drought expanded sharply (over 54% of U.S. affected)
Plains and Southern regions saw significant dryness
Low snowpack in the West threatens water availability
Winter wheat conditions deteriorated in key states like Nebraska
Implication:
Even with strong current stocks, 2026 production is far from guaranteed.
The Big Picture
The 2026 outlook can be summarized in three themes:
1. Supply is comfortable—for now
Grain stocks are up across most major crops.
2. Farmers are repositioning
Less corn, more soybeans, and historically low wheat acreage.
3. Weather could change everything
Drought and water risks introduce major uncertainty.
Final Thoughts
The U.S. grain market in 2026 is entering a transitional phase:
Short-term: ample supply and moderate demand
Medium-term: shifting acreage patterns
Wildcard: weather and climate pressures
For traders, policymakers, and farmers alike, the key question is no longer just how much grain we have—but how sustainable production will be going forward.
Disclaimer: This blog post is for informational purposes only and should not be construed as financial advice. Always conduct thorough research and consider seeking advice from a financial professional before making any investment decisions.
Source: https://esmis.nal.usda.gov/sites/default/release-files/795839/grst0326.pdf , https://esmis.nal.usda.gov/sites/default/release-files/795840/pspl0326.pdf
Haawks G4A is one of the fastest machine-readable data feeds for USDA data. We are beating big names in the industry by seconds. Coverage includes monthly USDA WASDE (World Agricultural Supply and Demand Estimates), quarterly USDA Grain Stocks and yearly USDA Prospective Plantings and USDA Acreage.
Please let us know your feedback. If you are interested in timestamps, please send us an email to sales@haawks.com.