Viewing entries in
Forex News Trading

Comment

29 ticks potential profit in 14 seconds on 13 March 2024, analysis on futures forex fx low latency news trading crude oil on DOE Petroleum Status Report data

According to our analysis crude oil moved 29 ticks on DOE Petroleum Status Report data on 13 March 2024.

Light sweet crude oil (14 ticks)

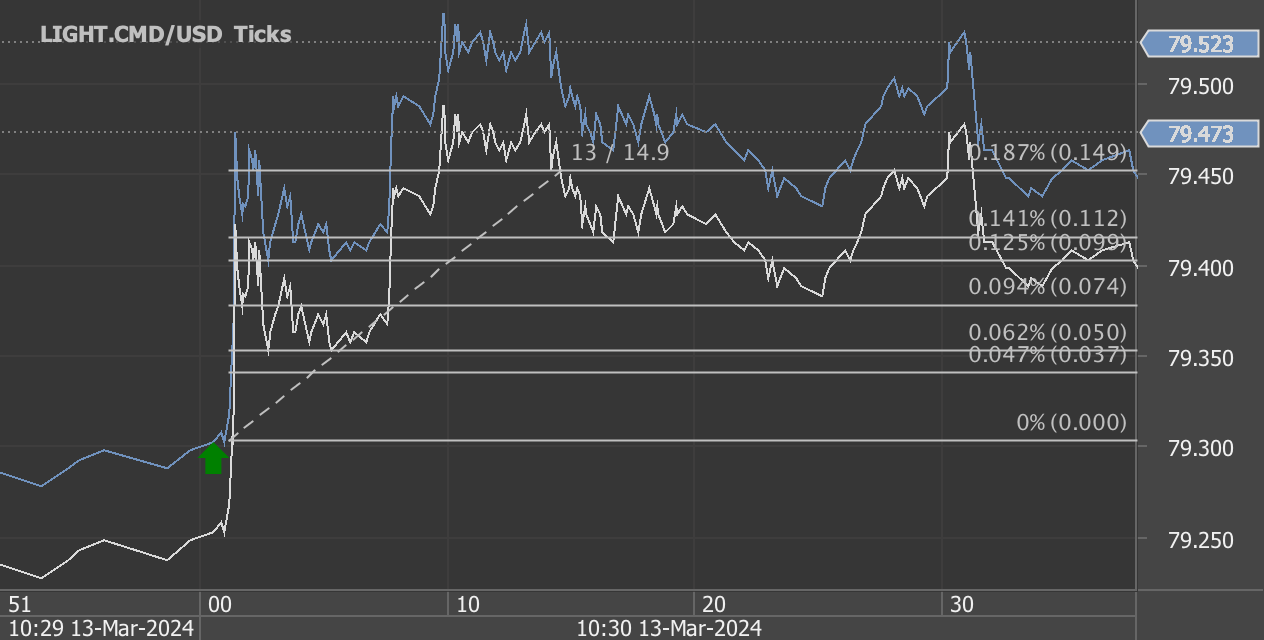
Brent crude oil (15 ticks)

Charts are exported from JForex (Dukascopy).


Analyzing the Latest Weekly Petroleum Status Report: Trends and Impacts

The Energy Information Administration (EIA) has released its Weekly Petroleum Status Report for the week ending March 8, 2024, providing key insights into the U.S. petroleum market's dynamics. This analysis aims to decode the numbers, examining refinery operations, inventory levels, imports, prices, and what these trends indicate for consumers and the broader energy sector.

U.S. Refinery Inputs and Production Levels

Refinery operations have seen an uptick, with crude oil inputs averaging 15.7 million barrels per day, marking a 390,000 barrels per day increase from the prior week. This surge pushes refinery utilization to 86.8% of their capacity, signaling a robust demand for petroleum products. Gasoline and distillate fuel production also rose, averaging 9.9 million and 4.6 million barrels per day, respectively, pointing towards a strengthening supply side in the market.

Imports and Inventory Levels

A notable shift occurred in crude oil imports, which averaged 5.5 million barrels per day last week, a significant decrease from the previous week. This change suggests a tightening in the global crude supply or shifts in U.S. import strategies. Conversely, the overall inventory levels depict a complex scenario: while crude oil inventories dropped by 1.5 million barrels, signaling a decrease in supply, propane/propylene inventories rose, indicating varied demand across different petroleum products.

Prices: A Mixed Bag for Consumers and Businesses

The price dynamics reveal a mixed impact for consumers and businesses. West Texas Intermediate (WTI) crude oil experienced a slight decrease, standing at $78.96 per barrel. Meanwhile, gasoline and heating oil spot prices saw a decline, potentially translating to modest relief for consumers at the pump. However, the national average retail prices for gasoline and diesel moved in opposite directions, highlighting the intricate balance between supply, demand, and geopolitical factors influencing the energy markets.

What This Means Moving Forward

The latest data from the EIA suggests a few key trends and their potential impacts:

  • Refinery Activity Increase: The rise in refinery inputs and capacity utilization points to an optimistic outlook for fuel supply in the domestic market. However, this increase must be sustained to meet growing demand as the economy continues to recover.

  • Inventory and Import Fluctuations: The drop in crude oil imports and certain inventory levels may raise concerns about supply tightness. Stakeholders should monitor these trends closely, as prolonged decreases could pressure prices upward.

  • Price Variability: The mixed signals in price movements underscore the volatile nature of the petroleum market. Consumers and businesses alike should remain prepared for fluctuations in fuel costs, which could impact spending and operational decisions.

Conclusion

The Weekly Petroleum Status Report paints a picture of a recovering but still volatile petroleum market. As the U.S. and global economies navigate post-pandemic landscapes, energy markets will continue to be at the mercy of supply and demand shifts, geopolitical tensions, and policy changes. Stakeholders, from consumers to industry leaders, must stay informed and agile, ready to adapt to the ever-changing energy landscape.

Source: https://www.eia.gov/petroleum/supply/weekly/pdf/highlights.pdf


Start futures forex fx crude oil news trading with Haawks G4A low latency machine-readable data, one of the fastest data feeds for DOE Petroleum Status Report data.

Please let us know your feedback. If you are interested in timestamps, please send us an email to sales@haawks.com.

Comment

Comment

20 pips potential profit in 19 seconds on 12 March 2024, analysis on futures forex fx low latency news trading USDJPY and EURUSD on US BLS CPI (Consumer Price Index) data

According to our analysis USDJPY and EURUSD moved 20 pips on US BLS CPI (Consumer Price Index) data on 12 March 2024.

USDJPY (12 pips)

EURUSD (8 pips)

Charts are exported from JForex (Dukascopy).


Understanding the February 2024 Consumer Price Index Report: A Deep Dive

The Consumer Price Index (CPI) for February 2024 was released by the U.S. Bureau of Labor Statistics (BLS), marking an essential gauge for economists, policymakers, and consumers to understand the current economic climate and inflation trends. The CPI measures the average change over time in the prices paid by urban consumers for a market basket of consumer goods and services. Let's dive into the details of the February 2024 report to unpack what it means for the economy and individuals.

February 2024 CPI Highlights

In February 2024, the Consumer Price Index for All Urban Consumers (CPI-U) saw a seasonally adjusted increase of 0.4 percent, following a 0.3 percent rise in January. This incremental change points to a persistent upward pressure on prices across a broad array of goods and services. Over the past 12 months, the all items index has risen by 3.2 percent before seasonal adjustment, indicating a slight acceleration in inflationary pressures.

Key Contributors to the February Increase

Several key components contributed to the February rise in the CPI-U:

  • Shelter and Gasoline: The indexes for shelter and gasoline saw significant increases in February, together accounting for over sixty percent of the monthly rise in the all items index. This combination of higher housing and fuel costs can strain household budgets.

  • Energy: The energy index increased by 2.3 percent, with all its component indexes also on the rise, adding to the overall inflationary pressure.

  • Food: Interestingly, the food index remained unchanged in February, with both the food at home and food away from home indexes showing little to no growth. This stability in food prices offers a slight reprieve amidst the broader inflationary trends.

Annual Perspective

Looking at the annual figures, the all items index increased by 3.2 percent over the 12 months ending February 2024, a notch above the 3.1 percent increase for the year ending in January. Notably, the energy index decreased by 1.9 percent over this period, providing a mixed picture of the inflationary landscape.

Analyzing the Numbers: What This Means for You

The February 2024 CPI report underscores ongoing inflationary pressures within the U.S. economy. For consumers, the rise in shelter and gasoline prices could lead to higher living expenses, affecting budgets and spending habits. On the flip side, the stabilization in food prices, albeit temporary, offers some relief.

For policymakers, the report's insights into inflationary trends are crucial for shaping monetary policy and interest rate decisions. The data presents a balancing act between stimulating economic growth and curbing inflation to maintain price stability.

Looking Ahead

As we move forward into 2024, all eyes will be on the evolving economic indicators and their implications for inflation, consumer spending, and monetary policy. The Consumer Price Index, as a primary measure of inflation, will continue to play a pivotal role in these discussions. The next CPI report, scheduled for release in April 2024, will be eagerly awaited for further clues on the direction of the U.S. economy.

In summary, the February 2024 CPI report highlights the nuanced landscape of inflationary pressures facing the U.S. economy. While certain sectors like energy and shelter are driving price increases, the overall picture is complex, with stabilizing food prices providing a counterbalance. Understanding these dynamics is essential for navigating the economic challenges and opportunities that lie ahead.

Source: https://www.bls.gov/news.release/cpi.nr0.htm


Start futures forex fx news trading with Haawks G4A low latency machine-readable data, one of the fastest machine-readable news trading feed for US economic and commodity data.

Please let us know your feedback. If you are interested in timestamps, please send us an email to sales@haawks.com.

Comment

Comment

34 pips potential profit in 14 seconds on 8 March 2024, analysis on forex fx futures news trading USDJPY and EURUSD on US Employment Situation (Non-farm payrolls/NFP) data

According to our analysis USDJPY and EURUSD moved around 34 pips on US Employment Situation (Non-farm payrolls / NFP) data on 8 March 2024.

USDJPY (22 pips)

EURUSD (12 pips)

Charts are exported from JForex (Dukascopy).


Analyzing the February 2024 Employment Situation: A Closer Look

The latest Employment Situation Summary released by the U.S. Bureau of Labor Statistics (BLS) provides a comprehensive overview of the labor market in February 2024. In a month that saw a mix of growth and challenges, the total nonfarm payroll employment increased by 275,000 jobs. However, the unemployment rate edged up to 3.9 percent. This post delves into the key findings from the report and what they signify for the U.S. economy.

Job Growth Across Sectors

February's job gains were notable in several sectors, indicating the economy's resilient areas. Health care led the way with 67,000 new jobs, continuing its trend of robust growth. The government sector also saw a significant increase, adding 52,000 jobs, with local and federal levels both contributing to this growth. Additionally, food services and drinking places bounced back with 42,000 jobs, and the social assistance sector added 24,000 jobs. The transportation and warehousing sector, despite recent fluctuations, increased by 20,000 jobs, showcasing some recovery in logistics and delivery services.

Unemployment and Labor Force Participation

The unemployment rate's slight increase to 3.9 percent, coupled with an addition of 334,000 unemployed individuals, signals some underlying challenges. Despite the job gains, the rise in unemployment suggests that more people are entering or re-entering the job market but not all are finding employment immediately. The labor force participation rate remained steady at 62.5 percent, indicating a stable but cautious optimism among workers.

Demographic Insights

The report provides detailed insights into unemployment rates across various demographic groups. Notably, adult women and teenagers saw an increase in unemployment rates, while rates for adult men, Whites, Blacks, Asians, and Hispanics showed little or no change. These differences underscore the uneven impacts of economic changes on different parts of the population.

Wages and Working Hours

Average hourly earnings saw a modest increase of 5 cents to $34.57, following a more substantial increase in January. This slow growth in wages, combined with a slight increase in the average workweek for all employees to 34.3 hours, suggests that while employment is growing, wage inflation might be cooling off, which could have implications for overall consumer spending and inflation.

Revisions and Forward Look

The BLS also revised the job growth figures for December and January downwards, suggesting that the job market was slightly less robust than initially thought in the closing months of the previous year. These revisions are a reminder of the volatility and unpredictability inherent in labor market data.

Conclusions

The February 2024 Employment Situation Summary paints a picture of a labor market that is still expanding but facing new challenges as it adapts to a changing economic landscape. The increase in the unemployment rate, despite significant job gains, indicates a growing workforce and potentially more people searching for better opportunities. As we look ahead, the labor market's resilience will be tested by various factors, including inflation, policy changes, and global economic trends. Stakeholders, from policymakers to businesses to individual workers, will need to stay informed and adaptable to navigate these changes successfully.

The next employment situation report, due in April, will be highly anticipated for further insights into the labor market's trajectory as we move deeper into 2024.

Source: https://www.bls.gov/news.release/empsit.nr0.htm


Start forex fx futures news trading with Haawks G4A low latency machine-readable data today, one of the fastest news data feeds for US economic and commodity data.

Please let us know your feedback. If you are interested in timestamps, please send us an email to sales@haawks.com.

Comment

Comment

43 pips potential profit in 93 seconds on 5 March 2024, analysis on futures forex fx low latency news trading USDJPY and EURUSD on US Factory Orders data

According to our analysis USDJPY and EURUSD moved 43 pips on US Factory Orders data on 5 March 2024.

USDJPY (21 pips)

EURUSD (22 pips)

Charts are exported from JForex (Dukascopy).


Analyzing the Latest Trends in U.S. Manufacturing: January Report Overview

The U.S. Census Bureau's recent release on manufacturers’ shipments, inventories, and orders for January reveals a mixed bag of results, painting a complex picture of the manufacturing sector at the start of 2024. Here's a breakdown of the key figures and what they might mean for the industry and the broader economy.

New Orders Decline

January saw a significant decrease in new orders for manufactured goods, dropping $21.5 billion or 3.6 percent to $569.7 billion. This marks the third decline in the last four months, following a modest 0.3 percent decrease in December. The continued downturn in new orders could signal a cooling demand for manufactured goods, possibly reflecting broader economic headwinds or cautious consumer spending. It's a development that warrants close monitoring, as persistent declines could impact production levels and employment in the manufacturing sector.

Shipments on the Downswing

The report also highlighted a decrease in shipments, which fell $5.7 billion or 1.0 percent to $572.3 billion, marking the fourth decline in the last five months. This continued decrease, following a 0.5 percent drop in December, suggests that manufacturers might be adjusting their outputs in response to the slowing demand. The shipments data is crucial as it reflects the volume of goods being distributed for sale, indicating the immediate health of the manufacturing sector.

Unfilled Orders Increase

In contrast to the declines in new orders and shipments, unfilled orders for manufactured goods have shown resilience, increasing $2.1 billion or 0.2 percent to $1,395.1 billion. This increase, observed for thirteen of the last fourteen months, points to a backlog of orders waiting to be completed. The unfilled orders-to-shipments ratio also rose to 7.18 from 7.10 in December, suggesting that manufacturers are facing a growing queue of orders. While on one hand, this can indicate healthy demand, it also raises questions about capacity constraints and potential delays in fulfilling orders.

Inventories Dip Slightly

Inventories saw a minor decrease of $0.8 billion or 0.1 percent to $855.8 billion, marking the second consecutive month of declines. This slight decrease in inventories, following a virtually unchanged December, could suggest that manufacturers are cautiously managing their stock in response to the uncertain demand environment. The inventories-to-shipments ratio increased slightly to 1.50 from 1.48 in December, indicating that companies might be holding more stock relative to their sales, possibly as a buffer against supply chain disruptions.

What This Means Moving Forward

The January 2024 report underscores the challenges and uncertainties facing the manufacturing sector. The decline in new orders and shipments could be early signs of a softening economy or reflect specific sectoral shifts. However, the increase in unfilled orders suggests that there remains a solid foundation of demand, albeit with potential delivery delays.

Looking ahead, manufacturers will need to navigate these mixed signals carefully, balancing production with demand while managing inventories smartly to avoid excesses or shortages. Additionally, the sector will likely keep a close eye on economic indicators and consumer sentiment to gauge future demand trends.

As we move further into 2024, the manufacturing sector's performance will be crucial in signaling the direction of the broader U.S. economy. Stakeholders across the industry will be watching closely to see how these trends develop and what they mean for manufacturing and economic growth in the months ahead.

Source: https://www.census.gov/manufacturing/m3/current/index.html


Start futures forex fx news trading with Haawks G4A low latency machine-readable data, one of the fastest machine-readable news trading feeds for US economic and commodity data.

Please let us know your feedback. If you are interested in timestamps, please send us an email to sales@haawks.com.

Comment

Comment

51 pips potential profit in 3 second on 1 March 2024, analysis on futures forex fx low latency news trading USDJPY and EURUSD on University Michigan Consumer Sentiment / Inflation Expectations

According to our analysis USDJPY and EURUSD moved 51 pips on University Michigan Consumer Sentiment / Inflation Expectations data on 1 March 2024.

USDJPY (31 pips)

EURUSD (20 pips)

Charts are exported from JForex (Dukascopy).


Analyzing the February 2024 Consumer Sentiment: A Closer Look at Economic Perspectives

As we delve into the latest data from February 2024, a nuanced picture of consumer sentiment emerges, reflecting a complex interplay of expectations, current economic conditions, and inflation perceptions. The February report showcases a slight decline in consumer sentiment, with the Index of Consumer Sentiment falling to 76.9 from January's 79.0, marking a 2.7% decrease. Despite this month-to-month slip, the year-over-year comparison reveals a robust 14.9% increase from February 2023's 66.9, highlighting a significant uplift in consumer confidence over the past year.

Current Economic Conditions and Expectations

The Current Economic Conditions Index also witnessed a decline, dropping from 81.9 in January to 79.4 in February 2024, which translates to a 3.1% decrease. However, this dip does not overshadow the 12.3% year-over-year improvement from February 2023's 70.7, indicating that consumers perceive a stronger economy now than they did a year ago.

On the other hand, the Index of Consumer Expectations, which measures future economic prospects, decreased by 2.5% to 75.2 from January's 77.1. Yet, it stands 16.6% higher than the previous year's 64.5, suggesting a growing optimism about the economic future despite the slight month-to-month contraction.

Inflation Expectations: A Silver Lining?

A critical aspect of the report is the nuanced understanding of inflation expectations. Year-ahead inflation expectations edged up slightly from 2.9% in January to 3.0% in February. This subtle increase is within the 2.3-3.0% range observed in 2018 and 2019, indicating that short-run inflation expectations are stabilizing within pre-pandemic norms. Long-run inflation expectations remained steady at 2.9% for the third consecutive month, consistently within the narrow 2.9-3.1% range for 28 of the last 31 months. This steadiness, slightly above the 2.2-2.6% range seen in the two years pre-pandemic, suggests a cautious but stable outlook on inflation among consumers.

Partisan Perceptions and Economic Outlook

The featured chart on "Partisan Perceptions and Expectations" from February 23, 2024, further enriches the narrative by illustrating how political affiliations may influence economic perceptions and expectations. This aspect underscores the complexity of consumer sentiment and its susceptibility to broader socio-political dynamics.

Forward Look

Consumer sentiment's slight dip in February 2024, juxtaposed against the backdrop of significant year-over-year gains, offers a multi-dimensional view of the consumer psyche. The steadiness in long-term inflation expectations and the modest increase in short-term views reflect a cautious optimism among consumers. They seem assured by the trajectory of the economy and inflation, despite recognizing the uncertainties that lie ahead.

As we await the next data release on March 15, 2024, for preliminary March data, it will be intriguing to see how these trends evolve. Will consumer sentiment continue to hold the gains of the past months, or will new economic developments sway the public's confidence? Only time will tell, but for now, the February report provides a substantive basis for understanding current consumer attitudes towards the economy and inflation.

Source: http://www.sca.isr.umich.edu


Start futures and forex fx news trading with Haawks G4A low latency machine-readable data, one of the fastest machine-readable news trading feeds for US macro-economic and commodity data.

Please let us know your feedback. If you are interested in timestamps, please send us an email to sales@haawks.com.

Comment

Comment

38 ticks potential profit in 157 seconds on 29 February 2024, analysis on futures forex fx news trading natural gas on DOE Natural Gas Storage Report data

According to our analysis natural gas moved 38 ticks on DOE Natural Gas Storage Report data on 29 February 2024.

Natural gas (38 ticks)

Charts are exported from JForex (Dukascopy).


Understanding the Latest Shifts in Natural Gas Storage: A Detailed Analysis

In the realm of energy markets, few metrics garner as much attention as the weekly updates on natural gas storage. The latest data for the week ending February 23, 2024, provides a fascinating snapshot of the current state of natural gas reserves in the United States. Released on February 29, 2024, by the Energy Information Administration (EIA), the report indicates significant movements in underground storage levels across the Lower 48 states. Here, we delve into the nuances of these changes and what they could mean for consumers, businesses, and the broader energy landscape.

A Glimpse into the Numbers

The report reveals that as of February 23, 2024, working gas in underground storage stood at 2,374 billion cubic feet (Bcf). This figure marks a notable decrease of 96 Bcf from the previous week, showcasing the dynamic nature of energy storage and its susceptibility to various influencing factors.

When placed in historical context, the current storage levels are considerably higher than in the past. Compared to the same period last year, stocks have risen by 248 Bcf. Even more striking is the comparison with the five-year average for 2019-2023, where the current levels exceed the norm by 498 Bcf. This surplus places the total working gas significantly above the five-year historical range, hinting at a robust buffer that could have implications for market dynamics and pricing.

Regional Insights

The breakdown by region offers a closer look at where these changes are most pronounced:

  • East: The East region saw a reduction of 52 Bcf, bringing its stocks slightly below the same period last year by 0.4%, yet still above the five-year average by 10.8%.

  • Midwest: A decrease of 31 Bcf in the Midwest contributed to a 9.5% increase from last year and a 24.5% rise above the five-year average.

  • Mountain: The Mountain region experienced a modest drop of 4 Bcf, resulting in a significant 69% jump from both last year and the five-year average.

  • Pacific: Remarkably, the Pacific region's stocks remained unchanged week-over-week, yet they are 117% higher than last year and 35.6% above the five-year average.

  • South Central: This region saw a decrease of 9 Bcf, maintaining a slight increase of 1.3% from the previous year and a notable 29% above the five-year average.

Implications for the Market

The substantial overall increase in natural gas storage compared to historical averages suggests a comfortable supply situation in the U.S. This surplus could potentially lead to stabilized, if not lower, natural gas prices in the short term, benefiting consumers and businesses alike. However, the energy market is notoriously volatile, influenced by factors such as weather conditions, production levels, and geopolitical events. Therefore, while the current storage levels offer a cushion, stakeholders should remain vigilant and responsive to any shifts in the market landscape.

Looking Ahead

As we approach the end of the heating season, the dynamics of natural gas storage and consumption will continue to evolve. The next release, scheduled for March 7, 2024, will further elucidate trends and inform strategies for producers, consumers, and investors. In the meantime, the current data underscores the importance of strategic energy management and the potential for natural gas to play a pivotal role in meeting the nation's energy needs in a sustainable and cost-effective manner.

In conclusion, the latest EIA report on natural gas storage highlights a moment of relative abundance in the U.S. energy landscape. By keeping a close eye on these developments, stakeholders can navigate the market more effectively, leveraging opportunities and mitigating risks in the ever-changing energy sector.

Source: https://ir.eia.gov/ngs/ngs.html


Start futures forex fx commodity news trading with Haawks G4A low latency machine-readable data, one of the fastest data feeds for DOE data.

Please let us know your feedback. If you are interested in timestamps, please send us an email to sales@haawks.com.

Comment

Comment

51 pips potential profit in 27 seconds on 19 February 2024, analysis on futures forex fx news trading EURSEK first on Sweden Consumer Price Index (CPI) data

According to our analysis EURSEK moved 51 pips on Sweden Consumer Price Index (CPI) data on 19 February 2023.

EURSEK (51 pips)

Charts are exported from JForex (Dukascopy).


Understanding Sweden's January 2024 Inflation Dynamics

In the crisp winter month of January 2024, Sweden experienced a notable uptick in its inflation rate, which climbed to 5.4 percent, according to the Consumer Price Index (CPI). This marked a significant increase from the 4.4 percent inflation rate observed in December. This shift has drawn considerable attention from economists, policymakers, and the public alike, as it signals changes in the economic landscape that could have widespread implications.

The Details Behind the Numbers

The latest statistical news from Statistics Sweden, released on February 19, 2024, paints a comprehensive picture of the current inflationary trends. On a month-to-month basis, the CPI saw a slight decrease of 0.1 percent from December to January. However, when looking at the bigger picture, the annual inflation rate according to the CPIF (Consumer Price Index with a fixed interest rate) settled at 3.3 percent in January, revealing the nuanced dynamics at play in the Swedish economy.

Housing Costs: The Major Inflation Driver

A key factor contributing to the rise in the inflation rate is the increase in housing costs. Mikael Nordin, a statistician at Statistics Sweden, emphasized that housing continues to be the largest contributor to the CPI-driven inflation rate. This is a trend observed not just in Sweden but globally, as housing markets adjust to post-pandemic realities and changing interest rate environments.

Diving Deeper into the CPI Components

The CPI, which serves as a measure of the average price basket of goods and services purchased by households, increased to 412.74, with housing, electricity, and mortgage costs leading the charge. Notably, the interest rates for household mortgages played a significant role, contributing 2.3 percentage points to the annual inflation rate.

On the flip side, seasonal price decreases in clothing and air travel, along with a significant 11 percent drop in fuel prices, primarily due to lower diesel prices, helped to temper the overall inflation rate. This demonstrates the complex interplay of various factors that drive inflation, from global oil prices to local consumption patterns.

The CPIF and CPIF-XE Indices

The CPIF and CPIF-XE indices offer additional insights into the inflationary landscape. The CPIF-XE, which excludes volatile energy prices, posted a 4.4 percent inflation rate, down from 5.3 percent in December. This indicates that, excluding energy, the core inflationary pressures remain significant, though slightly alleviated compared to the end of the previous year.

The Broader Economic Implications

The inflation data for January 2024 provides a crucial snapshot of Sweden's economic health and the challenges it faces. Rising inflation can erode purchasing power and impact living standards, prompting the central bank to potentially adjust monetary policy to keep inflation in check. For households, the increase in mortgage costs and housing expenses highlights the need for careful financial planning and budgeting.

Looking Ahead

As we move further into 2024, it will be vital to monitor how Sweden's inflation trajectory evolves, especially in response to policy measures and global economic trends. The next publication from Statistics Sweden, due on March 14, 2024, will be eagerly awaited for further clues on the direction of the Swedish economy.

In the meantime, individuals and businesses alike must navigate the inflationary landscape with a keen eye on budgeting and financial planning, as the effects of inflation permeate through various sectors of the economy.

Source: https://www.scb.se/en/finding-statistics/statistics-by-subject-area/prices-and-consumption/consumer-price-index/consumer-price-index-cpi/pong/statistical-news/consumer-price-index-cpi-january-2024/


Start futures forex fx news trading with Haawks G4A low latency machine-readable data today, one of the fastest news data feeds for US economic and commodity data.

Please let us know your feedback. If you are interested in timestamps, please send us an email to sales@haawks.com.

Comment

Comment

35 pips potential profit in 25 seconds on 15 February 2024, analysis on futures forex fx news trading USDJPY and EURUSD on US Philly Fed Manufacturing and US Retail Sales data

According to our analysis USDJPY and EURUSD moved 35 pips on US Philadelphia Federal Reserve Bank Manufacturing Business Outlook Survey data and US Retail Sales data on 15 February 2024.

USDJPY (21 pips)

EURUSD (14 pips)

Charts are exported from JForex (Dukascopy).


Analyzing the Latest Economic Indicators: Retail Sales and Manufacturing Sector Insights

In the ever-evolving landscape of the U.S. economy, recent releases from the Commerce Department and the Federal Reserve Bank offer critical insights into consumer behavior and manufacturing activity. The Advance Monthly Sales for Retail and Food Services report and the February 2024 Manufacturing Business Outlook Survey provide a mixed picture of the current economic environment, with signs of resilience in certain sectors despite overarching challenges. Let's delve into the details of both releases to understand their implications.

Retail Sales Take a Slight Dip with a Silver Lining

According to the Commerce Department's report for January 2024, U.S. retail and food services sales saw a minor retreat, marking a 0.8 percent decrease from the previous month, yet they experienced a 0.6 percent increase from January 2023. This nuanced performance underscores a broader trend of cautious consumer spending amidst economic uncertainties. Total sales for the November 2023 through January 2024 period, however, were up 3.1 percent from the same period a year ago, indicating a sustained appetite for retail and food services over the longer term.

The report also highlighted significant sectoral disparities. While traditional retail trade sales dipped slightly, nonstore retailers and food services continued to exhibit strong growth, suggesting a shift in consumer preferences towards online shopping and dining out. This divergence reflects the dynamic nature of consumer spending patterns and the ongoing adaptation of the retail sector to changing tastes and technological advancements.

Manufacturing Sector Shows Signs of Cautious Optimism

The Federal Reserve Bank's February 2024 Manufacturing Business Outlook Survey presents a cautiously optimistic view of the manufacturing sector. After months of subdued activity, the survey's indicators for general activity and shipments turned positive, signaling a potential rebound. However, the new orders index, despite improvements, remained in negative territory, indicating persistent challenges in demand.

Employment in the manufacturing sector appears to be contracting, with the employment index dropping to its lowest reading since May 2020. This suggests that manufacturers are becoming more cautious in their hiring, possibly due to uncertainties about future demand and operational costs.

Price indexes, while indicating overall increases, remain below long-run averages, hinting at a complex pricing environment where firms are possibly facing pressures to manage costs amidst fluctuating demand.

Looking ahead, the survey's future activity indicators suggest that manufacturers are growing more optimistic about growth over the next six months. This optimism is reflected in the expectations for increased activity, new orders, and even capital expenditures, pointing towards a cautious but hopeful outlook for the manufacturing sector.

Conclusion

The contrasting narratives from the retail and manufacturing sectors highlight the multifaceted nature of the current economic landscape. On one hand, consumer spending in the retail sector shows resilience, with significant growth in online shopping and food services. On the other hand, the manufacturing sector, while facing immediate challenges, is cautiously optimistic about the future.

These developments suggest that while the economy navigates through uncertainties, certain sectors continue to adapt and find growth opportunities. For businesses and policymakers, understanding these nuanced dynamics is crucial for making informed decisions and fostering a supportive environment for growth and stability in the changing economic climate.

Source: https://www.census.gov/retail/sales.html, https://www.philadelphiafed.org/surveys-and-data/regional-economic-analysis/mbos-2024-02


Please let us know your feedback. If you are interested in timestamps, please send us an email to sales@haawks.com.

Start futures forex fx news trading with Haawks G4A low latency machine-readable data today, one of the fastest news data feeds for US macro-economic and commodity data.

Comment

Comment

24 pips potential profit in 3 minutes on 8 February 2024, analysis on futures forex fx low latency news trading USDJPY and EURUSD on US Jobless Claims data

According to our analysis USDJPY and EURUSD moved 24 pips on US Jobless Claims data on 8 February 2024.

USDJPY (19 pips)

EURUSD (5 pips)

Charts are exported from JForex (Dukascopy).


The latest report on unemployment insurance weekly claims, released on February 8, 2024, indicates a decrease in the number of initial jobless claims and a slight improvement in the U.S. labor market conditions. For the week ending February 3, the seasonally adjusted initial claims fell by 9,000 to 218,000 from the previous week's revised level. The 4-week moving average, which smooths out weekly volatility, increased slightly to 212,250. The seasonally adjusted insured unemployment rate decreased to 1.2% for the week ending January 27, with a corresponding decline in the number of people receiving unemployment benefits to 1,871,000.

Unadjusted data also showed a decline in initial claims, totaling 232,727, which is an 11.8% decrease from the previous week. The unadjusted insured unemployment rate stood at 1.4%, with a year-over-year comparison indicating a stable labor market. Regionally, the highest unemployment rates were in New Jersey, Rhode Island, and Minnesota, among others, with notable increases in initial claims in Oregon, California, and New York, and significant decreases in Illinois, Missouri, and Massachusetts.

This report suggests a resilient labor market, with fluctuations in unemployment claims reflecting normal economic adjustments rather than a significant downturn.

Source: https://www.dol.gov/ui/data.pdf


Start futures forex fx news trading with Haawks G4A low latency machine-readable data, one of the fastest machine-readable news trading feeds for US economic and commodity data.

Please let us know your feedback. If you are interested in timestamps, please send us an email to sales@haawks.com.

Comment

3879 pips potential futures forex fx news trading profit from 31 events in the fourth quarter of 2023 with Haawks G4A machine-readable news data feed

Comment

3879 pips potential futures forex fx news trading profit from 31 events in the fourth quarter of 2023 with Haawks G4A machine-readable news data feed

We are pleased to announce that there was a potential of 3879 pips/ticks profit out of the following 31 events in the fourth quarter of 2023 based on our ex-post analysis. The potential performance for 2023 was 13,607 pips/ticks.

Q4 2023

Cumulative potential, indicative performance Q4 2023, please see all releases below.

Total trading time would have been around 47 minutes in 3 months! (preparation time not included)


Navigating the Waves of Market Volatility: Insights from Recent Economic Data

In the ever-evolving landscape of financial markets, understanding the nuances of economic reports and central bank decisions is akin to mastering the art of navigation in the high seas of global finance. The recent flurry of economic data and policy announcements offers a treasure trove of insights for both seasoned investors and market novices alike. This blog post delves into the significant economic events from late 2023, analyzing their impact on various financial markets and what they portend for future market dynamics.

Unraveling the Tapestry of Economic Indicators

Economic reports such as the US Employment Situation (Non-farm payrolls/NFP), Consumer Price Index (CPI), and Gross Domestic Product (GDP) are pivotal in shaping market sentiment and monetary policy. Similarly, decisions by central banks, including the Federal Open Market Committee (FOMC) and other international bodies, play a crucial role in determining the cost of borrowing money, which in turn influences economic growth and inflation.

The Ripple Effects of US Economic Reports

The US economy, being the largest in the world, has a profound impact on global markets. For instance, the Non-farm Payrolls report for early November showed a significant movement, with a change of 58 pips & 83 points, underscoring the labor market's resilience or concerns, depending on the data's context. Such fluctuations often lead to volatility in the forex, bond, and stock markets as investors adjust their portfolios in response to the health of the US economy.

The Consumer Price Index (CPI), a key measure of inflation, saw movements of 11 pips in mid-October and a notable 58 pips & 222 points in mid-November. These shifts highlight market reactions to inflationary pressures, influencing the Federal Reserve's interest rate decisions.

Global Perspectives: From Sweden to Turkey

The economic reports are not limited to the US. International data, such as Sweden's CPI and Turkey's interest rate decision, also sway market sentiments. Sweden's CPI movement of 154 pips in mid-October indicates significant inflationary trends or deflationary pressures, affecting the Swedish Krona and potentially influencing the European Central Bank's (ECB) monetary policy.

Turkey's dramatic interest rate decision movement of 1668 pips in late November reflects the country's economic policy stance and its implications for currency volatility, inflation, and international trade relations.

Central Bank Decisions: A Balancing Act

Central bank decisions, such as those made by the FOMC and Norges Bank, are critical. For instance, the FOMC's interest rate decision and projections in mid-December led to a 67 pips & 104 points movement, illustrating the market's sensitivity to US monetary policy. Such decisions impact global borrowing costs, investment flows, and currency values.

Forward-Looking Strategies

Given the intricate dance of economic indicators and central bank policies, investors and traders must adopt forward-looking strategies to navigate market volatility. Staying informed about upcoming reports, understanding the historical context of data releases, and diversifying portfolios can mitigate risks and capitalize on opportunities.

The Importance of Diversification

Diversification across asset classes, sectors, and geographies is a time-tested strategy to spread risk. The variability in market reactions to different reports underscores the unpredictability of financial markets and the need for a well-rounded investment approach.

Staying Informed and Agile

In a world where information is king, staying abreast of economic calendars and market analyses is paramount. Agile investors can adjust their strategies in response to new data, seizing opportunities or hedging against potential downturns.

Conclusion

The latter part of 2023 has been a vivid reminder of the dynamic nature of financial markets, driven by a complex web of economic reports and central bank decisions. By dissecting these events and understanding their implications, investors and traders can better navigate the uncertain waters of global finance, making informed decisions that align with their investment goals and risk tolerance. As we look ahead, the ability to interpret economic indicators and anticipate policy shifts will remain indispensable tools in the investor's toolkit.

Disclaimer: This blog post is for informational purposes only and should not be construed as financial advice. Always conduct thorough research and consider seeking advice from a financial professional before making any investment decisions.


Start futures/forex/oil/grains news trading with Haawks G4A low latency machine-readable data today, we offer one of the fastest machine-readable data feeds for US economic and commodity data and economic data from Norway, Sweden, Turkey and ECB interest rates and statement.

Please let us know your feedback and check out our G4A low latency data feed.

All data is machine readable and available via API access in Aurora, CH1, NY4 and LD4. Free trials.

Comment