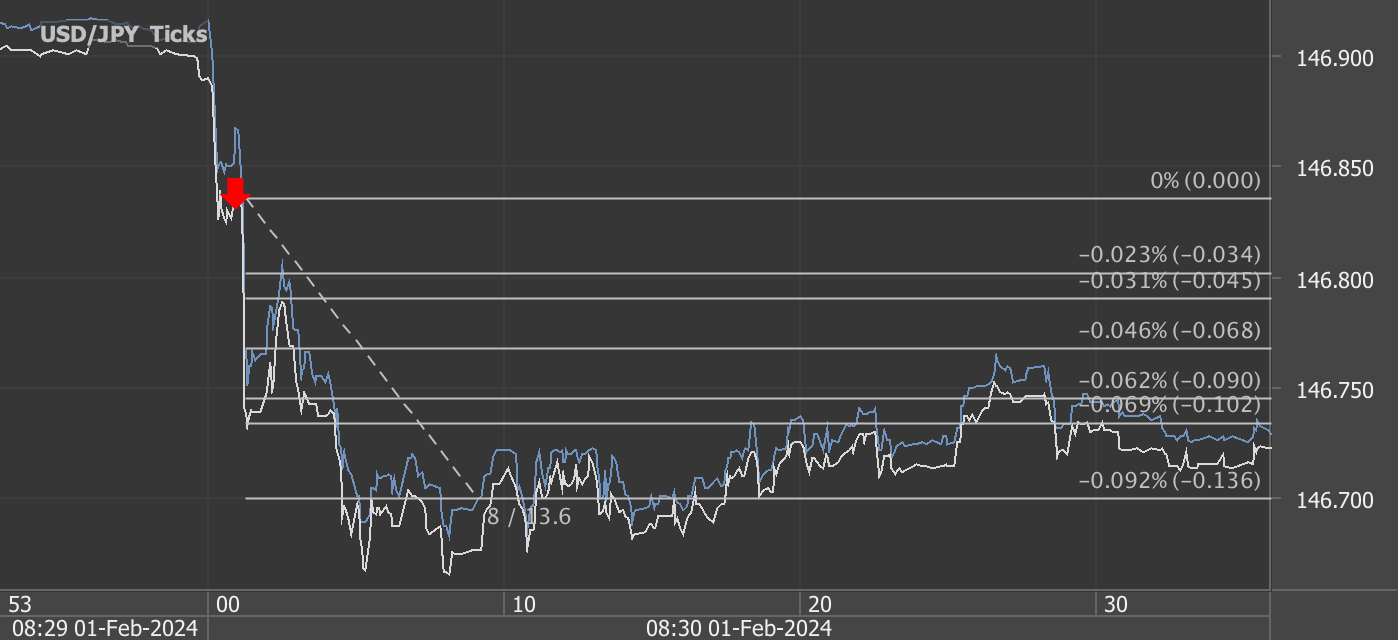
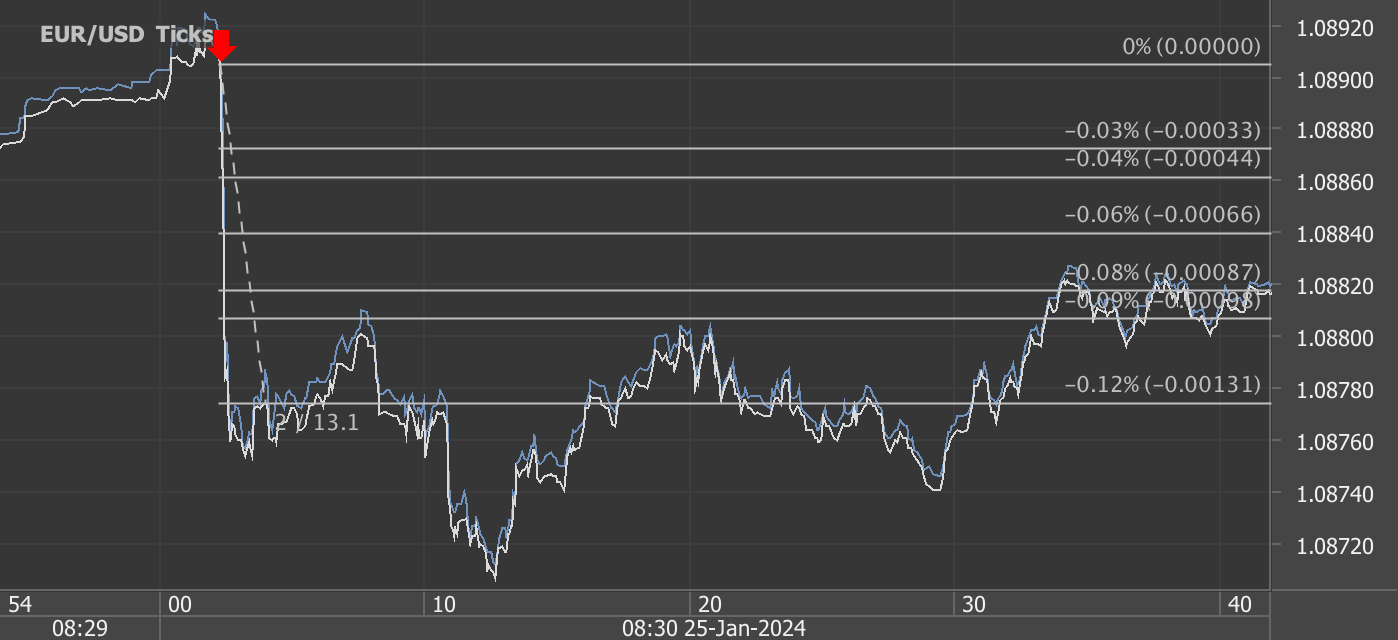
According to our analysis USDJPY and EURUSD moved around 95 pips on US Employment Situation (Non-farm payrolls / NFP) data on 2 February 2024.
USDJPY (55 pips)

EURUSD (40 pips)

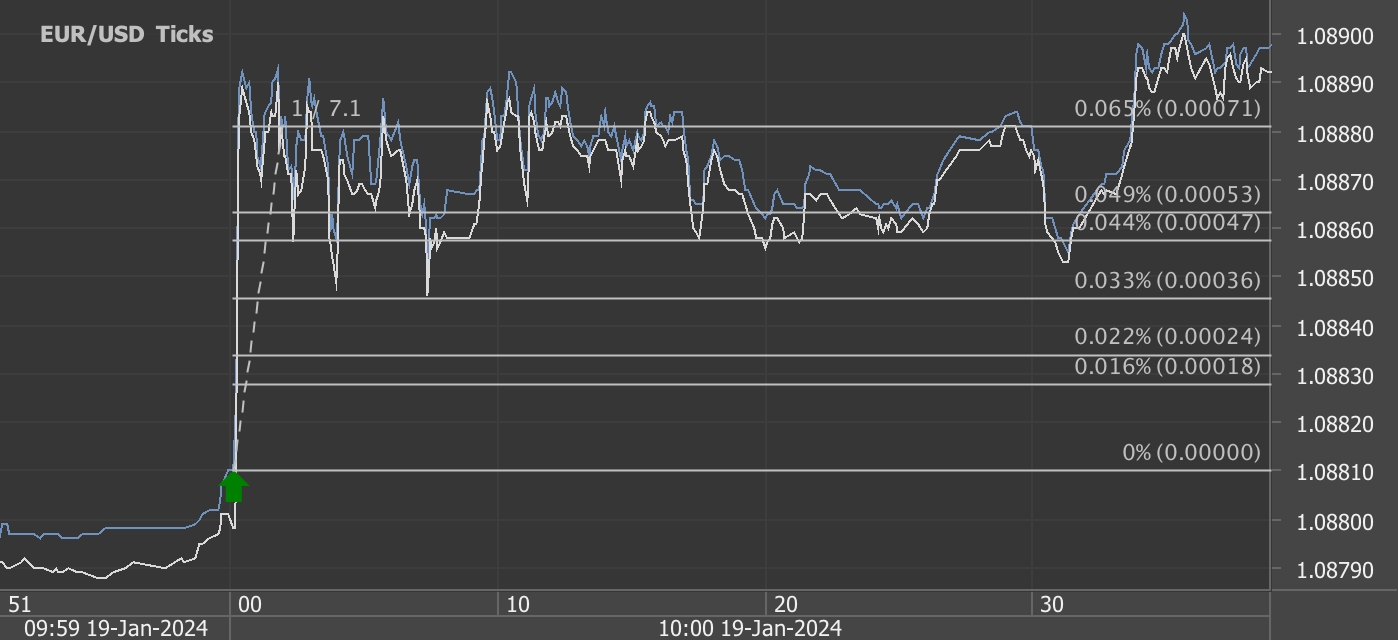
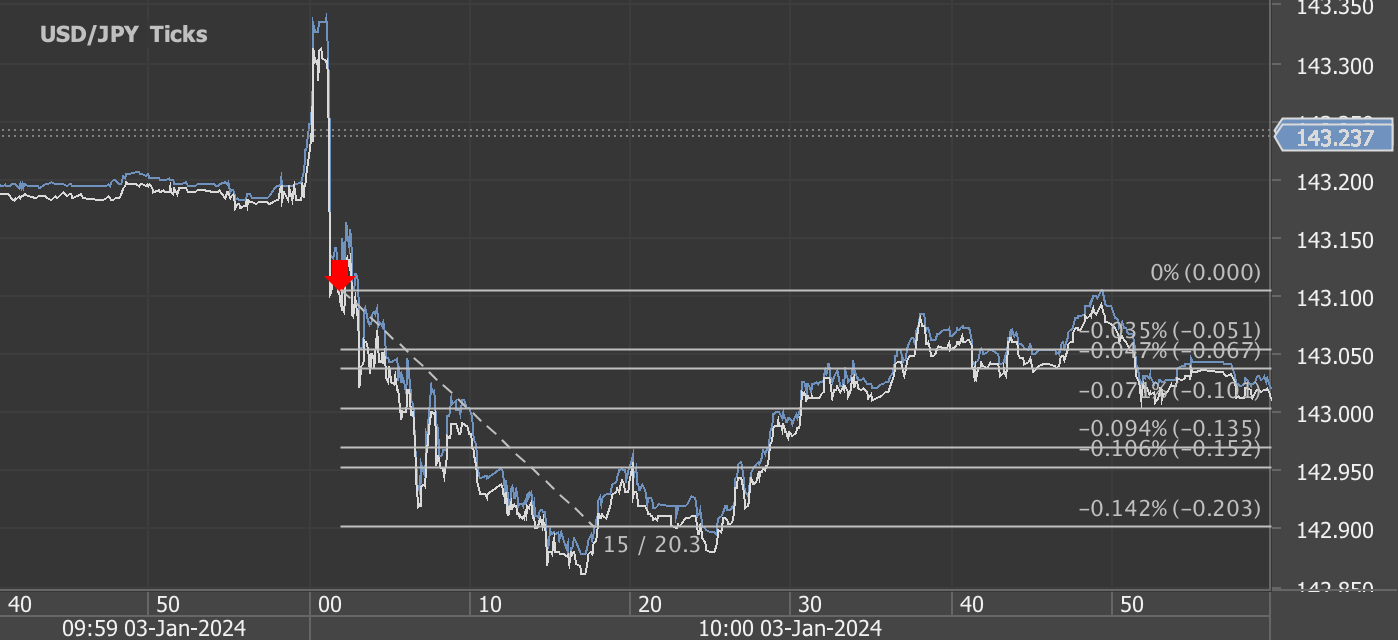
Charts are exported from JForex (Dukascopy).
The U.S. Bureau of Labor Statistics released the Employment Situation Summary for January 2024, showing significant job growth and stable unemployment rates. Here are the key points:
Total Nonfarm Payroll Employment Increase: In January, there was an increase of 353,000 jobs, with the unemployment rate holding steady at 3.7 percent. This continues the trend of job growth across various sectors, notably in professional and business services, health care, retail trade, and social assistance. However, there was a decline in employment within the mining, quarrying, and oil and gas extraction industry.
Household Survey Data: The unemployment rate remained constant at 3.7 percent for the third consecutive month, with the number of unemployed individuals slightly changing to 6.1 million. Unemployment rates among major worker groups, including adult men, women, teenagers, Whites, Blacks, Asians, and Hispanics, showed minimal or no change in January. Long-term unemployment (jobless for 27 weeks or more) also remained stable, accounting for 20.8 percent of the unemployed.
Labor Force Participation: The labor force participation rate was unchanged at 62.5 percent, and the employment-population ratio slightly varied at 60.2 percent, indicating little to no change over the year. Additionally, 4.4 million individuals were employed part-time for economic reasons, with the number of people not in the labor force but wanting a job remaining at 5.8 million.
Establishment Survey Data: Job gains were observed in several sectors, with professional and business services adding 74,000 jobs, health care employment rising by 70,000, and retail trade employment increasing by 45,000. However, the mining, quarrying, and oil and gas extraction industry saw a decrease in employment by 5,000.
Earnings and Workweek: Average hourly earnings for all employees on private nonfarm payrolls rose by 19 cents to $34.55, marking a 4.5 percent increase over the past 12 months. The average workweek for all employees decreased by 0.2 hour to 34.1 hours in January.
Revisions: The employment figures for November and December were revised, showing that employment was 126,000 higher than previously reported. The next Employment Situation release is scheduled for March 8, 2024.
This report reflects a robust job market, with significant employment gains in various sectors and stable unemployment rates, contributing to the overall health of the U.S. economy.
Start forex fx futures news trading with Haawks G4A low latency machine-readable data today, one of the fastest news data feeds for US economic and commodity data.
Please let us know your feedback. If you are interested in timestamps, please send us an email to sales@haawks.com.