
According to our analysis there was a potential of 116 ticks potential profit out of the following event in June 2026. The potential performance in 2025 was 1,828 pips / ticks.
June 2026
USDA Grain Stocks and USDA Acreage (116 ticks / 30 June 2026)
Total trading time would have been around 2 minutes! (preparation time not included)
You can click on each release for detailed information.
June 2026 Monthly Wrap-Up: One USDA Release, 116 Ticks of Opportunity
Meta description: June was a quiet month for scheduled HAAWKS grain-event coverage, but USDA’s June 30 Acreage and Grain Stocks reports still delivered 116 ticks of potential opportunity across corn, wheat, and soybeans. Here is what moved, why it mattered, and what traders should watch next.
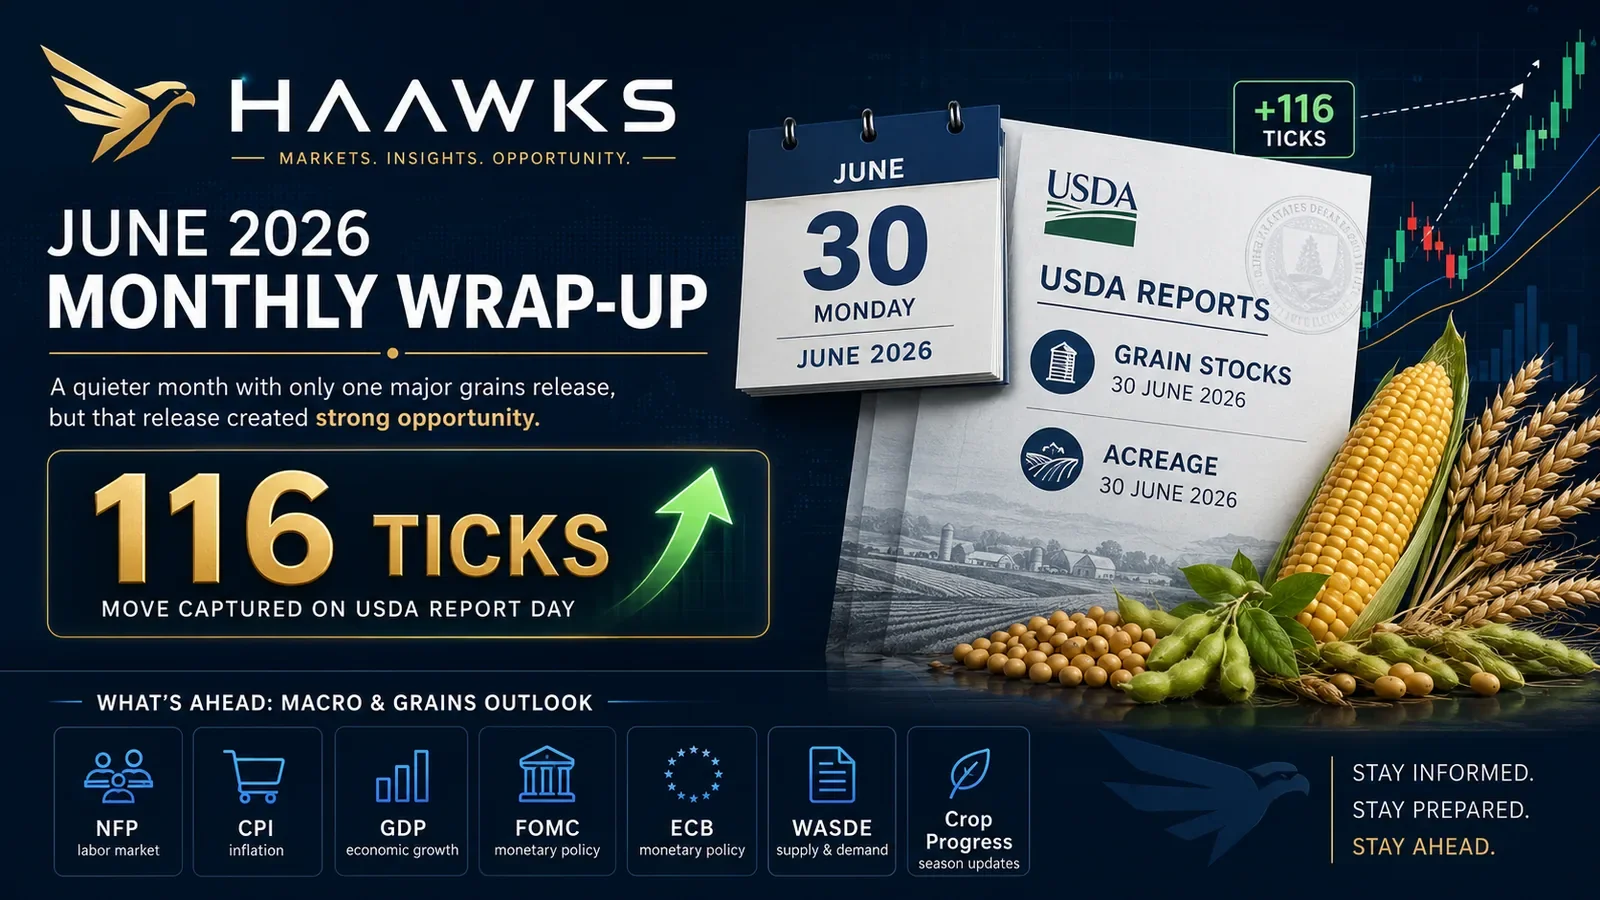
June was a quieter month for scheduled grain-event trading opportunities, with unfortunately only one major HAAWKS release in focus. But the month still ended with a meaningful USDA catalyst. On June 30, USDA published its Acreage and Grain Stocks reports, giving corn, wheat, and soybean traders a fresh summer setup and producing around 116 ticks of potential profit across ZC, ZW, and ZS futures. According to our analysis, soybeans moved around 48 ticks, wheat around 40 ticks, and corn around 28 ticks after the release.
The June Event: USDA Acreage and Grain Stocks
The June 30 reports delivered a mixed but tradable message. Old-crop supplies looked comfortable, while new-crop acreage shifted the balance of weather risk heading into July and August.
USDA estimated corn planted area at 95.3 million acres, down 3% from 2025. Soybean planted area rose to 85.4 million acres, up 5% year over year, while all wheat planted area fell to 42.7 million acres, down 6%. On the stocks side, June 1 inventories were higher for the major grain and oilseed contracts: corn stocks were 5.29 billion bushels, up 14% from last year; soybean stocks were 1.06 billion bushels, up 5%; and old-crop all wheat stocks were 920 million bushels, up 8%.
For traders, the takeaway was not simply bullish or bearish. The reports created a two-sided summer market: heavier old-crop inventories may cap nearby rallies, but acreage uncertainty and summer weather still leave room for new-crop volatility.
Corn: Bearish Stocks, Weather Optionality
Corn carried the clearest old-crop supply pressure. Larger June 1 stocks make it harder for nearby futures to sustain rallies without a demand or weather catalyst. However, planted acreage was lower year over year, and USDA’s survey still left some planting uncertainty in the final acreage picture.
That means December corn remains vulnerable to weather premium. If July forecasts turn hotter or drier, the market can quickly shift from old-crop comfort to new-crop risk pricing.
Soybeans: Bigger Acres, Stronger Demand Clues
Soybeans were pressured by the larger acreage number, but the stocks report included a more supportive demand detail. March-May disappearance was stronger than last year, which helped offset the bearish tone from expanded planted area.
The soybean setup now depends heavily on August weather, crush demand, export headlines, and whether the larger acreage base translates into comfortable production. November soybeans may struggle in benign weather, but the market remains exposed to sharp rallies if conditions deteriorate.
Wheat: Lower Acres Need Confirmation
Wheat had the most supportive acreage story, with all wheat planted area down 6% from last year. But the bullish acreage signal was softened by larger old-crop stocks.
That leaves wheat needing confirmation from yield, quality, export demand, Black Sea headlines, or adverse weather. Lower acres support the structure, but larger inventories reduce the urgency to chase rallies without a second catalyst.
Macro Outlook: June Data Arrives in July
The next macro calendar is important because June reference-month data will be released in July, just as grain markets move deeper into the weather-risk window.
The first major event is U.S. Nonfarm Payrolls for June, scheduled for July 2 at 8:30 a.m. ET. Labor-market data matters for rates, the dollar, and broader risk appetite, all of which can spill into commodities.
Inflation then returns to center stage. June CPI is scheduled for July 14 at 8:30 a.m. ET, followed by June PPI on July 15 at 8:30 a.m. ET. These releases will help shape expectations ahead of the late-July FOMC meeting.
Growth and consumer data will also matter. June retail sales are scheduled for July 16, while Q2 advance GDP and June Personal Income and Outlays / PCE are both scheduled for July 30 at 8:30 a.m. ET.
Central banks remain another source of volatility. The next FOMC meeting is scheduled for July 28-29, with the policy decision due on July 29. The ECB Governing Council monetary policy meeting is scheduled for July 22-23, with the Day 2 decision and press conference on July 23.
Grains Outlook: WASDE, Crop Progress, and Summer Weather
On the grain side, the market now shifts from acreage math to weather execution.
The next major USDA balance-sheet event is the July WASDE, scheduled for July 10 at 12:00 p.m. ET. This report will be the first major opportunity for USDA to incorporate the June acreage framework into updated supply-and-demand expectations.
Weekly Crop Progress reports also become increasingly important. USDA lists upcoming July releases for July 6, July 13, July 20, and July 27 at 4:00 p.m. ET. These reports will help traders track corn condition, soybean development, winter wheat harvest progress, and any early signs of stress from heat or dryness.
Other recurring grain-market inputs to watch include export sales, export inspections, ethanol production, weather-model updates, basis behavior, and CFTC positioning. The Commitments of Traders report is usually released on Fridays at 3:30 p.m. ET and can help show whether funds are adding to or reducing exposure in corn, wheat, and soybeans.
Bottom Line
June may have delivered only one major HAAWKS-covered grain-event opportunity, but it was an important one. The USDA Acreage and Grain Stocks reports produced 116 ticks of potential opportunity and reset the market narrative for summer.
Corn is balancing heavier old-crop stocks against new-crop weather risk. Soybeans have more acres but also stronger demand signals. Wheat has fewer acres, but larger stocks mean rallies still need confirmation.
The practical takeaway for traders is clear: old-crop supply cushions matter, but July is where weather, macro data, and USDA balance sheets begin to interact. After a quiet June, the next phase may be more active.
Disclaimer: This blog post is for informational purposes only and should not be construed as financial advice. Always conduct thorough research and consider seeking advice from a financial professional before making any investment decisions.
Start futures/forex/oil/grains news trading with Haawks G4A low latency machine-readable data today, we offer one of the fastest machine-readable data feeds for US macro-economic and commodity data and macro-economic data from Norway, Sweden, Turkey, Switzerland and ECB interest rates and statement.
Please let us know your feedback and check out our G4A low latency data feed.
All data is machine readable and available via API access in Chicago, New York and London. Free trials.
