According to our analysis natural gas moved 24 ticks on DOE Natural Gas Storage Report data on 17 April 2025.
Natural gas (24 ticks)
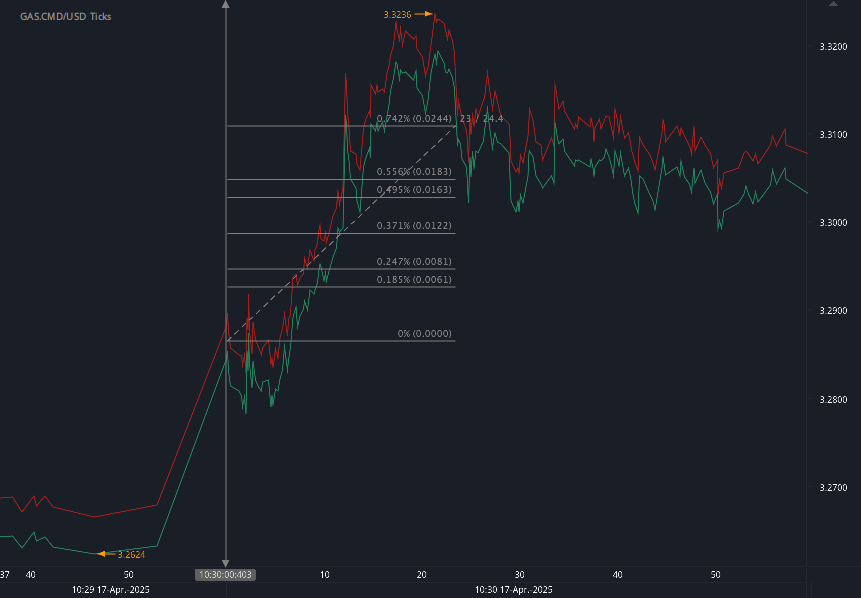
Charts are exported from JForex (Dukascopy).
Natural Gas Market Update: Prices Decline Despite Regional Spikes and Supply Constraints
Week Ending April 16, 2025
This past week in the natural gas market saw a notable divergence between national and regional pricing trends, slight shifts in supply and demand dynamics, and continued robust activity in liquefied natural gas (LNG) exports.
Price Trends: National Benchmarks Down, Regional Prices Mixed
Henry Hub Prices:
The benchmark Henry Hub spot price dropped by $0.22, settling at $3.21/MMBtu. Futures prices followed suit, with the May 2025 NYMEX contract falling $0.57 to $3.247/MMBtu. The 12-month strip (May 2025–April 2026) also declined $0.34 to average $3.929/MMBtu.
Regional Spot Markets:
Spot price movements were varied. While the Algonquin Citygate saw a steep $0.66 drop, the Northwest Sumas hub surged $1.01 to $1.82/MMBtu, driven by cooler temperatures and a temporary outage at the Columbia Nuclear Generating Station. Southern California's SoCal Citygate also saw a $0.23 increase, coinciding with warmer weather and elevated cooling demand.
International LNG Markets:
East Asian LNG prices fell $0.45 to $12.40/MMBtu, while Dutch TTF futures dropped $0.39 to $11.35/MMBtu. Despite these decreases, both markets remain well above their year-ago levels.
Supply and Demand Dynamics
Supply:
Total U.S. natural gas supply dipped slightly by 0.1% to 106.3 Bcf/d. Dry production increased by 0.5 Bcf/d, but net imports from Canada fell 9.3%, or 0.6 Bcf/d—impacted in part by reduced flows into the Pacific Northwest.
Demand:
Overall consumption fell 6.9%, with the most significant drop in the residential/commercial sector (-14.1%). Power generation demand declined 5.4%, and industrial use slipped 1.4%. Exports to Mexico fell by 3.6%, while LNG feed gas deliveries rose modestly by 0.2 Bcf/d to 16.8 Bcf/d.
LNG Activity Remains Strong
Thirty-four LNG vessels departed U.S. terminals between April 10 and April 16, carrying a total capacity of 129 Bcf. Sabine Pass led departures with 10 vessels. Deliveries to South Louisiana terminals increased, while South Texas saw a minor decline.
Storage Levels Lag Behind Seasonal Norms
Net injections into storage were 16 Bcf—well below the five-year average of 50 Bcf and last year’s 46 Bcf. Total working stocks now sit at 1,846 Bcf, marking a 4% deficit against the five-year average and a 21% shortfall year-over-year.
Rig Count Shows Slight Rebalancing
The natural gas rig count rose by one to 97. Regional shifts included a gain in Haynesville and a drop in the Marcellus. The overall rig count (including oil and miscellaneous) fell to 583, down 34 from a year ago.
Conclusion:
Despite seasonal shifts in weather and slight production gains, the natural gas market continues to feel pressure from subdued demand and underwhelming storage injections. While regional price volatility reflects localized supply issues and temperature-driven demand, national and international markets are trending downward—pointing to a cautious short-term outlook.
Disclaimer: This blog post is for informational purposes only and should not be construed as financial advice. Always conduct thorough research and consider seeking advice from a financial professional before making any investment decisions.
Source: https://www.eia.gov/naturalgas/weekly/archivenew_ngwu/2025/04_17/
Start futures forex fx commodity news trading with Haawks G4A low latency machine-readable data, one of the fastest data feeds for DOE data.
Please let us know your feedback. If you are interested in timestamps, please send us an email to sales@haawks.com.