Viewing entries tagged
Forex

Comment

20 pips potential profit in 100 seconds on 18 April 2024, analysis on futures forex fx low latency news trading USDJPY and EURUSD on US Philadelphia Fed Manufacturing data

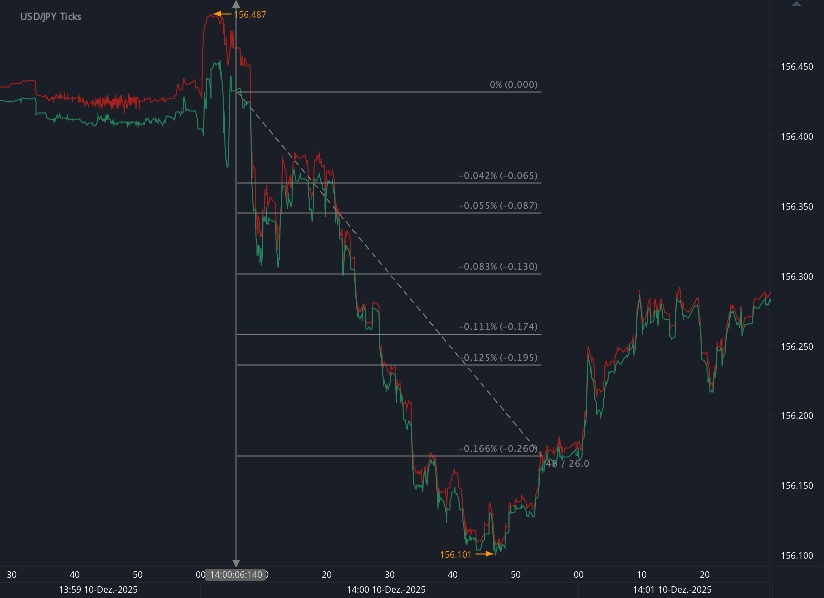
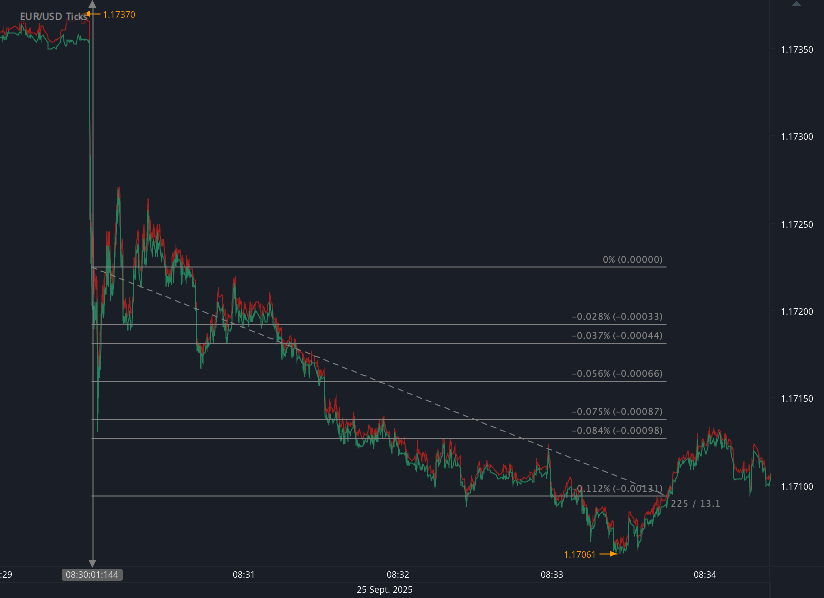
According to our analysis USDJPY and EURUSD moved 20 pips on US Philadelphia Federal Reserve Bank Manufacturing Business Outlook Survey data on 18 April 2024.

USDJPY (10 pips)

EURUSD (10 pips)

Charts are exported from JForex (Dukascopy).


Analyzing the April 2024 Manufacturing Business Outlook Survey: Key Insights and Implications

The April 2024 Manufacturing Business Outlook Survey provides valuable insights into the current state and future expectations of regional manufacturing activity. Collected from April 8 to April 15, the responses offer a comprehensive overview of various economic indicators and their potential impacts on the sector.

Current Manufacturing Trends

In April, the survey highlights a continued expansion in manufacturing activity. Notably, the diffusion index for current general activity increased by 12 points to 15.5, marking its highest level since April 2022. This rise reflects improved sentiments among manufacturers, with approximately 38% of firms reporting increases in general activity. This positivity is further supported by gains in new orders and shipments, suggesting a robust demand and operational uptick.

Despite these positive signs, the employment index remained in the negative territory at -10.7, continuing a trend observed over the past 14 months. The decline indicates ongoing challenges in the labor market within manufacturing, with firms reporting a higher rate of employment decreases compared to increases. This aspect of the survey underscores a critical area of concern that could affect production capacity and growth prospects if prolonged.

Price Dynamics

Price indexes from the survey indicate sustained pressure on costs. The prices paid index soared to 23.0 in April from 3.7 in March, signaling that input costs remain a significant challenge. This increase is near the long-run average but reflects heightened cost conditions that could squeeze margins if not managed effectively. Concurrently, the prices received index modestly increased, suggesting that firms are somewhat able to pass these costs onto consumers, but not entirely.

Future Outlook

Looking ahead, the survey’s future indicators, although slightly declined, still paint an optimistic picture for the next six months. The future general activity index, despite a drop, shows that a larger proportion of firms anticipate an increase in activity compared to those expecting a decrease. This optimism extends to projections for new orders and shipments, although at a moderated pace.

Interestingly, the future employment index saw an improvement, hinting at potential recovery in hiring intentions. This could be crucial in addressing the current employment declines and supporting anticipated increases in production.

Special Focus: Wages and Compensation

The survey included special questions about changes in wages and compensation. Over the past three months, 31.3% of firms reported increases in these costs, reflecting the broader inflationary pressures affecting the economy. Most firms have not adjusted their 2024 budgets for wages and compensation, indicating a wait-and-see approach in financial planning. However, a notable fraction of firms plan to increase wages more than initially planned, highlighting the competitive pressures to attract and retain talent amid a tight labor market.

Strategic Implications for Businesses

Manufacturing firms should remain vigilant of the ongoing cost pressures and labor market dynamics. Strategic planning should consider potential cost escalations and explore efficiencies in production processes. Additionally, firms must assess their workforce strategies to address the hiring challenges and plan for wage adjustments that align with market conditions and company performance.

Overall, the April 2024 Manufacturing Business Outlook Survey presents a mixed but cautiously optimistic view of the manufacturing sector. While current conditions show improvement, the challenges in employment and rising costs are critical areas that require careful management to sustain growth and competitiveness in the evolving economic landscape.

Source: https://www.philadelphiafed.org/surveys-and-data/regional-economic-analysis/mbos-2024-04


Start futures forex fx news trading with Haawks G4A low latency machine-readable data, one of the fastest machine-readable news trading feeds for US macro-economic and commodity data.

Please let us know your feedback. If you are interested in timestamps, please send us an email to sales@haawks.com.

Comment

Comment

39 pips potential profit in 69 seconds on 15 April 2024, analysis on futures forex fx news trading USDJPY and EURUSD on US Retail Sales data

According to our analysis USDJPY and EURUSD moved 39 pips on US Retail Sales data on 15 April 2024.

USDJPY (28 pips)

EURUSD (11 pips)

Charts are exported from JForex (Dukascopy).


U.S. Retail and Food Services Sales Surge in March 2024: A Sign of Economic Resilience

In a promising turn of events for the U.S. economy, the latest figures released by the U.S. Census Bureau reveal a robust uptick in retail and food services sales for the month of March 2024. The advance estimates, adjusted for seasonal variation and other factors, paint a picture of resilience and growth despite ongoing global uncertainties.

According to the report, U.S. retail and food services sales for March 2024 reached an impressive $709.6 billion, marking a 0.7 percent increase from the previous month. Even more encouraging is the year-over-year comparison, with sales up by 4.0 percent compared to March 2023. This steady growth trajectory suggests a buoyant consumer sentiment and a healthy appetite for spending.

Digging deeper into the numbers, it's evident that various sectors contributed to this positive trend. Retail trade sales, for instance, saw a notable 0.8 percent uptick from February 2024, signaling increased consumer activity across a range of goods and services. Nonstore retailers emerged as a standout performer, boasting an impressive 11.3 percent increase from the previous year. This surge in online shopping underscores the continued shift towards e-commerce platforms and highlights the importance of digital infrastructure in today's retail landscape.

Equally noteworthy is the resilience displayed by food services and drinking places, which saw a commendable 6.5 percent rise from March 2023. Despite challenges posed by the ongoing pandemic and fluctuating consumer preferences, the food and beverage industry has demonstrated remarkable adaptability and innovation, catering to evolving demands and ensuring customer satisfaction.

Moreover, the report provides insight into the broader economic trajectory, with total sales for the January 2024 through March 2024 period showing a 2.1 percent increase compared to the same period a year ago. This sustained growth over multiple months underscores the underlying strength of the U.S. economy and bodes well for future prospects.

It's worth noting the revised figures for the January 2024 to February 2024 percent change, which was adjusted upwards from 0.6 percent to 0.9 percent. This upward revision reflects a more optimistic outlook and reinforces the narrative of steady expansion in consumer spending.

Overall, the latest data on retail and food services sales in March 2024 paints a picture of resilience and optimism in the face of challenges. As the economy continues to recover and adapt to changing dynamics, these figures serve as a testament to the resilience of businesses and the enduring spirit of consumer confidence. With prudent policies and innovative strategies, the U.S. is well-positioned to navigate the road ahead and emerge stronger than ever before.

Source: https://www.census.gov/retail/sales.html


Please let us know your feedback. If you are interested in timestamps, please send us an email to sales@haawks.com.

Start futures forex fx news trading with Haawks G4A low latency machine-readable data today, one of the fastest news data feeds for US macro-economic and commodity data.

Comment

Comment

21 ticks potential profit in 20 seconds on 11 April 2024, analysis on futures forex fx news trading natural gas on DOE Natural Gas Storage Report data

According to our analysis natural gas moved 21 ticks on DOE Natural Gas Storage Report data on 11 April 2024.

Natural gas (21 ticks)

Charts are exported from JForex (Dukascopy).


Understanding the Latest Trends in Natural Gas Storage: Insights from the April 11, 2024 EIA Report

The Energy Information Administration (EIA) has recently released its latest Weekly Natural Gas Storage Report, providing data up to April 5, 2024. This crucial update gives us insights into the state of natural gas storage across the United States, reflecting changes over the past week and comparisons with historical data. Here’s a deep dive into what these numbers mean and their potential implications for the market and consumers.

Current Storage Levels and Weekly Changes

As of April 5, 2024, the total working gas in underground storage in the Lower 48 states stood at 2,283 billion cubic feet (Bcf). This marks a net increase of 24 Bcf from the previous week. Notably, the current storage levels are significantly above last year's figures at this time, which were at 1,848 Bcf, and also surpass the five-year average of 1,650 Bcf. This indicates a robust increase in gas storage, suggesting a stronger storage position relative to previous years.

Regional Analysis

The report details specific changes in various regions:

  • East: A slight decrease of 1 Bcf, totaling 362 Bcf.

  • Midwest: An increase of 2 Bcf, reaching 512 Bcf.

  • Mountain: An increase of 3 Bcf, now at 165 Bcf.

  • Pacific: Also up by 2 Bcf, totaling 229 Bcf.

  • South Central: The largest increase observed here, with 18 Bcf added, now totaling 1,014 Bcf.

Each region shows different trends, but overall, the increases are contributing to a greater national storage capacity, which could influence gas prices and energy policy.

Year-on-Year and Five-Year Comparisons

The comparison with last year and the five-year average gives us an idea of the long-term trends affecting natural gas storage:

  • The total stocks are 23.5% higher than the same time last year.

  • They are also 38.4% above the five-year average.

These significant increases could be due to various factors, including changes in production levels, shifts in energy consumption patterns, or preemptive storage in anticipation of different market conditions.

Implications for Markets and Consumers

With natural gas storage levels being well above average, this could lead to a stabilizing effect on natural gas prices, barring any sudden increases in demand or major geopolitical events. Consumers might benefit from relatively stable or possibly lower energy prices in the near term. However, energy producers might face challenges with lower prices affecting their revenue streams.

Future Outlook

Looking ahead, the next update scheduled for April 18, 2024, will provide further insights into the trends we're observing. Monitoring these trends is crucial for market participants and policymakers to make informed decisions.

In conclusion, the latest EIA report highlights a strong position in natural gas storage compared to previous years. This situation presents both opportunities and challenges in the energy market. As always, it will be important to keep an eye on how these trends evolve in response to economic, environmental, and political factors.

Source: https://ir.eia.gov/ngs/ngs.html


Start futures forex fx commodity news trading with Haawks G4A low latency machine-readable data, one of the fastest data feeds for DOE data.

Please let us know your feedback. If you are interested in timestamps, please send us an email to sales@haawks.com.

Comment

Comment

35 pips potential profit in 18 seconds on 11 April 2024, analysis on futures forex fx low latency news trading USDJPY and EURUSD on US BLS Producer Price Index (PPI) data

According to our analysis USDJPY and EURUSD moved 35 pips on US BLS Producer Price Index (PPI) data on 11 April 2024.

USDJPY (19 pips)

EURUSD (16 pips)

Charts are exported from JForex (Dukascopy).


Unpacking the March 2024 Producer Price Index: A Subtle Shift in Economic Trends

In March 2024, the Producer Price Index (PPI) for final demand demonstrated a modest increase of 0.2 percent, seasonally adjusted, according to the latest report from the U.S. Bureau of Labor Statistics. This subtle uptick follows more significant rises in previous months—0.6 percent in February and 0.4 percent in January. Notably, this marked a slight cooling in the pace of price increases faced by producers in the United States. Here’s a deeper dive into the nuances of the March 2024 PPI report and what these figures could signify for the broader economy.

Overview of March 2024 PPI Increases

Over the past year, the unadjusted final demand index has grown by 2.1 percent, the largest 12-month advance since a 2.3 percent increase recorded in April 2023. This year-on-year growth is primarily driven by a 0.3 percent rise in prices for final demand services, contrasting with a slight decline of 0.1 percent in the index for final demand goods.

Detailed Insights:

  • Services Sector: The increase in services was broad-based, with significant contributions from sectors like securities brokerage, dealing, investment advice, and related services, which surged by 3.1 percent. This was balanced by a notable decline in traveler accommodation services, which dropped by 3.8 percent.

  • Goods Sector: The decline in goods was led by a 1.6 percent decrease in final demand energy prices, emphasizing the volatile nature of this category. On a positive note, prices for final demand foods rose by 0.8 percent, showing some sectors still face upward pricing pressures.

Core Inflation Measures

Stripping out the often volatile prices of food, energy, and trade services, the core PPI (final demand less foods, energy, and trade services) moved up by 0.2 percent in March, mirroring the general trend of modest inflation in more stable categories. This core measure has risen by 2.8 percent over the past 12 months, indicating a relatively steady inflationary environment in the core sectors of the economy.

Intermediate Demand Dynamics

The report also sheds light on intermediate demand, which tracks prices for goods, services, and construction products sold for resale, export, or as inputs to other products. In March, prices for processed goods for intermediate demand fell by 0.5 percent, largely due to a 1.5 percent drop in processed energy goods. This reflects broader declines in energy costs that could influence future final demand prices.

Conversely, prices for services for intermediate demand ticked up by 0.2 percent, supported by increases in sectors such as investment banking and metals wholesaling. These increases are important indicators of cost pressures within the service sector that could trickle down to consumer prices.

Implications for Business and Policy

For businesses, the fluctuating PPI indicates a mixed bag of cost pressures that could affect profit margins and pricing strategies. The rise in services costs, particularly in financial services, might lead to higher operational expenses, whereas the drop in goods prices, especially energy, could provide some relief.

From a policy perspective, the Federal Reserve and other policymakers will likely scrutinize these figures to assess inflationary trends and adjust monetary policy accordingly. The core PPI's steady rise suggests that underlying inflation pressures remain manageable, which could influence interest rate decisions in upcoming meetings.

Conclusion

The March 2024 PPI report highlights a complex economic landscape with divergent trends in goods and services. As we move further into 2024, businesses and policymakers must remain vigilant and adaptable to these evolving economic indicators. By understanding these trends, stakeholders can better navigate the uncertainties and opportunities that lie ahead in the dynamic U.S. economy.

Source: https://www.bls.gov/news.release/ppi.nr0.htm


Start futures forex fx news trading with Haawks G4A low latency machine-readable data, one of the fastest machine-readable news trading feed for US economic and commodity data.

Please let us know your feedback. If you are interested in timestamps, please send us an email to sales@haawks.com.
Comment

Comment

38 ticks potential profit in 3 seconds on 10 April 2024, analysis on futures forex fx low latency news trading crude oil on DOE Petroleum Status Report data

According to our analysis crude oil moved 38 ticks on DOE Petroleum Status Report data on 10 April 2024.

Light sweet crude oil (19 ticks)

Brent crude oil (19 ticks)

Charts are exported from JForex (Dukascopy).


Analyzing the Latest Trends in the U.S. Petroleum Status for Early April 2024

The U.S. Energy Information Administration's Weekly Petroleum Status Report for the week ending April 5, 2024, provides critical insights into the country's petroleum industry, reflecting changes in refinery operations, stock levels, imports, and pricing that signify broader economic and operational trends. This analysis deciphers the key highlights and their potential implications for the market and consumers.

Refinery Inputs and Operations

U.S. crude oil refinery inputs averaged 15.8 million barrels per day, a slight decline from the previous week, indicating a minor adjustment in refining activity. This corresponds with refineries operating at 88.3% of their operable capacity, a marginal increase from the week before, yet noteworthy for understanding the refining sector's response to market demand.

Production and Stock Levels

The report highlights a decrease in gasoline production, now averaging 9.4 million barrels per day, and an increase in distillate fuel production, averaging 4.6 million barrels per day. This shift suggests a nuanced balancing act by refineries to meet the diverse demands of the market, where gasoline sees a slight pullback, and distillate fuels, crucial for industrial and heating purposes, see an uptick.

U.S. commercial crude oil inventories experienced a notable increase of 5.8 million barrels, suggesting a temporary oversupply or decreased demand. This adjustment brings inventories slightly below the five-year average for this time of year, indicating a relatively stable stock level amidst fluctuating market dynamics.

Imports and Product Supplied

A dip in crude oil imports to an average of 6.4 million barrels per day reflects the global interplay of supply chains affecting U.S. oil stocks. The decrease in total motor gasoline imports and a marginal rise in distillate fuel imports further underscore the shifting landscape of domestic consumption versus import reliance.

The four-week average of products supplied to the market slightly decreased, indicating a minor reduction in overall petroleum product demand compared to the same period last year. This subtle shift could signal changes in consumer behavior or broader economic trends influencing energy consumption.

Pricing Dynamics

Crude oil and petroleum product prices offer a lens into the market's supply and demand balance. West Texas Intermediate crude oil saw a price increase to $87.69 per barrel, reflecting tighter supply or increased demand conditions. Similarly, the rise in the spot prices for gasoline and heating oil in New York Harbor points to regional demand pressures or supply constraints.

The national average retail prices for gasoline and diesel fuel, both showing moderate changes from the previous week, paint a picture of the retail fuel market's response to upstream price movements and demand factors.

Conclusion

The early April 2024 snapshot of the U.S. petroleum status delineates a complex interplay of refinery operations, stock adjustments, imports, and price movements. These indicators not only reflect the current state of the petroleum sector but also offer insights into potential economic, environmental, and consumer trends. As the market continues to adapt to varying demand levels and supply chain challenges, stakeholders across the spectrum will be watching closely to navigate the volatile energy landscape effectively.

Source: https://www.eia.gov/petroleum/supply/weekly/pdf/highlights.pdf


Start futures forex fx crude oil news trading with Haawks G4A low latency machine-readable data, one of the fastest data feeds for DOE Petroleum Status Report data.

Please let us know your feedback. If you are interested in timestamps, please send us an email to sales@haawks.com.

Comment

Comment

57 pips potential profit in 46 seconds on 10 April 2024, analysis on futures forex fx low latency news trading USDJPY and EURUSD on US BLS CPI (Consumer Price Index) data

According to our analysis USDJPY and EURUSD moved 57 pips on US BLS CPI (Consumer Price Index) data on 10 April 2024.

USDJPY (25 pips)

EURUSD (32 pips)

Charts are exported from JForex (Dukascopy).


March 2024 Consumer Price Index Summary

The latest report from the U.S. Bureau of Labor Statistics on the Consumer Price Index (CPI) for March 2024 sheds light on current economic conditions, indicating both continuity and change in the inflation landscape. As consumers and analysts alike scrutinize these figures, it's crucial to unpack the nuances of the data to understand its implications for the economy, businesses, and everyday Americans.

CPI Overview for March 2024

In March 2024, the CPI for All Urban Consumers (CPI-U) experienced a 0.4 percent increase on a seasonally adjusted basis, mirroring the rise observed in February. Looking at the bigger picture, the all items index escalated by 3.5 percent over the last 12 months before seasonal adjustment, marking a notable trend in inflationary pressures.

The primary drivers of the monthly inflation increase were the shelter and gasoline indexes, which collectively contributed to more than half of the overall rise in the index for all items. Specifically, the energy index saw a 1.1 percent uplift, while food prices edged up by 0.1 percent. Notably, the food at home index remained stagnant, but the food away from home index climbed by 0.3 percent.

Key Components and Sectoral Impacts

  • Shelter and Energy: The shelter index continued its upward trajectory, alongside a significant 1.1 percent increase in the energy index. Gasoline prices, in particular, rose by 1.7 percent, reflecting broader energy market trends.

  • Food Index: The marginal 0.1 percent rise in the food index, coupled with a stable food at home index, suggests moderate food price inflation. However, the food away from home index's 0.3 percent increase points to costlier dining out experiences.

  • Core Inflation: Excluding food and energy, the core CPI rose by 0.4 percent for the third consecutive month. This consistent growth in core inflation underscores persistent inflationary pressures beyond volatile food and energy prices.

Yearly Inflation Trends

The 12-month overview reveals a 3.5 percent rise in the all items index, accelerating from the 3.2 percent increase ending February. Core inflation, excluding food and energy, climbed by 3.8 percent over the past year, indicating sustained inflationary pressure. Energy and food indexes rose by 2.1 percent and 2.2 percent, respectively, highlighting varied inflation dynamics across sectors.

Looking Ahead

The CPI data for March 2024 illustrates ongoing inflationary pressures within the U.S. economy, with significant contributions from shelter, energy, and certain food categories. While some sectors like used cars and trucks saw price decreases, the general trend indicates that inflation remains a concern.

For consumers, this means budgeting for higher costs in housing, energy, and dining out. Businesses, particularly in the energy, food service, and insurance sectors, will need to navigate these inflationary pressures carefully, balancing cost increases with consumer affordability.

As we move forward, monitoring these trends will be crucial for policymakers, businesses, and consumers alike to make informed decisions in an evolving economic landscape. The next CPI report, scheduled for release in May 2024, will be eagerly anticipated for further insights into inflationary trends and their potential implications.

Source: https://www.bls.gov/news.release/cpi.nr0.htm


Start futures forex fx news trading with Haawks G4A low latency machine-readable data, one of the fastest machine-readable news trading feed for US economic and commodity data.

Please let us know your feedback. If you are interested in timestamps, please send us an email to sales@haawks.com.

Comment

Comment

46 pips potential profit in 132 seconds on 5 April 2024, analysis on futures forex fx news trading USDCAD on Canada Labour Force Survey data

According to our analysis USDCAD moved 46 pips on Canada Labour Force Survey data on 5 April 2024.

USDCAD (46 pips)

Charts are exported from JForex (Dukascopy).


Canada's Labour Force Survey: An Overview of March 2024

Canada's latest Labour Force Survey for March 2024 presents a mixed bag of results, reflecting the dynamic and fluctuating nature of the country's economy. Released on April 5th, 2024, the survey offers a comprehensive look at employment trends, unemployment rates, industry shifts, and regional differences across Canada. Here, we delve into the key findings and what they signify for Canadians.

Employment Rates: A Steady Scene with Minor Adjustments

The headline figure from the survey is the minimal change in employment for March 2024, with a slight decrease of 2,200 jobs, marking a -0.0% change. This stability follows a modest increase in February (+41,000) and January (+37,000), suggesting a period of relative steadiness in the job market. However, it's notable that the employment rate has seen a slight decline for the sixth consecutive month, falling by 0.1 percentage points to 61.4%.

Unemployment on the Rise

A more concerning trend is the uptick in the unemployment rate, which rose by 0.3 percentage points to 6.1% in March. This increase adds to a year-over-year rise of 1.0 percentage points, indicating a growing number of Canadians are finding themselves out of work. Particularly striking is the unemployment rate among youth aged 15 to 24, which increased by 1.0 percentage points in just a month to 12.6%, and by 3.1 percentage points from March 2023.

Sectoral and Demographic Disparities

The survey highlights significant differences in employment changes across various demographics and industries. Youth employment continued to decline, falling by 28,000 (-1.0%), while core-aged men saw an increase of 20,000 (+0.3%). The decline in youth employment is a concerning trend that has seen virtually no net employment growth for this group since December 2022.

Industries such as accommodation and food services, wholesale and retail trade, and professional, scientific and technical services saw employment decreases, while health care and social assistance led with an increase of 40,000 (+1.5%). These sectoral shifts reflect broader economic changes and areas of growth and contraction within the Canadian economy.

Regional Variations

The survey also sheds light on regional disparities, with employment decreasing in Quebec, Saskatchewan, and Manitoba, while Ontario experienced an increase. This variation underscores the diverse economic conditions across the country and the impact of regional industries and policies on employment rates.

Looking Ahead

The March 2024 Labour Force Survey paints a picture of a Canadian economy experiencing slow movement in its labor market, with notable disparities across different sectors and regions. The rise in unemployment, particularly among the youth, poses a significant challenge, highlighting the need for targeted interventions and policies to support job creation and skill development in affected sectors and demographics.

As Canada navigates these complex labor market dynamics, the insights from the Labour Force Survey will be crucial for policymakers, businesses, and individuals alike in making informed decisions and adapting to the changing economic landscape.

Source: https://www150.statcan.gc.ca/n1/daily-quotidien/240405/dq240405a-eng.htm


Start futures forex fx news trading with Haawks G4A low latency machine-readable data today, one of the fastest news data feeds for US macro-economic and commodity data.

Please let us know your feedback. If you are interested in timestamps, please send us an email to sales@haawks.com.

Comment

Comment

10 ticks potential profit in 22 seconds on 4 April 2024, analysis on futures forex fx news trading natural gas on DOE Natural Gas Storage Report data

According to our analysis natural gas moved 10 ticks on DOE Natural Gas Storage Report data on 4 April 2024.

Natural gas (10 ticks)

Charts are exported from JForex (Dukascopy).


Analyzing the Latest Shifts in U.S. Natural Gas Storage: A Deep Dive into the Week Ending March 29, 2024

The U.S. Energy Information Administration (EIA) recently unveiled its Weekly Natural Gas Storage Report for the week ending March 29, 2024. This critical snapshot offers invaluable insights into the country's natural gas supply, showcasing a dynamic interplay between demand, storage capacity, and market trends. Here, we delve into the nuances of the latest report, comparing it against historical data to gauge its broader implications on the energy sector and beyond.

Key Highlights from the Latest Report

As of March 29, 2024, working gas in underground storage across the Lower 48 states stood at 2,259 billion cubic feet (Bcf), marking a net decrease of 37 Bcf from the previous week. This shift underscores a significant fluctuation in gas supplies, potentially influencing market dynamics and energy pricing in the short term. Notably, the current storage levels are substantially higher than the previous year's figures and the five-year average, suggesting a robust supply that could stabilize prices and supply chains.

  • Year-over-Year Increase: Stocks were 422 Bcf higher than the same period last year, presenting a considerable 23% increase.

  • Five-Year Average Comparison: When measured against the five-year average of 1,626 Bcf, the current storage levels are 633 Bcf above, reflecting a substantial 38.9% increase.

Regional Breakdown: A Closer Look

The report details specific trends across various regions, each with its unique dynamics and implications:

  • East and Midwest: Both regions saw a net decrease in storage levels, with the East experiencing a 24 Bcf reduction and the Midwest a 18 Bcf drop. Despite these decreases, both areas are still well above their previous year and five-year averages, indicating strong reserves.

  • Mountain and Pacific: The Mountain region reported a modest 4 Bcf decrease, whereas the Pacific region bucked the trend with a 4 Bcf increase. These changes are particularly striking in the context of their year-over-year and five-year average comparisons, showcasing significant variances in regional supply dynamics.

  • South Central: This region, which includes both salt and nonsalt storage facilities, reported a net increase of 5 Bcf, further bolstering its already substantial reserves.

Implications and Insights

The current state of natural gas storage in the U.S. paints a picture of strength and resilience. With storage levels comfortably above the previous year and the five-year average, the immediate outlook for natural gas supplies seems secure. This abundance is likely to have several key implications:

  • Market Stability: Higher storage levels typically translate to more stable natural gas prices, benefiting consumers and industries alike.

  • Energy Security: Robust storage figures contribute to the nation's energy security, ensuring a steady supply to meet domestic demand.

  • Policy and Planning: These trends are vital for policymakers and energy companies as they strategize for the future, balancing environmental concerns with energy needs.

Looking Ahead

As the energy landscape continues to evolve, monitoring natural gas storage levels remains critical for understanding broader market trends and preparing for future challenges. The EIA's next release on April 11, 2024, is eagerly awaited for further insights into these trends. With the energy sector at a crossroads, influenced by both geopolitical events and the push towards sustainability, the significance of such data cannot be overstated.

In conclusion, the latest Weekly Natural Gas Storage Report offers a glimpse into the complex dynamics shaping the U.S. energy sector. By providing a detailed analysis of current storage levels and historical comparisons, this report is an indispensable tool for anyone looking to navigate the intricacies of the energy market.

Source: https://ir.eia.gov/ngs/ngs.html


Start futures forex fx commodity news trading with Haawks G4A low latency machine-readable data, one of the fastest data feeds for DOE data.

Please let us know your feedback. If you are interested in timestamps, please send us an email to sales@haawks.com.

Comment

Comment

12 pips potential profit in 15 seconds on 21 March 2024, analysis on futures forex fx low latency news trading USDJPY and EURUSD on US Jobless Claims and US Philadelphia Fed Manufacturing data

According to our analysis USDJPY and EURUSD moved 12 pips on US Jobless Claims and US Philadelphia Federal Reserve Bank Manufacturing Business Outlook Survey data on 21 March 2024.

USDJPY (9 pips)

EURUSD (3 pips)

Charts are exported from JForex (Dukascopy).


Unpacking the March 2024 Manufacturing Business Outlook Survey Insights

The latest Manufacturing Business Outlook Survey, with responses gathered between March 11 and March 18, 2024, offers a nuanced view of the manufacturing sector's current health and its prospects. The survey, a bellwether for manufacturing trends, presents a mix of cautious optimism and areas of concern, reflecting the complex dynamics influencing the sector. Let’s delve into the key takeaways and what they mean for the industry moving forward.

Modest Growth Amidst Challenges

The survey underscores a continued expansion in manufacturing activity, albeit at a pace that suggests caution among industry players. The general activity index, a key measure of manufacturing health, recorded a slight dip to 3.2 in March, marking its second consecutive positive reading but highlighting a tempered outlook among firms. This modest growth is further evidenced by the positive turn in new orders, with the index rising to 5.4, and a slight uptick in shipments.

However, not all indicators are positive. The employment index remained in negative territory at -9.6, suggesting ongoing challenges in workforce dynamics. Moreover, both price indexes for inputs and outputs have decreased, remaining below long-run averages, pointing to a complex pricing environment faced by manufacturers.

Current Indicators and Future Outlook

While current indicators reflect a mixed bag of modest growth and persisting challenges, the future outlook provides a brighter picture. The future general activity index leapt to 38.6, the highest since July 2021, indicating stronger expectations for growth in the coming months. This optimism is echoed in the significant increases in future new orders and shipments indexes, suggesting that firms are anticipating a rebound in demand.

Furthermore, the survey’s special questions reveal insights into production growth and capacity utilization, with a higher share of firms reporting an increase in production for the first quarter of 2024 compared to the last quarter of 2023. The median current capacity utilization rate remains stable, with most firms indicating slight to moderate constraints from labor supply but less concern from supply chains.

Implications for the Manufacturing Sector

The March 2024 survey paints a picture of a manufacturing sector at a crossroads. On one hand, the continued expansion and optimistic future expectations reflect the resilience and potential for growth within the industry. On the other, the challenges in employment and price pressures underscore the ongoing adjustments firms must navigate in a post-pandemic world.

For industry leaders, the key takeaway is the importance of strategic planning and flexibility. Investing in workforce development and technology can help mitigate employment challenges, while agile pricing strategies may address the volatile cost environment. Moreover, the positive future outlook suggests that firms should prepare for increased demand, making this an opportune time to review and enhance production capabilities.

Looking Ahead

As the manufacturing sector continues to navigate through a landscape marked by both opportunities and challenges, the insights from the March 2024 Manufacturing Business Outlook Survey offer valuable guidance. By understanding the current trends and future expectations, manufacturers can better position themselves for growth, adapting to the evolving market dynamics with resilience and strategic foresight.

Source: https://www.philadelphiafed.org/surveys-and-data/regional-economic-analysis/mbos-2024-03


Start futures forex fx news trading with Haawks G4A low latency machine-readable data, one of the fastest machine-readable news trading feeds for US economic and commodity data.

Please let us know your feedback. If you are interested in timestamps, please send us an email to sales@haawks.com.

Comment

Comment

1186 pips potential profit in 68 seconds on 21 March 2024, analysis on forex fx news trading USDTRY first on Turkey interest rate decision data

According to our analysis USDTRY moved 1186 pips on Turkey interest rate decision (TCMB) data on 21 March 2024.

USDTRY (1186 pips)

Charts are exported from JForex (Dukascopy).


Understanding the Recent Move: A Dive into the Monetary Policy Committee's Decision to Hike Interest Rates

On March 21, 2024, the Monetary Policy Committee (MPC), under the leadership of Governor Yaşar Fatih Karahan and members Osman Cevdet Akçay, Elif Haykır Hobikoğlu, Hatice Karahan, and Fatma Özkul, made a pivotal decision in the realm of Turkey's economic policy. In a move aimed at curbing the inflationary pressures that have beleaguered the economy, the Committee announced an increase in the policy rate, specifically the one-week repo auction rate, from 45 percent to an assertive 50 percent. This significant rate hike is a clear signal of the central bank's intention to tighten monetary conditions in response to the deteriorating inflation outlook.

The Reason Behind the Hike

February saw an unexpected spike in monthly inflation, primarily driven by services inflation. Despite a slowdown in the imports of consumption goods and gold, which positively contributed to the current account balance, indicators suggest that domestic demand continues to be robust. The MPC has highlighted several factors that keep inflationary pressures alive: stickiness in services inflation, inflation expectations, geopolitical risks, and food prices.

In an effort to counteract these pressures, the Committee has also decided to adjust the monetary policy operational framework. This adjustment includes setting the Central Bank overnight borrowing and lending rates 300 basis points below and above the one-week repo auction rate, respectively. This strategy is aimed at ensuring the effectiveness of the monetary policy transmission mechanism.

The Strategy Moving Forward

The MPC's decision to raise the policy rate underscores a broader strategy to maintain a tight monetary stance until there is a significant and sustained decline in the underlying trend of monthly inflation. The Committee has also expressed its readiness to tighten the monetary policy stance further if inflation deteriorates significantly and persistently.

The central bank's determination to maintain a tight monetary stance is expected to moderate domestic demand, lead to a real appreciation in the Turkish lira, and improve inflation expectations. These measures, in turn, are projected to contribute to a decrease in the underlying trend of monthly inflation, establishing a path toward disinflation in the second half of 2024.

Macroprudential Policies and Future Outlook

Alongside monetary tightening, the Committee continues to implement macroprudential policies to preserve market mechanism functionality and macrofinancial stability. These include tightening financial conditions and reinforcing monetary policy transmission with measures taken in March. The MPC emphasizes the importance of monitoring market liquidity closely and effectively using sterilization tools as needed.

Looking ahead, the Committee will consider the lagged effects of monetary tightening in its policy decisions, aiming to create the monetary and financial conditions necessary for a decline in the underlying trend of inflation. The ultimate goal is to achieve the 5 percent inflation target in the medium term.

The MPC's decision-making process will remain predictable, data-driven, and transparent. The summary of the Monetary Policy Committee Meeting will be released within five working days, providing further insights into the Committee's analysis and expectations.

Conclusion

The recent decision by the Monetary Policy Committee to increase interest rates marks a critical step in Turkey's fight against inflation. By taking a decisive and transparent approach, the Committee aims to stabilize prices and lay the groundwork for sustainable economic growth. As the situation evolves, the central bank's actions will be closely monitored by investors, policymakers, and the public, who are eager to see the return of price stability and economic prosperity.

Source: https://tcmb.gov.tr/wps/wcm/connect/62a341a9-b793-4ba8-9582-7b10dc2c9331/ANO2024-14.pdf?MOD=AJPERES&CACHEID=ROOTWORKSPACE-62a341a9-b793-4ba8-9582-7b10dc2c9331-oVwGLDx


Start forex fx news trading with Haawks G4A low latency machine-readable data today, one of the fastest news data feeds for US and European economic and commodity data.

Please let us know your feedback. If you are interested in timestamps, please send us an email to sales@haawks.com.

Comment