Viewing entries in
Forex News Trading

Comment

17 ticks potential profit in 7 seconds on 29 January 2026, analysis on futures news trading natural gas on DOE Natural Gas Storage Report (WNGSR) data

According to our analysis natural gas moved 17 ticks on DOE Natural Gas Storage Report (WNGSR) data on 29 January 2026.

391 pips potential performance in 2026 (2025: 1,828)

Natural gas (17 ticks)

Charts are exported from JForex (Dukascopy).


Natural Gas Storage Update: A Big Winter Draw, But Still Comfortable

The latest Weekly Natural Gas Storage Report from the U.S. Energy Information Administration (EIA) delivers a headline-grabbing number: a 242 billion cubic feet (Bcf) withdrawal for the week ending January 23, 2026. That’s a hefty pull from storage—but zooming out, the U.S. gas market remains in a relatively solid position for late January.

Let’s break down what’s happening and why it matters.

The Big Picture: Where Storage Stands

As of January 23, working gas in underground storage totaled 2,823 Bcf across the Lower 48 states. That’s:

  • 206 Bcf higher than this time last year

  • 143 Bcf above the five-year average of 2,680 Bcf

  • Within the historical five-year range, despite the large weekly draw

In short: winter demand is clearly doing its thing, but inventories are still comfortably padded.

Regional Breakdown: Who Pulled the Most?

Every region saw withdrawals last week, with cold-driven demand leaving a visible mark.

South Central Leads the Way

  • −89 Bcf on the week

  • Total storage now at 1,050 Bcf

  • Still 14.1% above last year and 8.6% above the five-year average

Salt caverns accounted for a sizable portion of the draw, which is typical during periods of high, short-term demand.

Midwest Feels the Chill

  • −76 Bcf weekly change

  • Storage sits at 676 Bcf

  • Nearly flat versus last year, but 6.4% below the five-year average

This suggests the Midwest is leaning more heavily on storage relative to recent norms.

East Region Stays Balanced

  • −55 Bcf withdrawal

  • Ending the week at 577 Bcf

  • Slightly above last year, slightly below the five-year average

West Holds Strong

  • Mountain: −14 Bcf, but a striking 34% above the five-year average

  • Pacific: −9 Bcf, nearly 33% above the five-year average

The West continues to stand out for its strong inventory cushion.

A Large Draw—But Not a Red Flag

A 242 Bcf withdrawal is significant, especially compared with milder winters in recent years. Still, context matters:

  • Storage levels remain well above normal

  • Sampling variability is low (total coefficient of variation just 0.4%)

  • There’s no immediate signal of supply stress

Unless colder-than-normal weather persists deep into February or production falters, the market appears well-positioned to ride out the remainder of winter.

What to Watch Next

Looking ahead to the next EIA release on February 5, key questions include:

  • Will withdrawals stay this large, or ease with moderating temperatures?

  • Can storage remain above the five-year average through peak winter demand?

  • How will regional imbalances—especially in the Midwest—evolve?

For now, the takeaway is clear: winter is biting, but storage is holding up.

Stay tuned—February is often where the real storage story gets written.

Disclaimer: This blog post is for informational purposes only and should not be construed as financial advice. Always conduct thorough research and consider seeking advice from a financial professional before making any investment decisions.

Source: https://ir.eia.gov/ngs/ngs.html


Start futures forex fx commodity news trading with Haawks G4A low latency machine-readable data, one of the fastest data feeds for DOE data.

Please let us know your feedback. If you are interested in timestamps, please send us an email to sales@haawks.com.

Comment

Comment

103 ticks potential profit in 7 seconds on 22 January 2026, analysis on futures news trading natural gas on DOE Natural Gas Storage Report (WNGSR) data

According to our analysis natural gas moved 103 ticks on DOE Natural Gas Storage Report (WNGSR) data on 22 January 2026.

374 pips potential performance in 2026 (2025: 1,828)

Natural gas (103 ticks)

Charts are exported from JForex (Dukascopy).


U.S. Natural Gas Storage Remains Well Above Normal Despite Large Weekly Draw

U.S. natural gas inventories posted a significant weekly draw in mid-January, yet overall storage levels remain comfortably above historical norms—a key signal for winter market dynamics.

According to the latest Weekly Natural Gas Storage Report from the U.S. Energy Information Administration, working gas in underground storage across the Lower 48 states totaled 3,065 billion cubic feet (Bcf) for the week ending January 16, 2026.

That figure represents a net withdrawal of 120 Bcf from the prior week, reflecting stronger winter demand. Even so, inventories remain 141 Bcf higher than the same week last year and 177 Bcf above the five-year average, underscoring a well-supplied market.

Regional Breakdown: Broad-Based Withdrawals

Every major storage region reported declines during the week, with the largest draws concentrated in traditional heating-demand centers:

  • South Central: −39 Bcf

  • Midwest: −38 Bcf

  • East: −32 Bcf

  • Mountain: −9 Bcf

  • Pacific: −2 Bcf

Within the South Central region, salt cavern storage fell by 12 Bcf, while nonsalt facilities declined by 27 Bcf—both consistent with seasonal withdrawal patterns.

Still Above Normal Across Most Regions

Despite the sizable draw, inventories remain above both year-ago and five-year average levels in nearly every region:

  • Total U.S. storage: +4.8% vs. last year, +6.1% vs. five-year average

  • Mountain region: +34.4% vs. five-year average

  • Pacific region: +31.6% vs. five-year average

  • South Central: nearly 9% above historical norms

At 3,065 Bcf, total working gas remains above the five-year historical range, providing a cushion against late-season cold weather risks.

What This Means for the Market

The data tells a clear story:

  • Demand is real—winter withdrawals are accelerating

  • Supply is ample—storage remains elevated

  • Price pressure may stay muted unless colder-than-normal weather persists

For traders and analysts, the combination of strong draws and high absolute storage levels suggests a market that is responding to seasonal demand without signaling structural tightness.

As winter progresses, attention will shift to weather forecasts, withdrawal pace, and whether inventories begin converging toward historical averages—or continue to defy them.

Disclaimer: This blog post is for informational purposes only and should not be construed as financial advice. Always conduct thorough research and consider seeking advice from a financial professional before making any investment decisions.

Source: https://ir.eia.gov/ngs/ngs.html


Start futures forex fx commodity news trading with Haawks G4A low latency machine-readable data, one of the fastest data feeds for DOE data.

Please let us know your feedback. If you are interested in timestamps, please send us an email to sales@haawks.com.

Comment

Comment

66 ticks potential profit in 67 seconds on 15 January 2026, analysis on futures news trading natural gas on DOE Natural Gas Storage Report data

According to our analysis natural gas moved 66 ticks on DOE Natural Gas Storage Report data on 15 January 2026.

271 pips potential performance in 2026 (2025: 1,828)

Natural gas (66 ticks)

Charts are exported from JForex (Dukascopy).


U.S. Natural Gas Storage Update: A Comfortable Cushion Heading Into Mid-January

The latest Weekly Natural Gas Storage Report from the U.S. Energy Information Administration (EIA) shows that U.S. natural gas inventories remain solidly above normal as the winter heating season continues.

As of Friday, January 9, 2026, working gas in underground storage across the Lower 48 states totaled 3,185 billion cubic feet (Bcf). That represents a weekly withdrawal of 71 Bcf, in line with typical winter demand but notably less aggressive than what might be expected during periods of severe cold.

Big Picture: Above Average and Within Range

Despite the weekly draw, storage levels continue to offer a strong buffer:

  • 33 Bcf higher than this time last year

  • 106 Bcf above the five-year average of 3,079 Bcf

  • Firmly within the historical five-year range

This positioning suggests that, nationally, the market remains well supplied, reducing the risk of near-term shortages even if colder weather emerges later in the season.

Regional Breakdown: Where the Gas Moved

Most regions saw withdrawals during the week, reflecting seasonal heating demand:

  • East:
    Stocks fell by 33 Bcf, leaving inventories 2.2% below last year and 5.8% below the five-year average—a sign of tighter conditions in the region most sensitive to winter heating loads.

  • Midwest:
    A 31 Bcf draw pushed inventories 3.4% below last year and 6.2% under the five-year norm, continuing a trend of stronger winter usage.

  • Mountain & Pacific:
    Smaller declines of 5 Bcf and 2 Bcf, respectively. Both regions remain well above historical averages, with the Mountain region more than 30% above its five-year average.

  • South Central:
    Notably, no net change week over week. Salt storage increased by 12 Bcf, while nonsalt facilities declined by the same amount—keeping total inventories steady and comfortably above both last year and the five-year average.

What This Means for the Market

The data paints a picture of a well-balanced natural gas market:

  • Storage remains ample despite winter withdrawals

  • Regional tightness exists, particularly in the East and Midwest

  • Producing and storage hubs in the South Central region continue to provide stability

Unless prolonged extreme cold materializes, inventories appear sufficient to carry the market through the remainder of winter without major stress.

Looking Ahead

The next EIA storage report will be released on January 22, 2026. With winter far from over, traders and consumers alike will be watching whether withdrawals accelerate—or if above-average storage continues to keep prices and supply risks in check.

For now, the message is clear: the U.S. entered mid-January with a healthy natural gas safety net.

Disclaimer: This blog post is for informational purposes only and should not be construed as financial advice. Always conduct thorough research and consider seeking advice from a financial professional before making any investment decisions.

Source: https://ir.eia.gov/ngs/ngs.html


Start futures forex fx commodity news trading with Haawks G4A low latency machine-readable data, one of the fastest data feeds for DOE data.

Please let us know your feedback. If you are interested in timestamps, please send us an email to sales@haawks.com.

Comment

Comment

5 pips, US500 13 points, BTC 177 points potential profit in 62 seconds on 13 January 2026, analysis on futures forex fx low latency news trading EURUSD, US500 and BTC on US CPI

According to our analysis EURUSD moved 5 pips, US500 moved 13 points and BTC moved 177 points on US BLS Consumer Price Index (CPI) data on 13 January 2026.

205 pips potential performance in 2026 (2025: 1,828)

EURUSD (5 pips)

US500 (13 points)

BTC (177 points)

Charts are exported from JForex (Dukascopy).


Inflation Ends 2025 Steady: What the December CPI Report Tells Us

The latest Consumer Price Index (CPI) report from the U.S. Bureau of Labor Statistics offers a clear snapshot of how inflation wrapped up 2025—and what it means for households heading into the new year.

Released on January 13, 2026, the report shows that inflation remains moderate but persistent, with price pressures still concentrated in essentials like housing, food, and certain services.

Headline Numbers at a Glance

  • Monthly CPI (December 2025): +0.3% (seasonally adjusted)

  • 12-month inflation rate: 2.7%, unchanged from November

  • Core inflation (excluding food & energy): 2.6% year over year

These figures suggest inflation is no longer accelerating, but it also hasn’t fully cooled back to pre-pandemic norms.

Housing: Still the Biggest Driver

Shelter costs were once again the largest contributor to December’s increase:

  • Shelter index: +0.4% in December

  • 12-month shelter inflation: +3.2%

Rent and owners’ equivalent rent both rose, while lodging away from home jumped sharply (+2.9% for the month). Housing remains the stickiest part of inflation—and the hardest for consumers to avoid.

Food Prices Pick Up Speed

Food prices rose faster than overall inflation in December:

  • Food (overall): +0.7% in December

  • Food at home: +2.4% year over year

  • Food away from home: +4.1% year over year

Notable details:

  • Grocery staples like dairy, cereals, fruits, and vegetables all increased.

  • Egg prices fell sharply (-8.2%), offering rare relief.

  • Restaurant prices continue to climb, especially for full-service meals.

For many households, food remains one of the most noticeable inflation pressures.

Energy: Mixed Signals

Energy prices edged higher overall, but the details matter:

  • Energy index: +0.3% in December, +2.3% over the year

  • Gasoline: -0.5% in December, -3.4% year over year

  • Electricity: +6.7% year over year

  • Natural gas: +10.8% year over year

Drivers benefited from cheaper gasoline, but utility bills—especially heating—continued to rise.

Services Inflation Remains Firm

Core services showed broad-based increases:

  • Medical care: +0.4% in December, +3.2% year over year

  • Recreation: +1.2% in December (largest monthly jump on record)

  • Airline fares: +5.2% in December

  • Personal care & education: continued steady increases

On the flip side:

  • Used cars and trucks: -1.1% in December

  • Communication services: -1.9%

What This Means for 2026

As 2025 closed:

  • Inflation appears stable, not surging—but not fully subdued.

  • Housing and services remain the key inflation risks.

  • Goods inflation (like vehicles and gasoline) continues to ease.

With the January 2026 CPI report scheduled for February 11, 2026, policymakers and consumers alike will be watching closely to see whether inflation finally drifts closer to the Federal Reserve’s long-term comfort zone.

Bottom Line

Inflation ended 2025 steady but uneven. While energy and goods offered some relief, everyday essentials—housing, food, and services—kept upward pressure on household budgets. The battle against inflation isn’t over, but it’s no longer spiraling out of control either.

Disclaimer: This blog post is for informational purposes only and should not be construed as financial advice. Always conduct thorough research and consider seeking advice from a financial professional before making any investment decisions.

Source: https://www.bls.gov/news.release/cpi.nr0.htm


Start futures forex fx news trading with Haawks G4A low latency machine-readable data, one of the fastest machine-readable news trading feed for US macro-economic and commodity data.

Please let us know your feedback. If you are interested in timestamps, please send us an email to sales@haawks.com.

Comment

Comment

12 pips, US500 6 points, BTC 678 points potential profit in 43 seconds on 18 December 2025, analysis on futures forex fx news trading EURUSD, US500 and BTC on US CPI and US Jobless Claims data

According to our analysis EURUSD moved 12 pips and US500 moved 6 points and BTC 678 points on US CPI and US Jobless Claims data on 18 December 2025.

1828 pips potential performance in 2025 (2024: 4,305)

EURUSD (12 points)

US500 (6 points)

BTC (678 points)

Charts are exported from JForex (Dukascopy).


Unemployment Claims, CPI, and the Macro Signal Going into 2026
A more technical read on the December 18, 2025 UI & CPI releases

The December 18, 2025 data dump gives us a fairly coherent macro picture:

  • Labor market: still tight by historical standards, with some sectoral and regional softening but no broad deterioration.

  • Inflation: headline and core running in the high-2% range, drifting down from 3%, with housing and services still doing most of the work on the “sticky” side.

Below is a more policy-wonk breakdown of what these releases are actually saying.

1. Labor Market: Claims Still at “Expansion” Levels

1.1 Initial claims: well within “normal” range

  • Initial claims (SA), week ending Dec 13:

    • 224k (-13k w/w from a revised 237k).

    • 4-week moving average: 217.5k (+0.5k).

In a labor force north of 165–170 million, claims in the low 200k range are typically associated with continuing expansion, not recession onset. This is consistent with past cycles where recessionary conditions usually show up with claims closer to 300k+ and/or a persistently rising 4-week average.

The November 29 print at 192k now looks like a bit of an outlier to the low side, and the December 6 spike to 237k looks like noise rather than the start of a trend.

1.2 Continued claims and IUR: mild firming, but no spike

  • Insured unemployment (SA), week ending Dec 6:

    • 1.897 million (+67k w/w from a revised 1.83 million).

    • Insured unemployment rate (IUR): 1.2% (unchanged).

    • 4-week average: 1.902 million (-14k).

Insured unemployment is oscillating in a pretty narrow band: 1.83–1.95 million over much of 2025. The fact that the IUR is flat at 1.2% while levels move around is a reminder that this is mostly noise around a tight steady state, not a structural shift.

You also see divergence between SA and NSA:

  • NSA insured unemployment: 1.88 million (week of Dec 6), down 75k w/w, rate down from 1.3% to 1.2%.

  • Seasonal factors had expected a larger decline, so relative to expectations, the labor market is slightly weaker than the NSA drop alone suggests—but not dramatically.

1.3 State-level patterns: sectoral and regional pockets

Highest insured unemployment rates (week ending Nov 29):

  • Washington 2.5%, New Jersey 2.4%, California 2.3%, Minnesota 2.2%, Massachusetts 2.1%, and Puerto Rico / Rhode Island 2.0%, with Alaska, Oregon 1.9% and Nevada, New York 1.8% close behind.

This is a familiar pattern: elevated IUR in states with:

  • Higher exposure to tech / services / high-wage sectors (CA, WA, MA).

  • Historically higher baseline UI recipiency rates and more generous programs (NJ, RI).

  • Structural or cyclical sectoral exposure (e.g., construction and logistics on the West Coast).

For the week ending Dec 6, the largest NSA increases in initial claims were:

  • CA +14,258

  • IL +11,074

  • NY +10,346

  • TX +8,206

  • GA +6,333

State comments attribute this largely to layoffs in construction, manufacturing, transportation/warehousing, and admin/support/waste management plus some health care and accommodation/food services.

Policy-relevant point: These look like sectoral adjustments, not broad-based, demand-driven layoffs. Construction and manufacturing are classic late-cycle cyclicals; seeing choppiness here doesn’t, on its own, scream “recession.”

1.4 Federal programs and total UI usage

On a not-seasonally adjusted basis:

  • Total continued weeks claimed in all programs, week ending Nov 29:

    • 1,993,823 (up 262,500 w/w; versus 1,960,319 a year earlier).

  • Extended Benefits (EB) is basically inactive:

    • Only 9 continued weeks claimed, and no state is triggered “on” EB.

  • STC/workshare: ~22.7k continued weeks, slightly below the prior year’s 23.2k.

From a macro/financial-stability lens, the fact that EB is not triggered anywhere is a strong indicator that labor market weakness is not yet systemic.

2. Inflation: A Controlled Downshift toward 2–3%

2.1 Headline vs. core

For November 2025 (12-month changes):

  • All items CPI-U: +2.7% (down from +3.0% for 12 months ending September).

  • Core CPI (all items less food and energy): +2.6%.

From September to November (2-month SA changes, because October is missing):

  • Headline CPI: +0.2% total over 2 months.

  • Core CPI: +0.2% over the same period.

  • Shelter: +0.2% over 2 months.

  • Energy: +1.1%, food: +0.1% (both over 2 months).

If you roughly annualize that 2-month +0.2% move, you’re getting something in the ballpark of 1–2% annualized, i.e., softer than the 12-month headline figure. You don’t want to over-interpret two months (especially with a measurement gap), but the direction is clearly disinflationary.

2.2 Shutdown-related measurement caveat

BLS did not collect survey data for October 2025 due to a lapse in appropriations, and could only retroactively acquire most non-survey data.

Implications:

  • Standard month-over-month time-series analysis is noisier than usual.

  • The 2-month percent changes (September–November) are a workaround, not a model change.

  • 12-month figures (e.g., +2.7% headline, +2.6% core) still serve as the main anchor for trend inflation.

For policy analysis, you basically discount very fine-grained inferences about October but still treat the broader trajectory as valid.

2.3 Decomposing headline inflation

Food (12-month changes):

  • Food overall: +2.6%

    • Food at home: +1.9%

      • Meats/poultry/fish/eggs: +4.7%

      • Nonalcoholic beverages: +4.3%

      • Cereals/bakery: +1.9%

      • Fruits/vegetables: +0.1%

      • Dairy and related products: -1.6%

    • Food away from home: +3.7%

      • Full-service meals: +4.3%

      • Limited service: +3.0%

Interpretation:

  • Grocery inflation is sub-3% and clustered mostly around protein and beverages.

  • Restaurant inflation remains notably hotter than food-at-home, reflecting labor and overhead costs—a classic “services stickiness” story.

Energy (12-month changes):

  • Energy overall: +4.2%

    • Gasoline: +0.9%

    • Fuel oil: +11.3%

    • Electricity: +6.9%

    • Utility (piped) gas: +9.1%

So energy is still a positive contributor, but the gasoline component is comparatively mild; the bigger story is household energy (utilities and fuel oil), both of which have direct cost-of-living and political salience.

Core components (12-month):

  • Core CPI: +2.6%

    • Shelter: +3.0%

    • Services less energy: +3.0%

    • Used cars and trucks: +3.6%

    • Household furnishings/operations: +4.6%

    • Medical care services: +3.3%

This is a services-heavy inflation profile with goods not doing much damage except in a handful of categories (used vehicles, furnishings). The shelter component is still running above 2%, but at levels much closer to pre-pandemic “normal high” than the 6–8% rates seen in the earlier inflation spike.

3. Policy Implications

3.1 Monetary policy: This is what “orderly disinflation” looks like

From a central bank perspective, this combination is about as close as you get to “soft landing” conditions:

  • Inflation has drifted down from 3.0% to 2.7%, with core at 2.6%, i.e., slightly above typical 2% targets but trending down.

  • Labor market is still tight: low initial claims, low insured unemployment, no EB triggers, and only modest increases in continued claims.

Key angles for policymakers:

  1. Output gap / NAIRU context

    • Claims and IUR at these levels are not consistent with a large positive unemployment gap. Labor markets still appear close to or slightly above most estimates of NAIRU.

    • Yet, inflation is not accelerating; it’s easing, which reinforces the idea that the post-pandemic inflation burst may have been driven more by supply shocks and sectoral imbalances than by persistent overheating alone.

  2. Wage-price dynamics

    • With services inflation still around 3% and restaurant prices up 3–4% YoY, underlying wage growth is likely still above 2–2.5%, but not clearly incompatible with a medium-term glide path to 2%.

    • The Fed will view the moderation in goods inflation and slowing shelter inflation as evidence that pass-through from earlier cost shocks is fading.

  3. Risk balance for rate decisions

    • Data like this tends to lower the urgency of further tightening.

    • It does not yet justify aggressive easing, given that core is still above target and services/shelter remain sticky.

    • Translation: it’s the kind of setup that supports a “hold for longer, cut cautiously later” stance rather than “hike again” or “slash now.”

3.2 Fiscal & labor-market policy: No crisis, but some micro hot spots

From a fiscal / labor-programs lens:

  • No sign of a UI-driven emergency:

    • EB is off everywhere.

    • Total UI usage is up only modestly year-over-year.

  • Sectoral and regional shocks are present:

    • Concentrated in construction, manufacturing, transportation/warehousing, and some services.

    • These are classic cases where targeted adjustment assistance, retraining, or infrastructure/green capex could absorb displaced workers rather than broad UI expansions.

The high IUR in states like WA, CA, NJ, MA, and OR suggests watching:

  • Tech and high-skill services exposure.

  • Local housing and cost-of-living issues that interact with labor mobility.

But nothing in the data screams “we’re about to blow through automatic stabilizers and need emergency discretionary intervention.”

3.3 Distributional and political economy angles

  • Shelter and utilities are still rising faster than headline, which hits renters and lower-income households hardest.

  • Food-at-home inflation is manageable, but restaurant prices remain elevated—visible to households and politically salient.

  • The shutdown-driven data gaps will likely become part of the “governance risk” discussion: if recurring shutdowns degrade data quality, it complicates real-time macro management.

4. How to Read This Going Forward

If you’re thinking about these releases in a policy-wonk framework, a few takeaways:

  • Trend inflation: High-2% and drifting down, not stuck in a 4–5% range.

  • Labor market: Still tight, but with normal late-cycle churn concentrated in cyclical sectors.

  • Policy stance: Data-dependent central bank can credibly stay on hold, lean dovish later if this disinflation trend persists, without immediate pressure to either re-tighten or pivot hard.

Disclaimer: This blog post is for informational purposes only and should not be construed as financial advice. Always conduct thorough research and consider seeking advice from a financial professional before making any investment decisions.

Source: https://www.dol.gov/ui/data.pdf, https://www.bls.gov/news.release/cpi.nr0.htm


Please let us know your feedback. If you are interested in timestamps, please send us an email to sales@haawks.com.

Start futures forex fx news trading with Haawks G4A low latency machine-readable data today, one of the fastest news data feeds for US macro-economic and commodity data.

Comment

Comment

45 pips potential profit in 48 seconds on 10 December 2025, analysis on futures forex fx low latency news trading USDJPY and EURUSD on FOMC Interest Rate Decision data

According to our analysis USDJPY and EURUSD moved 45 pips on FOMC Interest Rate Decision and Projections data on 10 December 2025.

1816 pips potential performance in 2025 (2024: 4,305)

USDJPY (26 pips)

EURUSD (19 pips)

Charts are exported from JForex (Dukascopy).


The Fed Just Cut Rates: What the December 2025 Decision Really Means

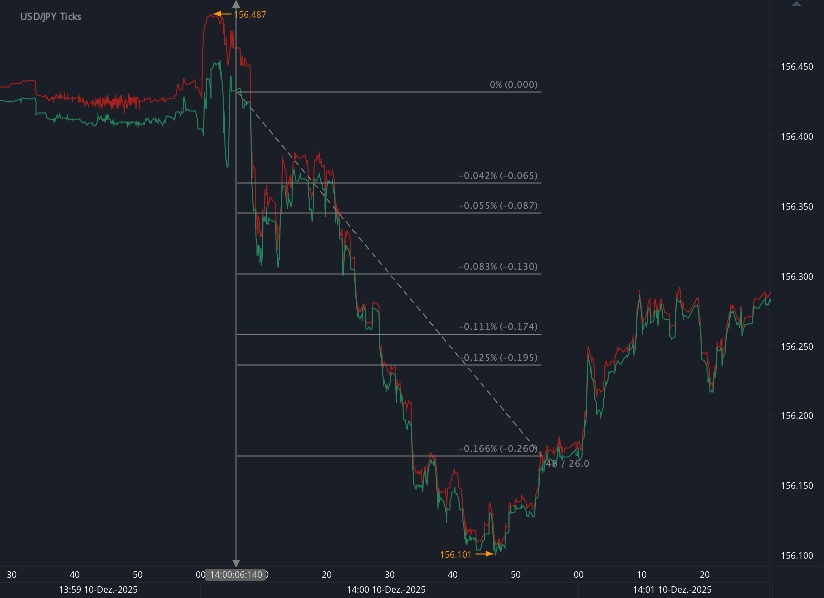
On December 10, 2025, the Federal Reserve did something markets had been debating for months: it cut interest rates again.

The Federal Open Market Committee (FOMC) lowered the target range for the federal funds rate by 0.25 percentage point, to 3.50–3.75%, and released a fresh set of economic projections that stretch out to 2028. Alongside that, they gave us a pretty clear message:

Growth looks okay, inflation is still a bit too high, the labor market is softening, and the risks around the outlook are uncomfortably elevated.

Let’s unpack what was just announced, what the Fed is signaling about the future, and why the internal disagreements on the Committee really matter this time.

1. The Big Move: A 25bp Cut with Rising Concerns

The FOMC statement paints an economy that’s still growing, but more fragile:

  • “Economic activity has been expanding at a moderate pace.”

  • Job gains have slowed, and unemployment has edged up through September.

  • Inflation has moved up since earlier in the year and “remains somewhat elevated.”

Despite that uptick in inflation, the Fed chose to ease policy:

“The Committee decided to lower the target range for the federal funds rate by 1/4 percentage point to 3-1/2 to 3-3/4 percent.”

Why cut when inflation is higher than earlier in the year?
Because the Fed is increasingly worried about the downside risks to employment. The statement explicitly notes that downside risks to employment have risen in recent months, and that’s a big shift in emphasis. The Fed’s dual mandate (maximum employment and price stability) is now facing pressure from both sides at once.

2. The New Forecasts: Slightly Stronger Growth, Gradual Disinflation

The Summary of Economic Projections (SEP) lays out the Fed participants’ median forecasts for the economy from 2025–2028.

Real GDP Growth (Q4/Q4)

Median forecast:

  • 2025: 1.7%

  • 2026: 2.3%

  • 2027: 2.0%

  • 2028: 1.9%

  • Longer run: 1.8%

Compared with the September projections, growth is now expected to be a touch stronger in 2026 and 2027. The story: a soft-ish landing narrative is still alive—modest growth now, slightly firmer growth later, then easing back to the long-run trend.

Unemployment Rate (Q4 average)

Median forecast:

  • 2025: 4.5%

  • 2026: 4.4%

  • 2027: 4.2%

  • 2028: 4.2%

  • Longer run: 4.2%

Unemployment is projected to stay above the pre-pandemic lows and settle around what the Fed views as its longer-run normal. Compared to September, changes are small, but the message is that the labor market is no longer “red hot”—it’s moving closer to equilibrium, but with heightened risk it could weaken more than desired.

Inflation: PCE and Core PCE

Headline PCE inflation (Q4/Q4):

  • 2025: 2.9%

  • 2026: 2.4%

  • 2027: 2.1%

  • 2028: 2.0%

  • Longer run: 2.0%

Core PCE (excluding food & energy):

  • 2025: 3.0%

  • 2026: 2.5%

  • 2027: 2.1%

  • 2028: 2.0%

The Fed still expects a gradual glide path back to 2%, but:

  • Inflation in 2025 is now seen just a bit lower than September for headline (2.9% vs 3.0) and core (3.0% vs 3.1),

  • The journey back to 2% is long and uncertain, with inflation staying above target through 2026.

Put simply:

The Fed thinks inflation is heading in the right direction, but not fast enough to declare victory.

3. The Rate Path: Lower Now, but Still “Higher-for-Longer” Compared to Pre-2020

The “dot plot” (Figure 2 and the memo line in Table 1) shows where participants think the federal funds rate will be at year-end.

Median projected fed funds rate:

  • 2025: 3.6%

  • 2026: 3.4%

  • 2027: 3.1%

  • 2028: 3.1%

  • Longer run: 3.0%

Key takeaways:

  • The 2025 median is unchanged from September at 3.6%, even though the Fed has just cut to 3.5–3.75%. That implies only limited additional easing is currently envisioned for 2025.

  • Beyond 2025, rates are expected to drift lower but not plunge.

  • The longer-run neutral rate is still around 3.0%—a world where “normal” interest rates are structurally higher than the near-zero era of the 2010s.

So this is not a pivot back to ultra-easy money; it’s more like:

“We’re easing off the brakes, not slamming on the gas.”

4. Internal Divisions: The First Cut with Real Dissent

This meeting featured three dissents, underscoring real disagreement about what’s appropriate right now:

  • Stephen I. Miran voted for a bigger cut, preferring a 1/2 percentage point reduction.

  • Austan D. Goolsbee and Jeffrey R. Schmid voted against the cut, preferring no change in the target range this meeting.

So within the Committee you can see three camps:

  1. Easers (Miran & likely some others quietly sympathetic): worried enough about growth and employment that they want faster easing.

  2. “Mainstream” majority: sees a 25bp cut as the right compromise between still-elevated inflation and rising downside risks to jobs.

  3. Hawks (Goolsbee, Schmid and possibly others): focused more on stubborn inflation and concerned that easing too soon could reignite price pressures.

When you see this kind of three-way split, it usually means the data are sending mixed signals and the margin for error looks uncomfortably small.

5. Balance Sheet & Reserves: Quiet but Important

One line in the statement may fly under the radar but matters for markets:

“The Committee judges that reserve balances have declined to ample levels and will initiate purchases of shorter-term Treasury securities as needed to maintain an ample supply of reserves on an ongoing basis.”

Translation:

  • The Fed thinks the banking system is now at an “ample” level of reserves.

  • To keep it that way, it’s prepared to buy short-term Treasuries as needed to avoid liquidity strains.

This is not a return to crisis-era quantitative easing; it’s more of a technical adjustment to stabilize the plumbing of the financial system. But for money markets and short-term funding, it’s a big signal of a steady, supportive backdrop.

6. Risks & Uncertainty: Elevated Across the Board

The SEP includes detailed information on how uncertain policymakers feel and which way they think risks are tilted.

A few notable patterns:

  • Uncertainty is high for GDP, unemployment, and both measures of inflation.

    • Most participants rate uncertainty as “higher” than the historical average over the last 20 years.

  • Risks to GDP growth are tilted to the downside.

    • More participants see a greater chance that growth comes in weaker rather than stronger.

  • Risks to inflation (both headline and core) are still tilted to the upside.

    • That is, there’s a meaningful probability that inflation proves stickier than forecast.

Put together, the Fed’s message is:

They’re worried about slower growth and higher unemployment, but they still don’t fully trust that inflation is conquered.

That’s why you see a cautious rate cut, not a full-on easing cycle signal.

7. What This All Means Going Forward

Here’s the big-picture read of the December 2025 Fed package:

  1. The Fed is now in a rate-cutting phase, but not a panicked one.

    • A 25bp cut with a still-elevated rate path is consistent with a fine-tuning approach.

  2. Growth is expected to remain positive, not collapse.

    • Median GDP growth picks up somewhat in 2026, suggesting the Fed is trying to engineer a soft landing, not bracing for a deep recession.

  3. Labor markets are cooling, and that’s making the Fed nervous.

    • The explicit mention that downside risks to employment have risen is notable and politically important under their dual mandate.

  4. Inflation is still above target for a while.

    • The Fed isn’t ready to declare a clean victory on inflation, which limits how aggressive they’re willing to be on cuts.

  5. Dissent shows real tension in the Committee.

    • One member wants faster easing, two wanted no easing at all. Future meetings could be lively, especially if incoming data swing unexpectedly.

8. How to Think About This as an Investor, Business, or Household

Without giving specific investment advice, here are some conceptual implications:

  • Borrowing costs may drift lower, but not crash.
    Mortgage and corporate borrowing rates are likely to ease somewhat over time, but the Fed’s longer-run rate around 3% still implies a higher interest rate world than the pre-2020 decade.

  • Growth assets vs. safe assets:
    A gentle rate-cutting path with still-positive growth tends to support risk assets, but the elevated uncertainty and inflation risks mean volatility isn’t going away.

  • Jobs outlook:
    The Fed is very focused on the labor market. If unemployment rises more quickly than forecast, the Fed could cut faster than the current dots imply—but they will be looking over their shoulder at inflation the whole time.

Final Thought

This December 2025 meeting is not a dramatic pivot; it’s a delicate adjustment in an environment where both sides of the Fed’s mandate look fragile.

The Fed is saying:

  • “We’re easing a bit to support the labor market.”

  • “We still think inflation is too high.”

  • “And honestly, we’re not very confident how this all plays out.”

In other words: welcome to the age of cautious cuts and uncomfortable uncertainty.

Disclaimer: This blog post is for informational purposes only and should not be construed as financial advice. Always conduct thorough research and consider seeking advice from a financial professional before making any investment decisions.

Source: https://www.federalreserve.gov/newsevents/pressreleases/monetary20251210a.htm, https://www.federalreserve.gov/monetarypolicy/fomcprojtabl20251210.htm


Start futures forex fx news trading with Haawks G4A low latency machine-readable data, one of the fastest machine-readable news trading feeds for US macro-economic and commodity data.

Please let us know your feedback. If you are interested in timestamps, please send us an email to sales@haawks.com.

Comment

803 pips, US500 34 points and BTC 2275 points potential futures forex fx news trading profit from 18 events in the third quarter of 2025 with Haawks G4A machine-readable news data feed

Comment

803 pips, US500 34 points and BTC 2275 points potential futures forex fx news trading profit from 18 events in the third quarter of 2025 with Haawks G4A machine-readable news data feed

We are pleased to announce that there was a potential of 803 pips/ticks, US500 34 points and BTC 2275 points profit out of the following 18 events in the third quarter of 2025 based on our ex-post analysis. The potential performance for 2024 was 4,305 pips/ticks.

Q3 2025

Cumulative potential, indicative performance Q3 2025 (only pips), please see all releases below.

Total trading time would have been around 25 minutes in 3 months! (preparation time not included)

You can click on each release for detailed information.


Key Market-Moving US Economic Events: July–September 2025 Recap

The past quarter has been packed with high-impact US economic data releases, each sparking notable volatility across forex, equities, commodities, and even crypto markets. From Non-Farm Payrolls (NFP) to inflation data, here’s a breakdown of how the major reports moved the markets between July and September 2025.

July 2025: A Strong Start With Jobs and Inflation

  • US Employment Situation (NFP) – 3 July
    The July 3rd NFP release triggered a 61-pip move in FX markets, setting the tone for the month. Traders watched closely for labor market signals amid Fed policy uncertainty.

  • US Jobless Claims – 10 July
    A lighter reaction with 13 pips of movement, but still relevant for short-term positioning.

  • USDA WASDE Report – 11 July
    Agriculture markets saw significant volatility, with 76 ticks of movement, underscoring the importance of crop outlooks on commodities.

  • US Producer Price Index (PPI) – 16 July
    Inflation pressures were in focus, sparking 16 pips in FX and a 3-point shift in US500 futures.

  • US Jobless Claims – 24 July
    Another labor snapshot, this time moving markets by 19 pips.

  • US GDP – 30 July
    Growth data delivered moderate volatility with 11 pips in FX and 95 points in BTC, highlighting crypto’s sensitivity to macroeconomic headlines.

August 2025: Inflation Surprises and Strong NFP

  • US Employment Situation (NFP) – 1 August
    A blockbuster jobs report moved markets aggressively: 157 pips in FX and 158 points in BTC.

  • DOE Natural Gas Storage – 7 August
    Natural gas traders reacted with 19 ticks of volatility, typical for this energy report.

  • US CPI – 12 August
    Inflation data hit hard, shaking multiple markets: 59 pips in FX, 17 points in US500, and 461 points in BTC.

  • USDA WASDE – 12 August
    On the same day, agriculture markets swung 96 ticks, making it a highly volatile session across asset classes.

  • US PPI – 14 August
    Another inflation measure sent waves through FX and crypto: 42 pips and 437 points in BTC.

  • US GDP – 28 August
    The growth snapshot added 15 pips of volatility—less dramatic but still watched closely.

September 2025: Jobs, JOLTS, and Inflation Drive Swings

  • US JOLTS Report – 3 September
    Labor demand data pushed markets by 22 pips and 144 points in BTC.

  • US NFP – 5 September
    The jobs report once again stood out, causing 68 pips in FX and 306 points in BTC.

  • US PPI – 10 September
    An outsized reaction this time: 14 pips in FX but a massive 674-point swing in BTC.

  • US CPI & Jobless Claims – 11 September
    A dual release that shook risk assets: 64 pips in FX, 14 points in US500, with crypto also under pressure.

  • US Jobless Claims – 18 September
    A mid-month update triggered 16 pips of movement.

  • US Jobless Claims – 25 September
    The final September claims report surprised with a stronger reaction, moving 35 pips.

Takeaways: Macro Data Is Driving Cross-Asset Volatility

  1. NFP and CPI remain the top-tier movers. Both repeatedly generated triple-digit moves in crypto and sizable swings in FX.

  2. Crypto is hyper-sensitive to macro. BTC reacted sharply to GDP, CPI, and especially PPI, showing greater volatility than traditional markets.

  3. Agriculture markets still hinge on WASDE. July and August reports saw 70–90 tick swings, keeping commodity traders on edge.

  4. Jobless claims matter when surprises hit. While often lower-impact, the late-September release caused 35 pips of volatility—showing that context matters.

As Q4 2025 approaches, markets remain highly reactive to US economic data, especially labor market reports and inflation metrics. Traders should prepare for continued volatility as the Federal Reserve balances growth concerns with inflation management.

Disclaimer: This blog post is for informational purposes only and should not be construed as financial advice. Always conduct thorough research and consider seeking advice from a financial professional before making any investment decisions.


Start futures/forex/oil/grains news trading with Haawks G4A low latency machine-readable data today, we offer one of the fastest machine-readable data feeds for US macro-economic and commodity data and macro-economic data from Norway, Sweden, Switzerland Turkey and ECB interest rates and statement.

Please let us know your feedback and check out our G4A low latency data feed.

All data is machine readable and available via API access in Chicago, New York and London. Free trials.

Comment

Comment

35 pips potential profit in 225 seconds on 25 September 2025, analysis on futures forex fx news trading USDJPY and EURUSD on US Jobless Claims data

According to our analysis USDJPY and EURUSD moved 35 pips on US Jobless Claims data on 25 September 2025.

1771 pips potential performance in 2025 (2024: 4,305)

USDJPY (22 pips)

EURUSD (13 points)

Charts are exported from JForex (Dukascopy).


U.S. Jobless Claims Fall to 218,000 as Labor Market Holds Steady

The U.S. labor market showed continued resilience last week, with unemployment insurance claims trending lower and insured unemployment remaining stable, according to the latest report from the Department of Labor.

Key Highlights from the Week Ending September 20, 2025

  • Initial jobless claims (seasonally adjusted) fell to 218,000, down 14,000 from the prior week’s revised level of 232,000.

  • The four-week moving average eased to 237,500, its lowest in over a month.

  • Insured unemployment—a measure of continued claims—stood at 1.93 million for the week ending September 13, virtually unchanged from the prior week.

  • The insured unemployment rate held steady at 1.3%, reflecting a tight labor market.

On an unadjusted basis, actual initial claims totaled 180,611, a decline of 14,822 (–7.6%) from the previous week. Seasonal factors had expected only a modest dip, underscoring stronger-than-expected labor demand.

State-Level Trends

Some states saw notable swings in claims:

  • Increases:

    • New York (+1,482) – layoffs in construction, healthcare, and professional services

    • South Carolina (+1,220) – no comment provided

  • Decreases:

    • Texas (–4,917)

    • Connecticut (–4,540)

    • Michigan (–3,944), driven by fewer manufacturing layoffs

    • Illinois (–1,153)

    • California (–1,139)

The highest insured unemployment rates were recorded in New Jersey (2.4%), California (2.0%), Connecticut (2.0%), and Washington (2.0%).

Federal and Special Program Activity

  • Claims filed by former federal civilian employees rose slightly to 635, while newly discharged veterans filed 420 claims.

  • Continued weeks claimed under all programs for the week ending September 6 totaled 1.79 million, down from 1.83 million the prior week.

  • No state triggered “on” the Extended Benefits program.

What It Means

With initial claims trending lower and insured unemployment stable, the labor market remains resilient despite pockets of weakness in certain industries and states. The steady insured unemployment rate at 1.3% indicates that while layoffs occur, most workers are finding jobs relatively quickly.

Barring major shocks, the labor market appears well-positioned heading into the final quarter of 2025.

Disclaimer: This blog post is for informational purposes only and should not be construed as financial advice. Always conduct thorough research and consider seeking advice from a financial professional before making any investment decisions.

Source: https://www.dol.gov/ui/data.pdf


Please let us know your feedback. If you are interested in timestamps, please send us an email to sales@haawks.com.

Start futures forex fx news trading with Haawks G4A low latency machine-readable data today, one of the fastest news data feeds for US macro-economic and commodity data.

Comment

Comment

16 pips potential profit in 11 seconds on 18 September 2025, analysis on futures forex fx news trading USDJPY and EURUSD on US Jobless Claims data

According to our analysis USDJPY and EURUSD moved 16 pips on US Jobless Claims data on 18 September 2025.

1736 pips potential performance in 2025 (2024: 4,305)

USDJPY (9 pips)

EURUSD (7 points)

Charts are exported from JForex (Dukascopy).


U.S. Jobless Claims Fall Sharply, Signaling Steady Labor Market

The U.S. Department of Labor reported that new unemployment insurance claims fell sharply in the latest week, underscoring resilience in the labor market despite recent fluctuations.

For the week ending September 13, 2025, the number of seasonally adjusted initial claims was 231,000, a decline of 33,000 from the prior week’s revised total of 264,000. This marks the lowest level in several weeks and comes as a positive sign following recent increases.

The four-week moving average, which smooths out weekly volatility, slipped to 240,000, down by 750 from the previous week.

Insured Unemployment Stable at 1.3%

The number of people continuing to receive unemployment benefits—known as insured unemployment—stood at 1.92 million for the week ending September 6, down 7,000 from the previous week. The insured unemployment rate held steady at 1.3%, suggesting relatively stable conditions for workers who remain on benefits.

The four-week moving average of continued claims also eased slightly, falling to 1.93 million.

State-Level Highlights

The latest data showed mixed patterns across states:

  • Largest increases in claims (week ending Sept. 6):

    • Texas (+15,346) — layoffs across multiple industries, including wholesale trade, health care, and manufacturing.

    • Michigan (+3,018) — layoffs in manufacturing.

    • Connecticut (+1,454).

  • Largest decreases in claims:

    • New York (-3,623) — fewer layoffs in transportation, health care, and food services.

    • Tennessee (-2,994).

    • California (-1,702).

States with the highest insured unemployment rates included New Jersey (2.7%), Rhode Island (2.1%), California (2.0%), Massachusetts (2.0%), and Washington (2.0%).

A Look at Unadjusted Claims

On an unadjusted basis, initial claims totaled 194,478, down about 10,000 from the previous week and slightly above the 186,835 recorded a year earlier. Insured unemployment (unadjusted) was 1.75 million, down nearly 51,000 week over week.

What This Means

While claims can be volatile from week to week, the decline in new filings suggests that layoffs remain relatively low compared with historical norms. Continued claims are holding steady, signaling that most displaced workers are still finding jobs without long delays.

The data continue to paint a picture of a labor market that is cooling modestly but remains fundamentally strong. Analysts will be watching in the coming weeks to see if the dip in claims reflects a sustained trend or a temporary correction after the early-September spike.

Disclaimer: This blog post is for informational purposes only and should not be construed as financial advice. Always conduct thorough research and consider seeking advice from a financial professional before making any investment decisions.

Source: https://www.dol.gov/ui/data.pdf


Please let us know your feedback. If you are interested in timestamps, please send us an email to sales@haawks.com.

Start futures forex fx news trading with Haawks G4A low latency machine-readable data today, one of the fastest news data feeds for US macro-economic and commodity data.

Comment

Comment

64 pips and US500 14 points potential profit in 58 seconds on 11 September 2025, analysis on futures forex fx news trading USDJPY, EURUSD and US500 on US CPI and US Jobless Claims data

According to our analysis USDJPY and EURUSD moved 64 pips and US500 moved 14 points on US CPI and US Jobless Claims data on 11 September 2025.

1720 pips potential performance in 2025 (2024: 4,305)

USDJPY (39 pips)

EURUSD (25 points)

US500 (14 points)

Charts are exported from JForex (Dukascopy).


US Economy Watch: Claims Jump to 263K, CPI Re-Accelerates to 2.9% YoY

Date: September 11, 2025 (8:30 a.m. ET releases)
Sources: U.S. Department of Labor (weekly jobless claims) & U.S. Bureau of Labor Statistics (CPI)

1) Labor market: initial claims pop to a 4-year high

  • Initial jobless claims (SA): 263,000 for the week ending Sept. 6, up 27,000 from the prior week’s revised 236,000.

    • This is the highest level since Oct. 23, 2021 (268,000).

  • 4-week moving average: 240,500 (+9,750), signaling a clear uptrend beyond weekly noise.

  • Continuing claims (SA): 1.939 million for the week ending Aug. 30, unchanged; insured unemployment rate steady at 1.3%.

Unadjusted detail (signals beneath the seasonal factors):

  • Initial claims (NSA): 204,581, up 7,869 week over week. Seasonal factors had expected a decrease, so the upside surprised.

  • Continuing claims (NSA): 1,814,469, down 77,729 from the prior week.

State color:

  • Biggest weekly increases in initial claims (NSA) for the week ending Aug. 30: Tennessee (+2,870; manufacturing layoffs), Connecticut (+2,270), New York (+1,683; transportation/warehousing, construction, arts & recreation), Illinois (+1,331; manufacturing, wholesale, retail, construction).

  • Biggest decline: Kentucky (-2,833; manufacturing layoffs).

  • Highest insured unemployment rates (week ending Aug. 23): New Jersey (2.8%), Rhode Island (2.5%), Massachusetts (2.2%), Washington (2.1%); California, Connecticut, Minnesota, Puerto Rico (2.0%).

How to read it:
The spike to 263K breaks the prior 220–240K range and lifts the trend (4-week avg 240.5K). Continuing claims are flat, so we’re not yet seeing broad, persistent job loss, but leading indicators are flashing cooling momentum.

2) Inflation: August CPI firmed, led by shelter and energy

  • Headline CPI (SA): +0.4% m/m in August (vs. +0.2% in July).
    Year-over-year: +2.9%, up from 2.7%.

  • Core CPI (ex-food & energy): +0.3% m/m (same as July); +3.1% YoY.

  • Key drivers (m/m):

    • Shelter: +0.4% (largest contributor).

    • Food: +0.5%; food at home +0.6% (broad-based, with fruits & vegetables +1.6%; beef +2.7%).

    • Energy: +0.7% with gasoline +1.9%.

    • Mixed core components: airline fares +5.9%, used vehicles +1.0%, new vehicles +0.3%; medical care -0.2%.

12-month lens:

  • Headline: 2.9%; Core: 3.1%.

  • Food: +3.2% YoY; Energy: +0.2% YoY with a split—gasoline -6.6% vs. electricity +6.2% and natural gas +13.8%.

  • Shelter: +3.6% YoY (still sticky).

What it means:
Inflation progress stalled modestly in August: headline ticked up and core stayed firm at 0.3% m/m. The stickiness in shelter plus rebounds in travel/vehicles kept disinflation from accelerating.

3) The combined picture: cooling jobs momentum + sticky core

  • A higher claims print alongside firmer CPI complicates the near-term policy read: labor is loosening at the margin, but price pressures—particularly in shelter and select services—remain not-quite-tame.

  • Markets and policymakers will watch whether claims stay above ~250K and whether core CPI can downshift below 0.2–0.25% m/m in coming months.

4) Fast facts & charts (text version)

  • Initial claims: 263K (highest since Oct. 2021)

  • 4-wk avg: 240.5K

  • Continuing claims (SA): 1.939M; IUR: 1.3%

  • CPI (Aug): +0.4% m/m, 2.9% YoY

  • Core CPI: +0.3% m/m, 3.1% YoY

  • Big movers: Shelter +0.4% m/m; Food at home +0.6%; Gasoline +1.9%; Airline fares +5.9%

  • State hotspot: TN manufacturing layoffs; CT, NY, IL saw sizable increases in new claims

5) What to watch next

  • Next CPI: Oct. 15, 2025 (Wed), 8:30 a.m. ET (September data)

  • Weekly claims: Every Thursday, 8:30 a.m. ET—watch for confirmation of the step-up above 250K.

  • Shelter measures: Any moderation here would meaningfully aid core disinflation.

Disclaimer: This blog post is for informational purposes only and should not be construed as financial advice. Always conduct thorough research and consider seeking advice from a financial professional before making any investment decisions.

Source: https://www.dol.gov/ui/data.pdf, https://www.bls.gov/news.release/cpi.nr0.htm


Please let us know your feedback. If you are interested in timestamps, please send us an email to sales@haawks.com.

Start futures forex fx news trading with Haawks G4A low latency machine-readable data today, one of the fastest news data feeds for US macro-economic and commodity data.

Comment