116 ticks potential profit on 30 June 2026, analysis on trading corn, wheat and soybeans futures on USDA Grain Stocks and USDA Acreage data

Comment

116 ticks potential profit on 30 June 2026, analysis on trading corn, wheat and soybeans futures on USDA Grain Stocks and USDA Acreage data

According to our analysis corn (ZC), wheat (ZW) and soybeans (ZS) futures prices moved around 28 / 40 / 48 ticks (total 116) on USDA Grain Stocks and USDA Acreage data on 30 June 2026.

Soybeans (48 ticks)
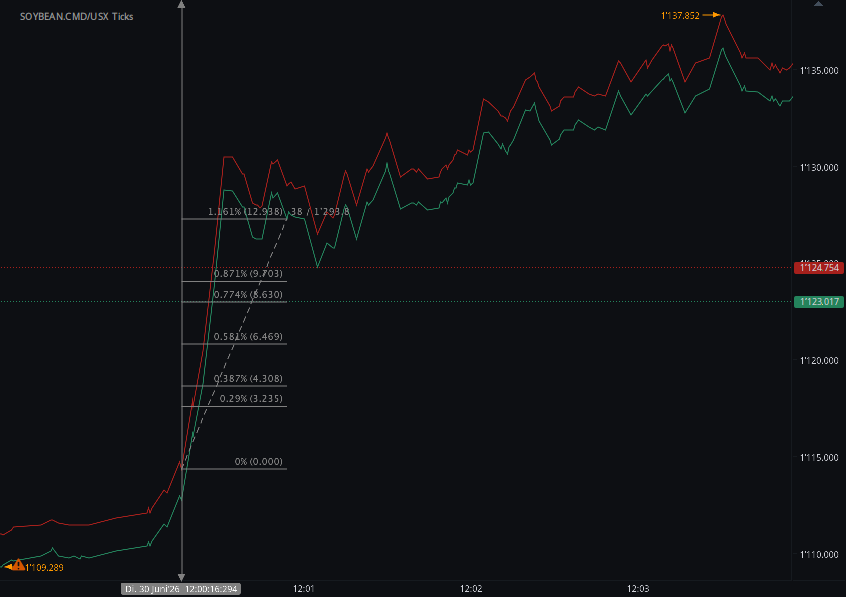
Charts are exported from JForex (Dukascopy).


USDA June Data: Bearish Old-Crop Stocks Meet a New-Crop Acreage Reset

Meta description: USDA’s June 2026 Acreage and Grain Stocks reports give grain traders a fresh setup: heavier old-crop corn, soybean, and wheat stocks, lower corn and wheat acreage, and a larger soybean footprint heading into summer weather risk.
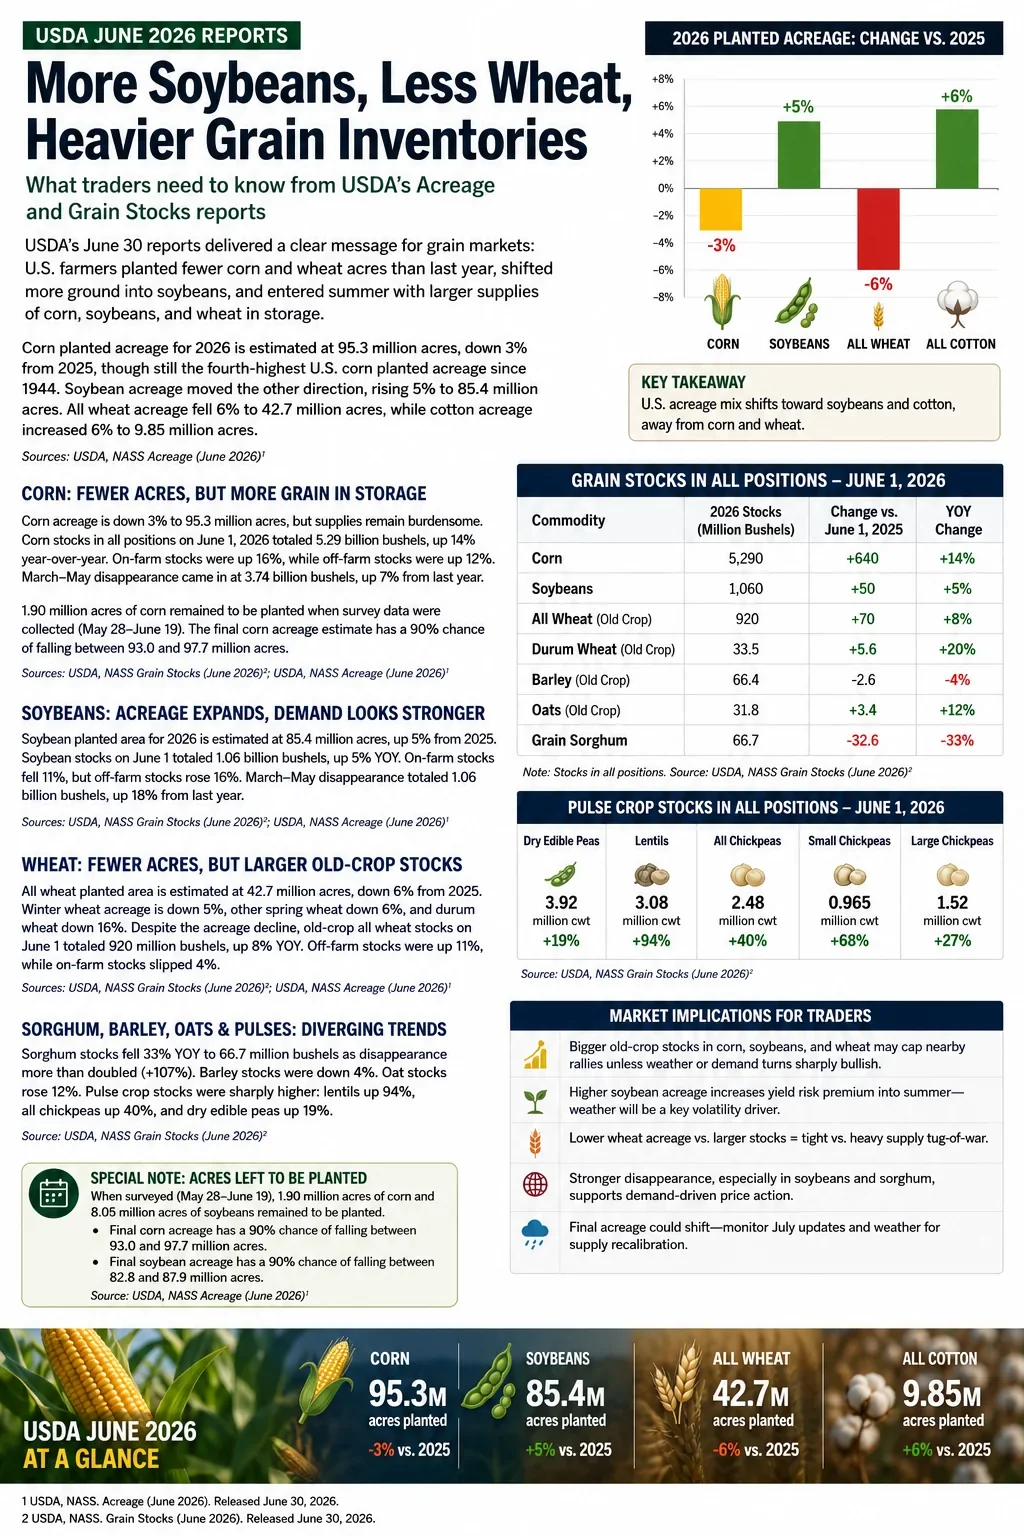
USDA June 2026 grain market infographic showing lower corn and wheat acreage, higher soybean acreage, and larger corn, soybean, and wheat stocks.

The Trade Setup

USDA’s June 30 Acreage and Grain Stocks reports gave traders a classic two-sided summer market: old-crop supplies look heavier, but new-crop acreage introduces fresh risk premium.

The headline acreage numbers were clear. Corn planted area is estimated at 95.3 million acres, down 3% from 2025. Soybean planted area rose 5% to 85.4 million acres. All wheat planted area dropped 6% to 42.7 million acres, while cotton acreage increased 6% to 9.85 million acres. USDA reported larger year-over-year inventories for the three major grain and oilseed contracts. June 1 corn stocks were 5.29 billion bushels, up 14% from last year. Soybean stocks were 1.06 billion bushels, up 5%. Old-crop all wheat stocks were 920 million bushels, up 8%.

For traders, the immediate read is not simply “bearish” or “bullish.” It is more nuanced: nearby supply is comfortable, but the acreage mix changes the sensitivity of new-crop balance sheets to July and August weather.

Corn: Stocks Lean Bearish, Acreage Keeps Weather Premium Alive

Corn gave the market a bearish old-crop signal. USDA’s 5.29 billion bushels of June 1 corn stocks were up 14% year over year. On-farm stocks rose 16%, while off-farm stocks rose 12%. March-May indicated disappearance was 3.74 billion bushels, compared with 3.50 billion during the same quarter last year.

That disappearance number shows demand wimply “bearish” or “bullish.” It is more nuanced: nearby supply is comfortable, but the acreage mix changes the sensitivity of new-crop balance sheets to July and August weather.

Corn: Stocks Lean Bearish, Acreage Keeps Weather Premium Alive

Corn gave the market a bearish old-crop signal. USDA’s 5.29 billion bushels of June 1 corn stocks were up 14% year over year. On-farm stocks rose 16%, while off-farm stocks rose 12%. March-May indicated disappearance was 3.74 billion bushels, compared with 3.50 billion during the same quarter last year.

That disappearance number shows demand was better than last year, but not enough to offset the larger supply cushion. The larger on-farm stock figure also matters for basis. If producers remain patient, cash markets may stay supported locally. If futures rally on weather and farmer selling accelerates, basis could soften quickly in surplus regions.

The acreage number complicates the bearish stocks story. Corn planted acreage at 95.3 million acres is down from last year, with harvested-for-grain acreage forecast at 87.4 million acres. USDA also noted that 1.90 million acres of corn were still left to be planted when survey data were collected, and that final planted acreage has a 90% historical range of 93.0 million to 97.7 million acres around the current estimate.

Trader read: Old-crop corn stocks cap nearby rallies, but lower acreage means December corn can still build weather premium quickly if forecasts turn hot and dry. The cleanest trade lens is old-crop pressure versus new-crop weather optionality.

Soybeans: Acreage Expands, But Demand Is the Bullish Detail

Soybeans delivered a larger acreage number, which is naturally bearish for new-crop supply assumptions. USDA estimated soybean planted acreage at 85.4 million acres, up 5% from 2025, with harvested acreage forecast at 84.4 million acres.

But the stocks report was not one-dimensional. June 1 soybean stocks were **1.06 bDecember corn can still build weather premium quickly if forecasts turn hot and dry. The cleanest trade lens is old-crop pressure versus new-crop weather optionality.

Soybeans: Acreage Expands, But Demand Is the Bullish Detail

Soybeans delivered a larger acreage number, which is naturally bearish for new-crop supply assumptions. USDA estimated soybean planted acreage at 85.4 million acres, up 5% from 2025, with harvested acreage forecast at 84.4 million acres.

But the stocks report was not one-dimensional. June 1 soybean stocks were 1.06 billion bushels, up 5% from last year. However, on-farm stocks were down 11%, while off-farm stocks rose 16%. March-May indicated disappearance was also 1.06 billion bushels, up 18% from the same period a year earlier.

That stronger disappearance figure is the key for traders. Expanded acres pressure the new-crop balances been active enough to keep the bull case alive, especially if crush margins, export demand, or weather risk tighten the forward outlook.

USDA also reported 8.05 million soybean acres left to be planted during the survey window, and the final soybean planted acreage estimate has a 90% historical range of 82.8 million to 87.9 million acres around the current estimate.

Trader read: November soybeans may struggle if weather is benign, but demand signals make the market vulnerable to sharp rallies if August weather turns threatening. Soybean spreads may remain especially sensitive to crush demand and export headlines.

Wheat: Lower Acres Versus Larger Stocks

Wheat has the clearest acreage contraction. USDA estimated all wheat planted area at 42.7 million acres, down 6% from 2025. Winter wheat area was 31.5 million acres, down 5%, while other spring wheat fell 6% and Durum acreage dropped 16%.

At the same time, old-crop wheat stocks were not tight. USDA reported 920 million bushels of old-crop all wheat in storage as of June 1, up *ather turns threatening. Soybean spreads may remain especially sensitive to crush demand and export headlines.

Wheat: Lower Acres Versus Larger Stocks

Wheat has the clearest acreage contraction. USDA estimated all wheat planted area at 42.7 million acres, down 6% from 2025. Winter wheat area was 31.5 million acres, down 5%, while other spring wheat fell 6% and Durum acreage dropped 16%.

At the same time, old-crop wheat stocks were not tight. USDA reported 920 million bushels of old-crop all wheat in storage as of June 1, up 8% from a year earlier. On-farm stocks were down 4%, but off-farm stocks were up 11%.

For futures, that mix argues for caution chasing rallies that are based only on acreage. Lower acres matter, but higher old-crop stocks reduce urgency unless yield, quality, export demand, or global wheat news adds fuel.

Trader read: Wheat needs a catalyst. Lower acreage supports the structure, but larger inventories make weather and export demand the deciding variables.

Sorghum and Pulses: Smaller Markets, Bigger Percentage Moves

Sorghum was one of the sharper stocks stories. June 1 grain sorghum stocks totaled 66.7 million bushels, down 33% from a year ago. March-May indicated disappearance was 105 million bushels, up 107% from the same period last year.

That is a meaningful tightening signal, even if sorghum does not drive the main board the way corn, soybeans, and wheat do. Regional feed demand, export interest, and relative value against corn could become more important.

Pulse crop stocks also moved sharply. Lentil stocks were up 94%, all chickpea stocks were up 40%, and dry edible pea stocks were up 19% from June 1, 2025.

Trader read: These markets matter most for regional cash trade and specialty-crop pricing, but the percentage changes are too large to ignore.

What Traders Should Watch Next

The June reports shift at, or global wheat news adds fuel.

Trader read: Wheat needs a catalyst. Lower acreage supports the structure, but larger inventories make weather and export demand the deciding variables.

Sorghum and Pulses: Smaller Markets, Bigger Percentage Moves

Sorghum was one of the sharper stocks stories. June 1 grain sorghum stocks totaled 66.7 million bushels, down 33% from a year ago. March-May indicated disappearance was 105 million bushels, up 107% from the same period last year.

That is a meaningful tightening signal, even if sorghum does not drive the main board the way corn, soybeans, and wheat do. Regional feed demand, export interest, and relative value against corn could become more important.

Pulse crop stocks also moved sharply. Lentil stocks were up 94%, all chickpea stocks were up 40%, and dry edible pea stocks were up 19% from June 1, 2025.

Trader read: These markets matter most for regional cash trade and specialty-crop pricing, but the percentage changes are too large to ignore.

What Traders Should Watch Next

The June reports shift attention to three market drivers.

First, weather now carries more weight for corn and soybeans. Corn acreage is lower, soybean acreage is higher, and both final acreage estimates still have uncertainty because survey data were collected before planting was fully complete.

Second, basis behavior will matter. Larger corn and wheat stocks can pressure cash markets, especially if futures rallies trigger farmer selling. Soybeans are more complicated because total stocks are higher, but on-farm stocks are lower and spring disappearance was strong.

Third, spreads may tell the story before flat price does. Heavy old-crop stocks argue against panic in nearby supply, while new-crop acreage and weather risk create room for volatility farther out the curve.

Bottom Line

USDA’s June numbers are not a directional signal. They are a volatility setup.

Corn carries bearish old-crop stocks but still has new-crop weather risk. Soybeans gained acres, but demand has been strong enough to keep traders alert. Wheat lost acreage, but larger old-crop stocks mean rallies need confirmation from weather, quality, or export demand.

The practical takeaway for traders: respect the supply cushion, but do not ignore the summer risk premium. The market now moves from acreage math to weather execution.

Disclaimer: This blog post is for informational purposes only and should not be construed as financial advice. Always conduct thorough research and consider seeking advice from a financial professional before making any investment decisions.

Sources: https://esmis.nal.usda.gov/sites/default/release-files/795959/grst0626.pdf, https://esmis.nal.usda.gov/sites/default/release-files/795961/acrg0626.pdf


Haawks G4A is one of the fastest machine-readable data feeds for USDA data. We are beating big names in the industry by seconds. Coverage includes monthly USDA WASDE (World Agricultural Supply and Demand Estimates), quarterly USDA Grain Stocks, yearly USDA Prospective Plantings and USDA Acreage and weekly USDA Crop Progress.

Please let us know your feedback. If you are interested in timestamps, please send us an email to sales@haawks.com.

Comment

HAAWKS Adds Weekly USDA Crop Progress Data for Major U.S. Crops

Comment

HAAWKS Adds Weekly USDA Crop Progress Data for Major U.S. Crops

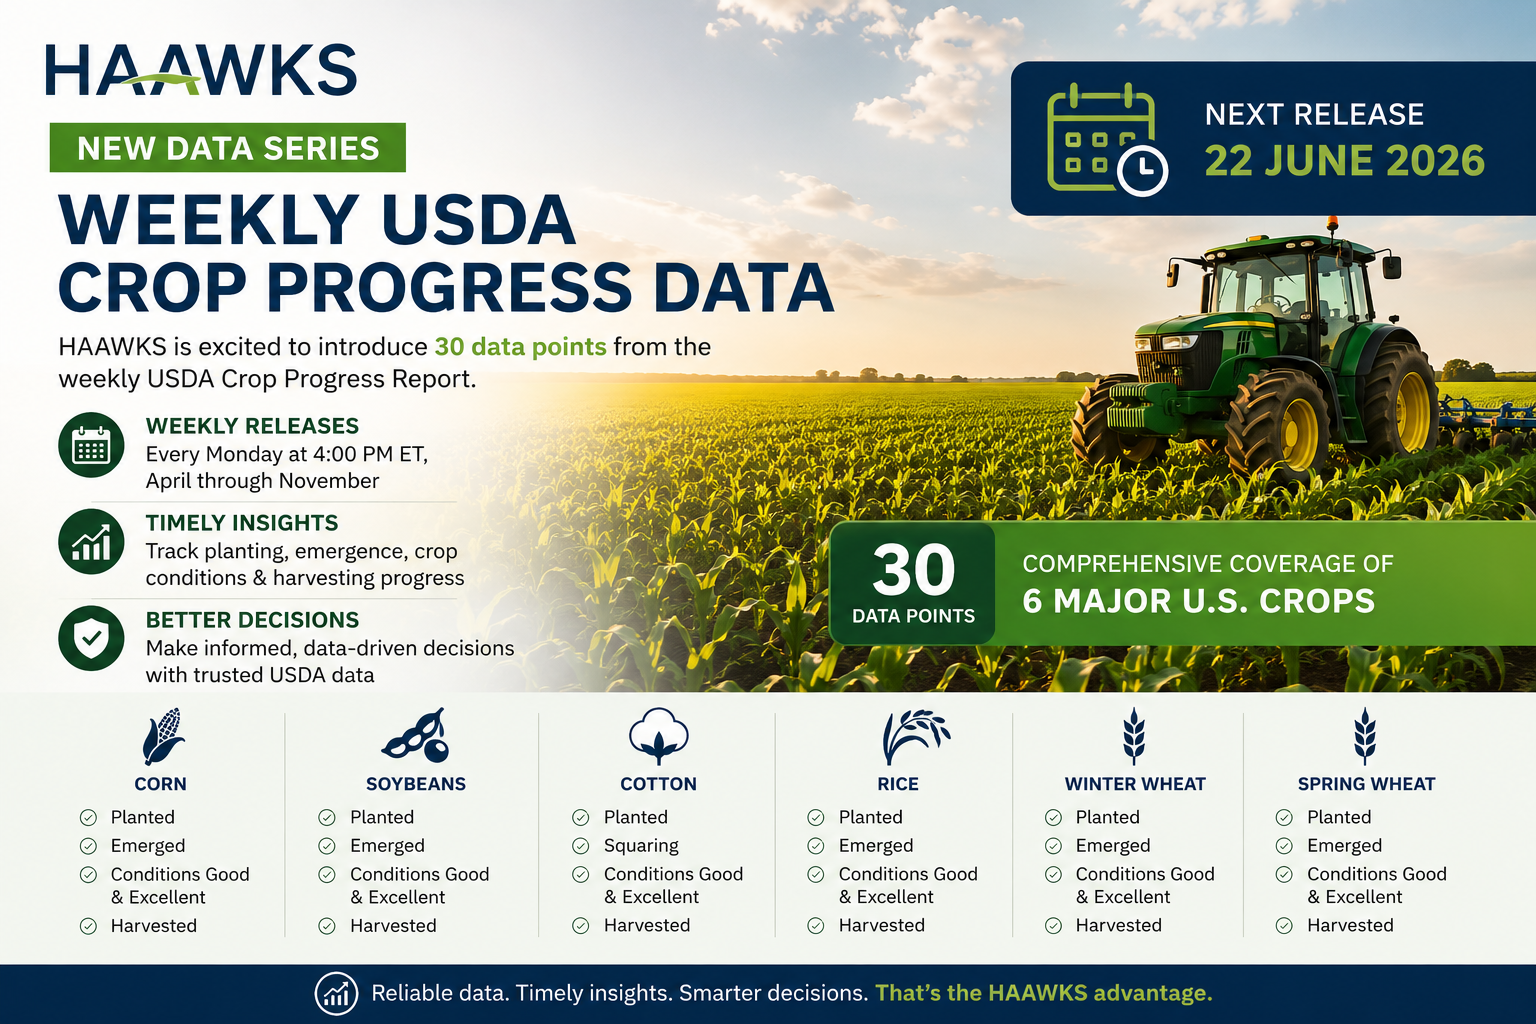
HAAWKS Expands Agricultural Coverage with Weekly USDA Crop Progress Data

HAAWKS announcement graphic for weekly USDA Crop Progress Data covering 30 data points across six major U.S. crops.

HAAWKS is pleased to announce the upcoming introduction and dissemination of new data points from the weekly USDA Crop Progress Report, one of the key reference sources for monitoring the development and condition of major U.S. crops throughout the growing season.

Released every Monday at 4:00 PM ET from April through November, the USDA Crop Progress Report provides timely updates on planting, emergence, crop conditions, and harvesting progress across major agricultural commodities. The next release is scheduled for 22 June 2026.

To support faster analysis and better market visibility, HAAWKS will introduce 30 weekly crop progress data points, covering six major U.S. crops:

Corn
Planted, emerged, conditions good & excellent, harvested

Soybeans
Planted, emerged, conditions good & excellent, harvested

Cotton
Planted, squaring, conditions good & excellent, harvested

Rice
Planted, emerged, conditions good & excellent, harvested

Winter Wheat
Planted, emerged, conditions good & excellent, harvested

Spring Wheat
Planted, emerged, conditions good & excellent, harvested

By making these data points available in a structured and timely format, HAAWKS helps traders, analysts, and agricultural market participants track crop development more efficiently and respond more quickly to changing supply-side conditions.

The addition of USDA Crop Progress data further strengthens HAAWKS’ commitment to delivering high-quality, market-relevant agricultural data that supports informed decision-making across the commodity markets.

Disclaimer: This blog post is for informational purposes only and should not be construed as financial advice. Always conduct thorough research and consider seeking advice from a financial professional before making any investment decisions.

Source: https://esmis.nal.usda.gov/publication/crop-progress

Comment

146 pips/ticks potential forex fx futures news trading profit from 4 events in May 2026 with Haawks G4A machine-readable data feed

Comment

146 pips/ticks potential forex fx futures news trading profit from 4 events in May 2026 with Haawks G4A machine-readable data feed

According to our analysis there was a potential of 146 pips/ticks potential profit out of the following 4 events in May 2026. The potential performance in 2025 was 1,828 pips / ticks.

May 2026

Cumulative potential, indicative performance May 2026, please see all releases below.

Total trading time would have been around 5 minutes! (preparation time not included)

You can click on each release for detailed information.


2026 News Trading Update: DOE (EIA) and PPI Reports Continue to Drive Fast Futures Market Moves

May 2026 delivered another active stretch for futures news traders, with several U.S. economic and commodity releases producing sharp short-term market moves. Across petroleum, natural gas, and inflation data, our analysis found meaningful tick movement shortly after key reports were released.

The strongest move in this period came from the DOE Petroleum Status Report on May 6, 2026, when crude oil moved 57 ticks in 40 seconds. Natural gas also remained highly responsive to DOE Natural Gas Storage Report data, moving 39 ticks on May 7 and 30 ticks on May 28. The U.S. BLS Producer Price Index report on May 13 also triggered a notable move in US500 futures, with the market moving 5 points, or 20 ticks, in 37 seconds.

Together, these events added to a potential 2026 performance figure of 911 pips, compared with 1,828 pips in 2025.

DOE Petroleum Status Report: Crude Oil Moves 57 Ticks on May 6

The DOE Petroleum Status Report released on May 6, 2026, produced the largest move in this group. According to our analysis, light sweet crude oil moved 57 ticks in 40 seconds following the report.

The underlying EIA data pointed to a tighter petroleum market. For the week ending May 1, U.S. commercial crude oil inventories fell by 2.3 million barrels to 457.2 million barrels. Although crude stocks remained about 1% above the five-year average for this time of year, the weekly draw showed that supply was being pulled lower as refinery activity remained strong.

Refineries operated at 90.1% of operable capacity, with crude oil refinery inputs averaging 16.0 million barrels per day. Gasoline and distillate production both declined slightly, while imports also moved lower. Crude oil imports averaged 5.5 million barrels per day, down 273,000 barrels per day from the previous week.

Fuel inventories also tightened. Motor gasoline inventories fell by 2.5 million barrels, leaving stocks about 4% below the five-year average. Distillate fuel inventories declined by 1.3 million barrels and stood about 11% below the five-year average.

The price data reinforced the market pressure. WTI crude stood at $105.38 per barrel on May 1, up $6.96 from the previous week and sharply above the year-ago level. Retail fuel prices also jumped, with regular gasoline rising to $4.452 per gallon and diesel increasing to $5.640 per gallon.

For traders, the report combined several market-moving elements: falling crude inventories, lower imports, tightening fuel stocks, firm demand, and sharply higher prices. That mix helped explain the strong short-term reaction in crude oil futures.

Natural Gas Storage Report: 39-Tick Move on May 7

Natural gas also showed strong sensitivity to DOE storage data. On May 7, 2026, the DOE Natural Gas Storage Report produced a 39-tick move in natural gas within 44 seconds.

For the week ending May 1, working natural gas in underground storage rose by 63 billion cubic feet, reaching 2,205 Bcf. Inventories were 75 Bcf higher than the same week in 2025 and 139 Bcf above the five-year average.

The report showed a generally comfortable storage position as the market moved further into injection season. Most regions posted gains, while the Mountain region recorded a small 2 Bcf withdrawal. The East region added 29 Bcf, the Midwest added 23 Bcf, and South Central added 9 Bcf.

One of the most notable details was the strength of inventories in the western regions. Mountain storage remained 48.2% above the five-year average, while Pacific storage stood 39.6% above the five-year average. By contrast, the East, Midwest, and South Central regions were much closer to normal.

The report suggested that the U.S. natural gas market was entering May with a healthy storage cushion. While national inventories were not excessively high, they were comfortably above both year-ago levels and the five-year average.

U.S. PPI Report: US500 Moves 20 Ticks on May 13

The U.S. BLS Producer Price Index report on May 13, 2026, also produced a fast futures market reaction. According to our analysis, US500 futures moved 5 points, equal to 20 ticks, in 37 seconds following the release.

The April 2026 PPI report showed a sharp acceleration in wholesale inflation. Final demand prices rose 1.4% on a seasonally adjusted monthly basis, following increases of 0.7% in March and 0.6% in February. That marked the largest monthly gain since March 2022.

On a year-over-year basis, final demand prices rose 6.0%, the largest 12-month increase since December 2022.

Services were a major contributor. Final demand services rose 1.2%, with trade services margins up 2.7% and transportation and warehousing services surging 5.0%. Freight costs were especially important, with truck transportation of freight contributing to increases across both final and intermediate demand categories.

Goods prices also rose sharply. Final demand goods increased 2.0%, driven heavily by energy. Final demand energy prices jumped 7.8%, while gasoline rose 15.6% and accounted for more than 40% of the increase in final demand goods prices.

Core producer inflation also strengthened. The index for final demand less foods, energy, and trade services rose 0.6%, the largest increase since October 2025. Over 12 months, this core measure increased 4.4%, the largest gain since February 2023.

For equity index futures, the report mattered because it pointed to broader inflation pressure across energy, freight, trade margins, services, and intermediate goods. The data complicated the inflation outlook and likely contributed to the sharp short-term move in US500 futures.

Natural Gas Storage Report: 30-Tick Move on May 28

Natural gas produced another significant move later in the month. On May 28, 2026, the DOE Natural Gas Storage Report triggered a 30-tick move in natural gas within 97 seconds.

For the week ending May 22, U.S. working natural gas in underground storage increased by 92 Bcf, bringing total stocks to 2,483 Bcf. Inventories were 21 Bcf higher than the same week in 2025 and 144 Bcf above the five-year average.

The weekly injection was broad-based across all major Lower 48 storage regions. The East region added 28 Bcf, the Midwest added 34 Bcf, the Mountain region added 3 Bcf, the Pacific region added 6 Bcf, and South Central added 21 Bcf.

At the regional level, Mountain and Pacific inventories remained especially strong relative to historical norms. Mountain storage stood 35.7% above the five-year average, while Pacific storage was 30.9% above the five-year average.

The 92 Bcf build left total U.S. storage within the five-year historical range and above the five-year average heading into the summer cooling season. While the national storage position remained comfortable, the size of the injection and regional details still produced a meaningful short-term futures reaction.

Bottom Line

May 2026 showed continued opportunity across futures news trading, especially around DOE energy reports and U.S. inflation data.

The DOE Petroleum Status Report on May 6 produced a 57-tick crude oil move as inventories tightened and fuel prices surged. The DOE Natural Gas Storage Reports on May 7 and May 28 produced 39-tick and 30-tick moves, respectively, as traders reacted to storage builds and regional inventory details. The U.S. PPI report on May 13 triggered a 20-tick move in US500 futures as wholesale inflation came in hot across headline, core, goods, services, freight, and energy components.

According to our analysis, these events contributed to 911 pips of potential performance in 2026, compared with 1,828 pips in 2025.

Disclaimer: This blog post is for informational purposes only and should not be construed as financial advice. Always conduct thorough research and consider seeking advice from a financial professional before making any investment decisions.


Start futures/forex/oil/grains news trading with Haawks G4A low latency machine-readable data today, we offer one of the fastest machine-readable data feeds for US macro-economic and commodity data and macro-economic data from Norway, Sweden, Turkey, Switzerland and ECB interest rates and statement.

Please let us know your feedback and check out our G4A low latency data feed.

All data is machine readable and available via API access in Chicago, New York and London. Free trials.

Comment

Comment

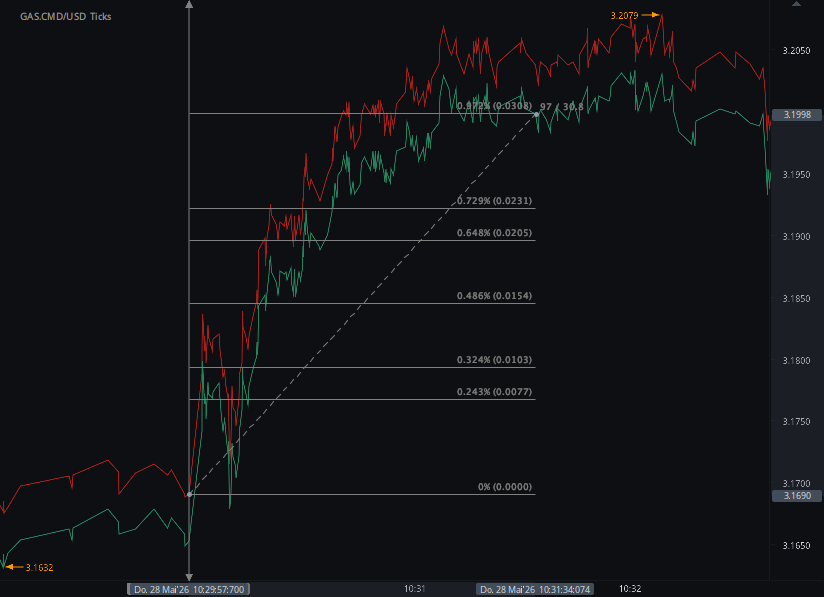
30 ticks potential profit in 97 seconds on 28 May 2026, analysis on futures news trading natural gas on DOE Natural Gas Storage Report (WNGSR) data

According to our analysis natural gas moved 30 ticks on DOE Natural Gas Storage Report (WNGSR) data on 28 May 2026.

Natural gas (30 ticks)

Charts are exported from JForex (Dukascopy).


U.S. Natural Gas Storage Climbs by 92 Bcf, Staying Above the Five-Year Average

U.S. working natural gas in underground storage rose sharply for the week ending May 22, 2026, according to the latest Weekly Natural Gas Storage Report from the U.S. Energy Information Administration. Total working gas stocks reached 2,483 billion cubic feet (Bcf), reflecting a net increase of 92 Bcf from the prior week.

The latest build keeps storage levels slightly above both last year’s mark and the five-year average. Stocks were 21 Bcf higher than the same week in 2025 and 144 Bcf above the five-year average of 2,339 Bcf. At 2,483 Bcf, total working gas remains within the five-year historical range.

Regional Storage Trends

The weekly increase was broad-based across all major Lower 48 storage regions.

The East region reported working gas stocks of 447 Bcf, up 28 Bcf from the previous week. Compared with historical levels, East inventories were 2.4% below last year but 1.1% above the five-year average.

The Midwest posted one of the larger regional gains, rising 34 Bcf to 539 Bcf. That placed Midwest stocks 0.4% above year-ago levels and 1.5% above the five-year average.

In the Mountain region, inventories increased by 3 Bcf to 213 Bcf. Storage levels there remained notably elevated, standing 8.1% above last year and 35.7% above the five-year average.

The Pacific region added 6 Bcf, bringing stocks to 292 Bcf. Pacific inventories were 15.4% higher than last year and 30.9% above the five-year average, making it one of the strongest regions relative to historical norms.

The South Central region reported stocks of 993 Bcf, up 21 Bcf from the previous week. Inventories were 2.4% below last year but still 0.6% above the five-year average.

Within South Central, salt storage rose by 7 Bcf to 305 Bcf, while nonsalt storage increased by 15 Bcf to 688 Bcf. Salt storage remained 6.7% below year-ago levels, though it was 2.0% above the five-year average. Nonsalt storage was nearly unchanged from both last year and the five-year average.

Storage Remains Comfortable Heading Into Summer

The 92 Bcf injection marks a sizable weekly build and leaves U.S. natural gas inventories in a relatively comfortable position heading into the summer cooling season. Total storage is not dramatically above historical norms, but it remains meaningfully stronger than the five-year average.

The regional breakdown also shows important differences. The Mountain and Pacific regions continue to hold inventories far above their five-year averages, while the East and South Central regions are modestly below last year’s levels. Still, the national picture points to adequate storage, with total working gas safely within the five-year historical range.

Key Takeaways

For the week ending May 22, 2026:

  • Total U.S. working natural gas in storage was 2,483 Bcf

  • Inventories increased by 92 Bcf from the previous week

  • Stocks were 21 Bcf higher than last year

  • Storage was 144 Bcf above the five-year average

  • Total working gas remained within the five-year historical range

  • The largest weekly regional increases came from the Midwest, East, and South Central regions

Overall, the latest EIA report suggests that U.S. natural gas storage remains well-positioned, with inventories above average and continued injections supporting supply levels ahead of peak summer demand.

Disclaimer: This blog post is for informational purposes only and should not be construed as financial advice. Always conduct thorough research and consider seeking advice from a financial professional before making any investment decisions.

Source: https://ir.eia.gov/ngs/ngs.html


Start futures forex fx commodity news trading with Haawks G4A low latency machine-readable data, one of the fastest data feeds for DOE data.

Please let us know your feedback. If you are interested in timestamps, please send us an email to sales@haawks.com.

Comment

Comment

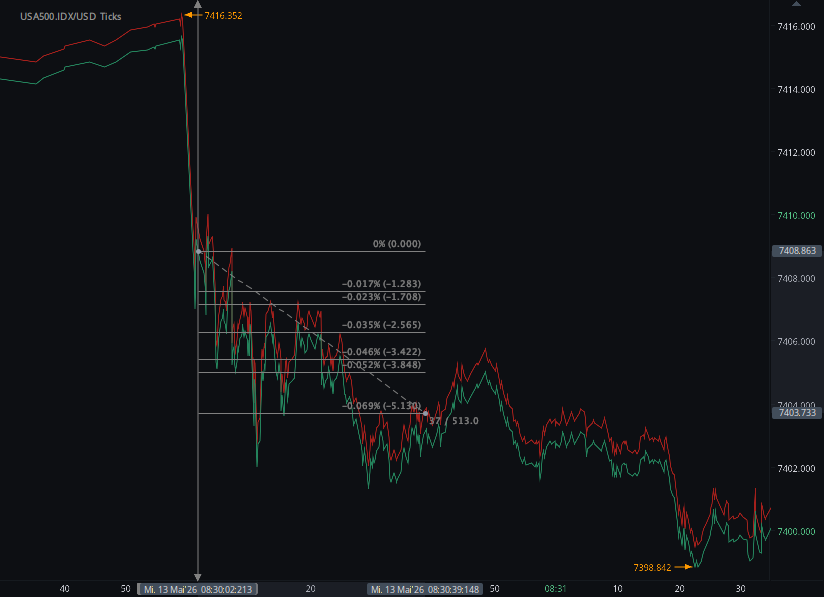
20 ticks potential profit in 37 seconds on 13 May 2026, analysis on futures forex fx low latency news trading US500 futures on US BLS Producer Price Index (PPI) data

According to our analysis US500 moved 5 points (20 ticks) on US BLS Producer Price Index (PPI) data on 13 May 2026.

US500 (5 points / 20 ticks)

Charts are exported from JForex (Dukascopy).


April 2026 PPI: Wholesale Inflation Surges as Energy, Freight, and Trade Margins Jump

The April 2026 Producer Price Index report delivered a clear signal: price pressures at the producer level accelerated sharply.

The Producer Price Index for final demand rose 1.4% in April, seasonally adjusted, according to the U.S. Bureau of Labor Statistics. That followed increases of 0.7% in March and 0.6% in February, making April the largest monthly gain since March 2022.

On a year-over-year basis, final demand prices were up 6.0%, the largest 12-month increase since December 2022.

For businesses, consumers, and policymakers, the report suggests that inflation pressures are not just lingering; they may be broadening again across key parts of the economy.

Services Did Most of the Heavy Lifting

Nearly 60% of April’s increase in final demand prices came from services. The index for final demand services rose 1.2%, its largest monthly increase since March 2022.

A major driver was trade services, where margins received by wholesalers and retailers jumped 2.7%. Transportation and warehousing services also surged, rising 5.0% in the month.

Several categories contributed to the rise, including:

  • Machinery and equipment wholesaling

  • Truck transportation of freight

  • Fuels and lubricants retailing

  • Health, beauty, and optical goods retailing

  • Chemicals and allied products wholesaling

  • Legal services

Not every service category moved higher. Portfolio management prices fell 2.4%, while food retailing margins and metals, minerals, and ores wholesaling margins also declined.

Still, the services side of the report was notably strong, especially in areas tied to distribution, freight, and wholesale margins.

Goods Prices Also Rose Sharply

Final demand goods prices increased 2.0% in April after rising 1.9% in March.

Energy was the main story. Final demand energy prices jumped 7.8%, accounting for more than three-quarters of the overall goods increase.

Gasoline alone rose 15.6% and accounted for more than 40% of the April rise in final demand goods prices. Other energy-related increases included jet fuel, diesel fuel, and residual fuels.

There were also increases in fresh and dry vegetables and industrial chemicals.

One striking exception was chicken eggs, whose index dropped 49.7%. Nonferrous scrap and residential natural gas prices also declined.

Core Producer Inflation Picked Up Too

The index for final demand less foods, energy, and trade services rose 0.6% in April. That was the largest increase since October 2025.

Over the past 12 months, this core measure increased 4.4%, the largest year-over-year gain since February 2023.

That matters because this measure strips out some of the most volatile categories. A strong increase here suggests the April report was not only about energy swings. Underlying price pressure also strengthened.

Intermediate Demand Shows Pipeline Pressure

The report also showed strong increases earlier in the production chain.

Processed goods for intermediate demand rose 2.7% in April, the sixth straight monthly increase. Processed energy goods rose 7.8%, while processed materials excluding food and energy increased 1.5%.

Over the past year, processed goods for intermediate demand rose 9.4%, the largest 12-month increase since October 2022.

Unprocessed goods prices rose even faster, climbing 4.1% in April. The biggest driver was unprocessed energy materials, up 9.2%. Crude petroleum rose 11.3%, accounting for nearly three-quarters of the advance in unprocessed goods.

The 12-month increase for unprocessed goods reached 20.9%, the largest since September 2022.

These intermediate demand numbers suggest that cost pressures are building not only at the final stage but also deeper in the supply chain.

Freight and Transportation Costs Stand Out

Transportation was one of the clearest pressure points in the report.

Final demand transportation and warehousing services rose 5.0%, while transportation and warehousing services for intermediate demand jumped 3.7%.

Truck transportation of freight was especially important. It contributed to increases in both final demand services and intermediate demand services, with truck freight prices rising 8.1% in the intermediate demand category.

Higher freight costs can ripple through the economy because they affect the cost of moving raw materials, intermediate goods, and finished products. When transportation costs rise quickly, businesses may face pressure to raise prices or absorb lower margins.

Production Flow Data Point to Broad-Based Increases

The production flow measures also showed broad price gains across stages of production.

Stage 4 intermediate demand rose 0.9%, the largest increase since January 2023. Stage 3 rose 2.3%, stage 2 increased 2.8%, and stage 1 advanced 2.1%.

The strongest monthly increase came from stage 2 intermediate demand, where goods inputs climbed 5.1%.

Year-over-year increases were also notable:

  • Stage 4 intermediate demand: 5.4%

  • Stage 3 intermediate demand: 5.9%

  • Stage 2 intermediate demand: 11.1%

  • Stage 1 intermediate demand: 8.9%

The especially large increases in earlier stages suggest cost pressures could continue feeding into later stages if they persist.

What This Means

April’s PPI report was hot across several dimensions.

Energy was a major contributor, especially gasoline, diesel, jet fuel, and crude petroleum. But the report was not limited to energy. Services prices, trade margins, freight costs, chemicals, and several wholesale categories also rose.

The rise in the core final demand measure adds to the significance of the report. When prices excluding food, energy, and trade services are rising at the fastest year-over-year pace in more than three years, it points to broader inflation pressure beneath the headline number.

For businesses, the report suggests higher input costs may be returning across transportation, energy, materials, and distribution channels. For consumers, the PPI does not directly measure retail prices, but producer cost increases can eventually flow through to consumer prices.

For policymakers, the April data complicates the inflation picture. A single month does not make a trend, but this report showed acceleration across headline PPI, core PPI, goods, services, and intermediate demand.

Bottom Line

The April 2026 Producer Price Index report showed a sharp acceleration in wholesale inflation. Final demand prices rose 1.4% for the month and 6.0% from a year earlier, both marking the strongest readings in years.

Energy was the biggest driver, but services, freight, trade margins, and intermediate goods also showed meaningful price pressure.

The next PPI report, covering May 2026, is scheduled for release on Thursday, June 11, 2026, at 8:30 a.m. ET.

Disclaimer: This blog post is for informational purposes only and should not be construed as financial advice. Always conduct thorough research and consider seeking advice from a financial professional before making any investment decisions.

Source: https://www.bls.gov/news.release/ppi.nr0.htm


Start futures forex fx news trading with Haawks G4A low latency machine-readable data, one of the fastest machine-readable news trading feed for US economic and commodity data.

Please let us know your feedback. If you are interested in timestamps, please send us an email to sales@haawks.com.

Comment

Comment

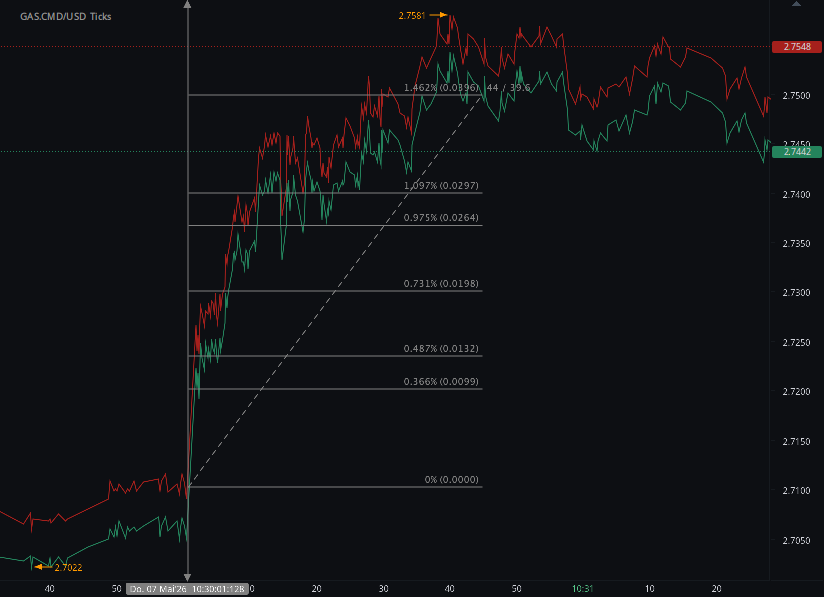
39 ticks potential profit in 44 seconds on 7 May 2026, analysis on futures news trading natural gas on DOE Natural Gas Storage Report (WNGSR) data

According to our analysis natural gas moved 39 ticks on DOE Natural Gas Storage Report (WNGSR) data on 7 May 2026.

Natural gas (39 ticks)

Charts are exported from JForex (Dukascopy).


U.S. Natural Gas Storage Builds by 63 Bcf, Staying Above the Five-Year Average

The U.S. natural gas storage season continued to gain momentum in the week ending May 1, 2026, with working gas inventories rising by 63 billion cubic feet (Bcf) from the previous week. According to the U.S. Energy Information Administration’s Weekly Natural Gas Storage Report, total working gas in underground storage across the Lower 48 states reached 2,205 Bcf.

That puts inventories 75 Bcf higher than the same week last year and 139 Bcf above the five-year average of 2,066 Bcf. In percentage terms, total stocks were 3.5% above year-ago levels and 6.7% above the five-year average.

While inventories remain comfortably within the five-year historical range, the latest report suggests that the market entered May with a relatively healthy storage cushion.

Regional Storage Trends

The weekly build was not evenly distributed across regions. Most areas posted increases, while the Mountain region recorded a small withdrawal.

The East region added 29 Bcf, bringing inventories to 361 Bcf. That level is nearly in line with the five-year average of 362 Bcf and slightly above last year’s 358 Bcf.

The Midwest saw a 23 Bcf increase, with stocks rising to 452 Bcf. Inventories there are just above last year’s level of 450 Bcf, though still 1.5% below the five-year average of 459 Bcf.

The Mountain region stood out with a 2 Bcf decline, leaving storage at 203 Bcf. Even with the weekly draw, this region remains well above historical benchmarks, sitting 13.4% above last year and 48.2% above the five-year average.

The Pacific region added 3 Bcf, bringing stocks to 275 Bcf. This is one of the strongest regional comparisons in the report, with inventories 19.0% above last year and 39.6% above the five-year average.

The South Central region, the largest storage region by volume, added 9 Bcf, bringing inventories to 914 Bcf. That is nearly flat compared with both last year and the five-year average, standing 0.2% above year-ago levels and 0.4% above the five-year average.

Within South Central, salt storage increased by 1 Bcf to 273 Bcf, while nonsalt storage rose by 7 Bcf to 641 Bcf. Salt storage remains 6.2% below last year and 1.4% below the five-year average, while nonsalt storage is above both comparisons.

What the Latest Build Means

The 63 Bcf injection reflects the seasonal transition from winter withdrawal season into spring and summer refill season. During this period, natural gas demand for heating typically declines, allowing more supply to move into underground storage ahead of the next winter.

The latest storage level of 2,205 Bcf suggests that the market is starting the refill season from a solid position. Inventories are not excessively high, but they are comfortably above both last year and the five-year average.

This matters because storage levels play a key role in shaping natural gas market expectations. Higher inventories can help reduce concerns about winter supply tightness, while lower inventories can increase price sensitivity to weather, production changes, and demand swings.

Regional Strength Is Concentrated in the West

One of the most notable details in the report is the strength of storage levels in the Mountain and Pacific regions. The Mountain region is almost 50% above its five-year average, while the Pacific region is nearly 40% above its five-year average.

By contrast, the East and Midwest are much closer to normal, and South Central is essentially in line with historical comparisons. This regional split suggests that national inventories are above average in part because of unusually strong storage positions in the western regions.

Bottom Line

For the week ending May 1, 2026, U.S. natural gas storage increased by 63 Bcf, bringing total working gas inventories to 2,205 Bcf. Stocks are now 75 Bcf above last year and 139 Bcf above the five-year average.

The report points to a generally well-supplied market as the injection season progresses. While regional differences remain, total inventories are within the five-year historical range and sitting above average heading into the warmer months.

Disclaimer: This blog post is for informational purposes only and should not be construed as financial advice. Always conduct thorough research and consider seeking advice from a financial professional before making any investment decisions.

Source: https://ir.eia.gov/ngs/ngs.html


Start futures forex fx commodity news trading with Haawks G4A low latency machine-readable data, one of the fastest data feeds for DOE data.

Please let us know your feedback. If you are interested in timestamps, please send us an email to sales@haawks.com.
Comment

Comment

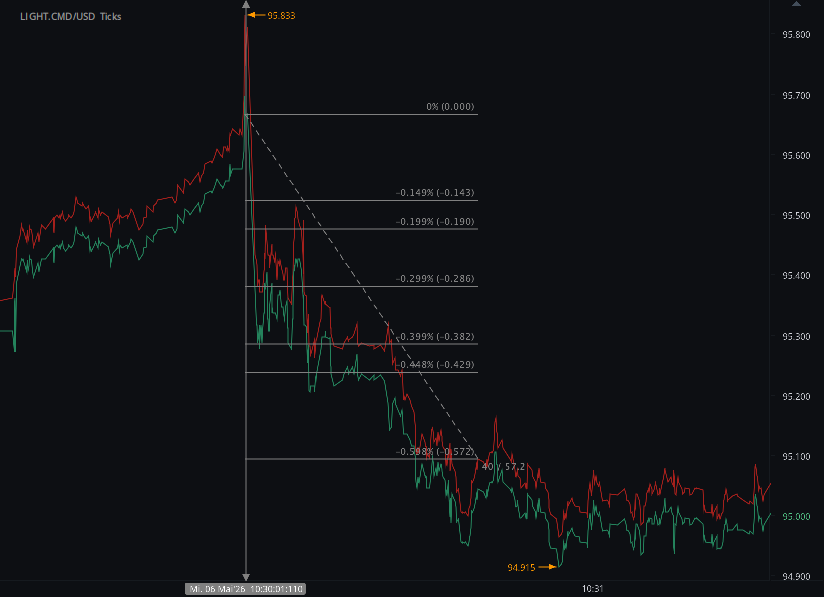
57 ticks potential profit in 40 seconds on 6 May 2026, analysis on futures news trading crude oil on DOE Petroleum Status Report (WPSR) data

According to our analysis crude oil moved 57 ticks on DOE Petroleum Status Report (WPSR) data on 6 May 2026.

Light sweet crude oil (57 ticks)

Charts are exported from JForex (Dukascopy).


U.S. Oil Inventories Tighten as Fuel Prices Jump in Early May 2026

The latest Weekly Petroleum Status Report from the U.S. Energy Information Administration shows a petroleum market under renewed pressure. For the week ending May 1, 2026, crude oil inventories declined, refinery activity remained strong, fuel stocks tightened, and retail gasoline and diesel prices moved sharply higher.

The headline number: U.S. commercial crude oil inventories fell by 2.3 million barrels, bringing total crude stocks excluding the Strategic Petroleum Reserve to 457.2 million barrels. That level remains about 1% above the five-year average for this time of year, but the weekly draw still points to a market where supply is being pulled down as refineries continue to run at high utilization.

Refineries Stay Busy, But Inputs Edge Lower

U.S. crude oil refinery inputs averaged 16.0 million barrels per day during the week, down 42,000 barrels per day from the prior week’s average. Refineries operated at 90.1% of operable capacity, a relatively strong utilization rate as the market moves deeper into the spring and closer to peak summer driving demand.

Gasoline production slipped to an average of 9.6 million barrels per day, while distillate fuel production also declined, averaging 4.9 million barrels per day.

Looking at the four-week averages, refinery activity remains slightly ahead of last year. Crude oil input to refineries averaged 16.032 million barrels per day, compared with 15.900 million barrels per day for the same period in 2025. Motor gasoline production also improved year over year, averaging 9.810 million barrels per day, versus 9.663 million barrels per day a year earlier.

Crude Imports Decline

Crude oil imports averaged 5.5 million barrels per day last week, down 273,000 barrels per day from the previous week. Over the past four weeks, imports averaged roughly 5.6 million barrels per day, which is 2.4% lower than the same four-week period last year.

Net crude oil imports over the latest four-week period averaged just 346,000 barrels per day, far below the 1.592 million barrels per day recorded during the comparable period in 2025. That reflects a much stronger net export position for the broader U.S. petroleum market.

Total petroleum net imports were deeply negative at -5.890 million barrels per day, meaning the U.S. exported far more petroleum and petroleum products than it imported on a net basis.

Fuel Inventories Move Lower

The report showed broad draws across key fuel categories.

Motor gasoline inventories fell by 2.5 million barrels to 219.8 million barrels. That leaves gasoline stocks about 4% below the five-year average for this time of year. Finished gasoline inventories increased, but blending component inventories declined enough to pull the overall gasoline stock figure lower.

Distillate fuel inventories declined by 1.3 million barrels to 102.3 million barrels. Distillate stocks are now about 11% below the five-year average, a notable shortfall given the importance of diesel and heating oil to freight, agriculture, industry, and winter fuel markets.

Propane and propylene inventories also decreased by 1.3 million barrels, though they remain exceptionally high by historical standards at 56% above the five-year average.

Total commercial petroleum inventories declined by 5.9 million barrels for the week.

Demand Looks Firm Across Major Products

Total products supplied, a common proxy for demand, averaged 20.3 million barrels per day over the latest four-week period. That is up 2.6% from the same period last year.

Motor gasoline product supplied averaged 9.0 million barrels per day, up 1.0% year over year. Distillate fuel product supplied averaged 3.8 million barrels per day, up 3.5% from the same period last year.

Jet fuel was the weak spot. Jet fuel product supplied was down 6.2% compared with the same four-week period in 2025.

The demand picture is therefore mixed but generally constructive: gasoline and distillate consumption are running ahead of last year, while aviation fuel demand is lagging.

Crude and Fuel Prices Surge

The price section of the report is where the pressure becomes most visible.

The West Texas Intermediate crude oil price stood at $105.38 per barrel on May 1, 2026. That was up $6.96 from the prior week and a striking $45.71 above the year-ago level of $59.67.

Refined product prices were also sharply higher than last year:

  • New York Harbor conventional gasoline: $3.630 per gallon, up from $1.850 a year ago.

  • New York Harbor No. 2 heating oil: $3.871 per gallon, up from $1.907 a year ago.

  • New York Harbor ultra-low sulfur diesel: $4.016 per gallon, up from $2.005 a year ago.

  • Mont Belvieu propane: $0.884 per gallon, up from $0.731 a year ago.

Retail prices followed the same pattern. The national average price for regular gasoline rose to $4.452 per gallon on May 4, up 32.9 cents from the prior week and $1.305 above the year-ago price.

Diesel prices rose even more dramatically. The national average on-highway diesel price increased to $5.640 per gallon, up 28.9 cents from the previous week and $2.143 higher than one year earlier.

What This Means for the Market

This week’s report points to a tighter and more expensive petroleum market. Crude oil inventories remain slightly above the five-year average, but weekly stock draws, lower imports, firm refinery runs, and declining product inventories suggest that supply is not building comfortably.

The most important pressure point may be distillate fuel. Inventories are 11% below the five-year average, while distillate product supplied is running 3.5% above last year. That combination helps explain why diesel prices remain elevated and why businesses tied to freight, logistics, construction, farming, and manufacturing may continue to face high fuel costs.

Gasoline markets are also tightening as the summer driving season approaches. Inventories are below normal, demand is slightly higher than last year, and retail prices have jumped sharply.

Bottom Line

The May 1, 2026 petroleum report shows a market defined by falling inventories, resilient demand, strong refinery utilization, lower imports, and sharply higher prices.

Crude prices above $105 per barrel and national gasoline prices above $4.45 per gallon suggest that consumers and businesses are already feeling the impact. Unless supply improves or demand softens, fuel prices could remain under pressure heading into the summer travel season.

Disclaimer: This blog post is for informational purposes only and should not be construed as financial advice. Always conduct thorough research and consider seeking advice from a financial professional before making any investment decisions.

Source: https://www.eia.gov/petroleum/supply/weekly/archive/2026/2026_05_06/pdf/highlights.pdf


Start futures forex fx commodity news trading with Haawks G4A low latency machine-readable data, one of the fastest data feeds for DOE data.

Please let us know your feedback. If you are interested in timestamps, please send us an email to sales@haawks.com.
Comment

137 pips, US500 4 points potential forex fx futures news trading profit from 5 events in April 2026 with Haawks G4A machine-readable data feed

Comment

137 pips, US500 4 points potential forex fx futures news trading profit from 5 events in April 2026 with Haawks G4A machine-readable data feed

According to our analysis there was a potential of 137 pips and US500 4 points potential profit out of the following 5 events in April 2026. The potential performance in 2025 was 1,828 pips / ticks.

April 2026

Cumulative potential, indicative performance April 2026, please see all releases below.

Total trading time would have been around 5 minutes! (preparation time not included)

You can click on each release for detailed information.


Fast Markets, Faster Data: What Late-April 2026 Tells Us About News Trading

The final weeks of April 2026 offered a textbook example of how high-impact economic releases can drive rapid price movements across energy and equity markets. From natural gas storage data to petroleum inventories and consumer sentiment, traders saw sharp, short-lived opportunities—often lasting less than two minutes.

This post breaks down what happened, why it mattered, and what it reveals about the evolving landscape of low-latency news trading.

Natural Gas: Injection Season Drives Quick Moves

On April 30, 2026, the Weekly Natural Gas Storage Report from the U.S. Energy Information Administration (EIA) triggered an 18-tick move in just 24 seconds.

What the Data Showed

  • +79 Bcf injection, bringing total storage to 2,142 Bcf

  • +116 Bcf vs last year

  • +153 Bcf above the five-year average

This confirmed a strong start to the injection season, with supply comfortably exceeding historical norms.

Market Interpretation

The reaction was fast because the data reinforced a bearish short-term narrative:

  • Mild weather → lower demand

  • Strong injections → rising inventories

  • Oversupply risk → downward price pressure

Yet, the move was brief—highlighting how quickly markets digest structured data when expectations are clear.

Crude Oil: Inventory Draws Fuel Volatility

A day earlier, on April 29, the EIA’s petroleum status report triggered a much larger reaction:

  • 49 ticks in 81 seconds in light sweet crude oil

Key Highlights

  • Crude inventories: -6.2 million barrels

  • Gasoline: -6.1 million barrels

  • Distillates: -4.5 million barrels

  • Imports declined sharply

At the same time:

  • WTI surged to $98.42/barrel

  • Demand remained strong, especially for distillates

Why It Moved

This was a classic bullish supply shock setup:

  • Falling inventories

  • Strong demand

  • Reduced imports

Unlike natural gas, where oversupply capped upside, crude oil showed tightening fundamentals, leading to stronger and longer price movement.

Consumer Sentiment: Smaller Data, Smaller Moves

Not all releases generate the same opportunity.

On April 24, the University of Michigan Consumer Sentiment report moved the US500 index by:

  • 4 points in 31 seconds

Key Takeaways

  • Sentiment dropped to 49.8

  • Inflation expectations jumped to 4.7%

Despite its macro importance, the market reaction was muted compared to energy data.

Why?

  • Equity markets often price in sentiment trends gradually

  • No immediate supply/demand shock like in commodities

  • Lower urgency for algorithmic execution

A Pattern Emerges: Speed vs Substance

Looking across these events:

Event Instrument Move Time
Natural Gas Storage (Apr 30) Natural Gas 18 ticks 24 sec
Petroleum Report (Apr 29) Crude Oil 49 ticks 81 sec
Consumer Sentiment (Apr 24) US500 4 points 31 sec
Natural Gas Storage (Apr 23) Natural Gas 19 ticks 32 sec

Key Observations

  1. Energy data dominates short-term volatility

  2. Inventory surprises = strongest reactions

  3. Speed matters—most moves happen within 1–2 minutes

  4. Consistency exists: similar reports produce repeatable reactions

The Bigger Picture: 2026 vs 2025

  • 2026 YTD: 765 pips potential

  • 2025: 1,828 pips

This suggests:

  • Either lower volatility so far in 2026

  • Or fewer large surprises relative to expectations

But the structure remains intact—predictable, fast bursts of opportunity around scheduled releases.

What Drives These Moves?

Across all reports, three core drivers stand out:

1. Expectations vs Reality

Markets don’t react to data—they react to surprises.

2. Supply/Demand Imbalances

Especially in commodities:

  • Inventory builds → bearish

  • Inventory draws → bullish

3. Machine-Speed Execution

Modern trading systems process releases instantly, leaving:

  • Milliseconds—not minutes—for entry

  • A premium on low-latency data feeds

Looking Ahead

With summer approaching, several catalysts could amplify volatility:

  • Heatwaves → increased natural gas demand

  • LNG exports → tighter supply

  • Refinery activity → crude and product imbalances

The next EIA releases will be critical in confirming whether:

  • Natural gas oversupply persists

  • Oil markets continue tightening

Final Thoughts

Late April 2026 reinforces a simple reality:

The biggest opportunities in news trading are fast, data-driven, and increasingly dominated by speed.

Energy markets—especially those tied to EIA reports—remain among the most responsive instruments for short-term traders. But success depends on more than just interpretation:

  • Timing

  • Execution

  • Access to machine-readable data

Without those, even the clearest opportunity can be gone in seconds.

Disclaimer: This blog post is for informational purposes only and should not be construed as financial advice. Always conduct thorough research and consider seeking advice from a financial professional before making any investment decisions.


Start futures/forex/oil/grains news trading with Haawks G4A low latency machine-readable data today, we offer one of the fastest machine-readable data feeds for US macro-economic and commodity data and macro-economic data from Norway, Sweden, Turkey, Switzerland and ECB interest rates and statement.

Please let us know your feedback and check out our G4A low latency data feed.

All data is machine readable and available via API access in Chicago, New York and London. Free trials.

Comment

Comment

18 ticks potential profit in 24 seconds on 30 April 2026, analysis on futures news trading natural gas on DOE Natural Gas Storage Report (WNGSR) data

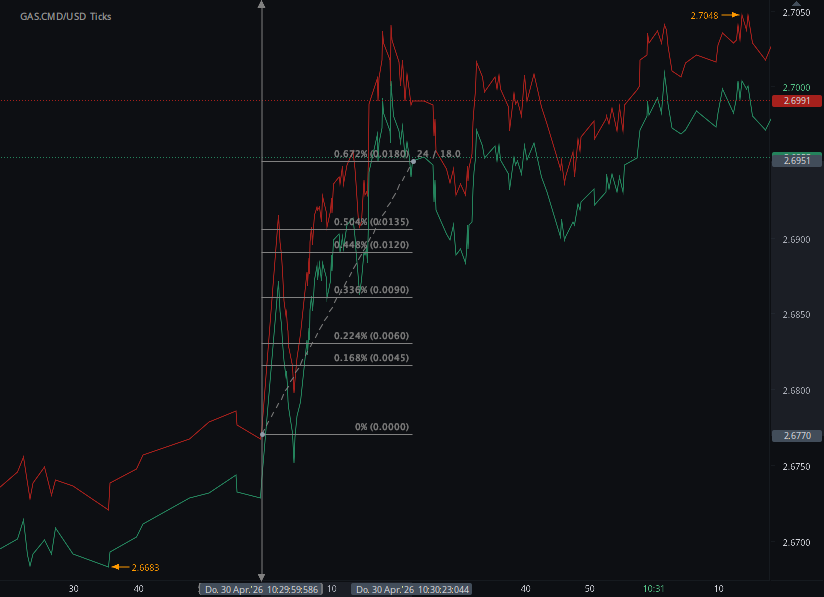
According to our analysis natural gas moved 18 ticks on DOE Natural Gas Storage Report (WNGSR) data on 30 April 2026.

Natural gas (18 ticks)

Charts are exported from JForex (Dukascopy).


Natural Gas Storage Builds Momentum Heading into Late Spring

The latest Weekly Natural Gas Storage Report for the week ending April 24, 2026, offers a clear signal that the injection season is firmly underway. According to the U.S. Energy Information Administration (EIA), working gas in underground storage across the Lower 48 states rose to 2,142 billion cubic feet (Bcf)—a 79 Bcf increase from the prior week.

Strong Weekly Injection Signals Seasonal Shift

This 79 Bcf build is a solid injection for late April, reflecting milder temperatures and reduced heating demand across much of the country. As the market transitions away from winter withdrawals, injections like this are expected to become more consistent in the weeks ahead.

Storage Levels Outpace Historical Benchmarks

Current inventory levels are notably strong:

  • +116 Bcf higher than the same time last year

  • +153 Bcf above the five-year average (1,989 Bcf)

Despite these surpluses, total working gas remains within the historical five-year range, suggesting that while supply is comfortable, it is not yet excessive.

Regional Breakdown: Broad-Based Increases

All major regions posted gains during the week:

  • South Central led with a 26 Bcf injection, bringing total stocks to 905 Bcf

  • Midwest added 25 Bcf, now at 429 Bcf

  • East region increased by 23 Bcf, reaching 332 Bcf

  • Mountain and Pacific regions each posted modest 3 Bcf builds

Within the South Central region:

  • Salt storage rose by 9 Bcf

  • Nonsalt storage increased by 18 Bcf

The relatively balanced distribution of injections suggests stable supply conditions nationwide, without any major regional constraints.

Market Implications

The above-average storage levels could exert downward pressure on natural gas prices in the near term, particularly if injections continue at a strong pace and demand remains moderate. However, several factors could shift this outlook:

  • Early summer heat waves driving cooling demand

  • LNG export levels

  • Production trends and rig activity

For now, the market appears well-supplied heading into the warmer months.

Looking Ahead

With the next report scheduled for May 7, market participants will be watching closely to see whether injections maintain this pace. Sustained builds above historical norms could further widen the storage surplus, while any slowdown may tighten expectations heading into peak summer demand.

Overall, this report reinforces a familiar seasonal narrative: inventories are rebuilding efficiently, supply is ample, and the market is entering a period where weather will increasingly dictate direction.

Disclaimer: This blog post is for informational purposes only and should not be construed as financial advice. Always conduct thorough research and consider seeking advice from a financial professional before making any investment decisions.

Source: https://ir.eia.gov/ngs/ngs.html


Start futures forex fx commodity news trading with Haawks G4A low latency machine-readable data, one of the fastest data feeds for DOE data.

Please let us know your feedback. If you are interested in timestamps, please send us an email to sales@haawks.com.
Comment

Comment

49 ticks potential profit in 81 seconds on 29 April 2026, analysis on futures news trading crude oil on DOE Petroleum Status Report (WPSR) data

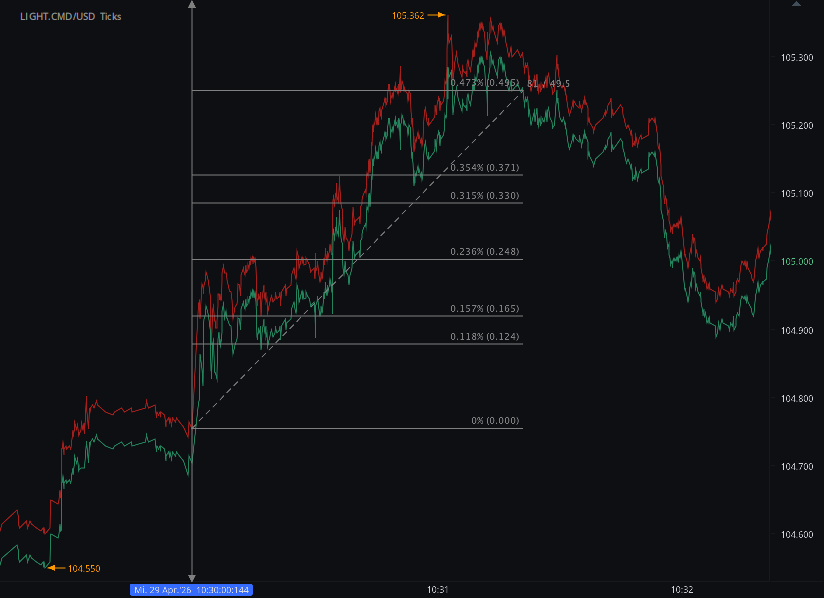
According to our analysis crude oil moved 49 ticks on DOE Petroleum Status Report (WPSR) data on 29 April 2026.

Light sweet crude oil (49 ticks)

Charts are exported from JForex (Dukascopy).


U.S. Energy Snapshot: What the Latest Petroleum Data Tells Us About Markets in 2026

The latest weekly report from the Energy Information Administration offers a revealing look into the current state of the U.S. petroleum market. From rising crude prices to tightening inventories and shifting demand patterns, the data highlights a complex and dynamic energy landscape as we move deeper into 2026.

Refinery Activity Holds Steady—But Production Slips

U.S. refineries processed an average of 16.1 million barrels per day during the week ending April 24, 2026. This marks a slight increase from the previous week, with refinery utilization hovering just under 90% of total capacity. While this suggests relatively stable operations, production figures tell a more nuanced story.

Gasoline production dipped to 9.8 million barrels per day, while distillate fuel output (including diesel and heating oil) also declined to 4.9 million barrels per day. These decreases could signal either maintenance cycles, reduced demand expectations, or tightening crude supply inputs.

Imports Down, Inventories Tightening

Crude oil imports fell notably, averaging 5.8 million barrels per day, down by 329,000 barrels from the previous week. Despite this drop, the four-week average remains slightly above last year’s levels.

Meanwhile, inventories are trending downward across the board:

  • Crude oil inventories dropped by 6.2 million barrels, though they remain about 1% above the five-year average.

  • Gasoline inventories fell by 6.1 million barrels, now sitting 2% below the seasonal average.

  • Distillate stocks declined by 4.5 million barrels, significantly 11% below the five-year average.

The consistent drawdowns suggest that supply is tightening, particularly for refined products, which could place upward pressure on prices if demand remains strong.

Demand Trends: Mixed Signals

Total petroleum products supplied—a proxy for demand—averaged 20.6 million barrels per day over the past four weeks, representing a 4.6% increase year-over-year.

Breaking it down:

  • Gasoline demand rose modestly by 1.2%, reflecting steady consumer activity.

  • Distillate demand jumped 4.8%, likely driven by industrial and freight sectors.

  • Jet fuel demand, however, declined by 4.6%, hinting at possible softness in air travel or seasonal adjustments.

Prices Surge Across the Board

Perhaps the most striking development is the sharp rise in energy prices:

  • West Texas Intermediate (WTI) crude oil climbed to $98.42 per barrel, up $12.51 in just one week and more than $34 higher than a year ago.

  • Retail gasoline prices reached a national average of $4.123 per gallon, nearly a dollar higher than last year.

  • Diesel prices, while slightly down week-over-week, remain elevated at $5.351 per gallon, up $1.84 year-over-year.

Spot prices for gasoline and heating oil at New York Harbor also saw significant weekly increases, reinforcing the broader upward trend.

What It All Means

The current data paints a picture of an energy market under pressure. Declining inventories, rising demand (especially for distillates), and reduced imports are converging to push prices higher. While refinery activity remains stable, the drop in production suggests that supply may not be keeping pace with consumption.

For consumers, this likely means continued high fuel costs in the near term. For businesses, especially those reliant on transportation or logistics, elevated diesel prices could impact margins. And for policymakers, the balance between energy security and market stability remains a critical challenge.

Final Thoughts

As global and domestic factors continue to influence the energy sector, weekly reports like this provide valuable insight into short-term trends and long-term trajectories. Whether you're an investor, policymaker, or everyday consumer, keeping an eye on these indicators can help you better understand—and prepare for—what lies ahead in the energy market.

Disclaimer: This blog post is for informational purposes only and should not be construed as financial advice. Always conduct thorough research and consider seeking advice from a financial professional before making any investment decisions.

Source: https://www.eia.gov/petroleum/supply/weekly/archive/2026/2026_04_29/pdf/highlights.pdf


Start futures forex fx commodity news trading with Haawks G4A low latency machine-readable data, one of the fastest data feeds for DOE data.

Please let us know your feedback. If you are interested in timestamps, please send us an email to sales@haawks.com.
Comment