According to our analysis crude oil moved 49 ticks on DOE Petroleum Status Report (WPSR) data on 29 April 2026.
Light sweet crude oil (49 ticks)
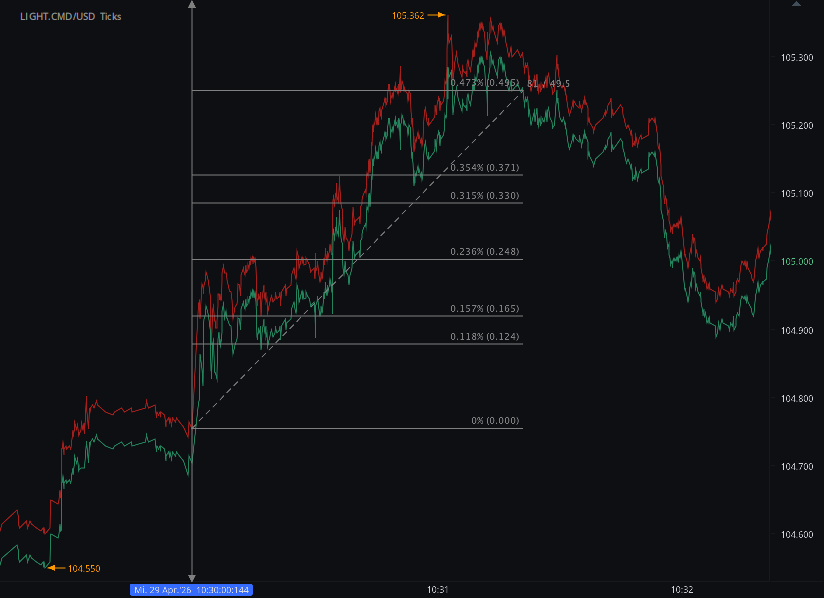
Charts are exported from JForex (Dukascopy).
U.S. Energy Snapshot: What the Latest Petroleum Data Tells Us About Markets in 2026
The latest weekly report from the Energy Information Administration offers a revealing look into the current state of the U.S. petroleum market. From rising crude prices to tightening inventories and shifting demand patterns, the data highlights a complex and dynamic energy landscape as we move deeper into 2026.
Refinery Activity Holds Steady—But Production Slips
U.S. refineries processed an average of 16.1 million barrels per day during the week ending April 24, 2026. This marks a slight increase from the previous week, with refinery utilization hovering just under 90% of total capacity. While this suggests relatively stable operations, production figures tell a more nuanced story.
Gasoline production dipped to 9.8 million barrels per day, while distillate fuel output (including diesel and heating oil) also declined to 4.9 million barrels per day. These decreases could signal either maintenance cycles, reduced demand expectations, or tightening crude supply inputs.
Imports Down, Inventories Tightening
Crude oil imports fell notably, averaging 5.8 million barrels per day, down by 329,000 barrels from the previous week. Despite this drop, the four-week average remains slightly above last year’s levels.
Meanwhile, inventories are trending downward across the board:
Crude oil inventories dropped by 6.2 million barrels, though they remain about 1% above the five-year average.
Gasoline inventories fell by 6.1 million barrels, now sitting 2% below the seasonal average.
Distillate stocks declined by 4.5 million barrels, significantly 11% below the five-year average.
The consistent drawdowns suggest that supply is tightening, particularly for refined products, which could place upward pressure on prices if demand remains strong.
Demand Trends: Mixed Signals
Total petroleum products supplied—a proxy for demand—averaged 20.6 million barrels per day over the past four weeks, representing a 4.6% increase year-over-year.
Breaking it down:
Gasoline demand rose modestly by 1.2%, reflecting steady consumer activity.
Distillate demand jumped 4.8%, likely driven by industrial and freight sectors.
Jet fuel demand, however, declined by 4.6%, hinting at possible softness in air travel or seasonal adjustments.
Prices Surge Across the Board
Perhaps the most striking development is the sharp rise in energy prices:
West Texas Intermediate (WTI) crude oil climbed to $98.42 per barrel, up $12.51 in just one week and more than $34 higher than a year ago.
Retail gasoline prices reached a national average of $4.123 per gallon, nearly a dollar higher than last year.
Diesel prices, while slightly down week-over-week, remain elevated at $5.351 per gallon, up $1.84 year-over-year.
Spot prices for gasoline and heating oil at New York Harbor also saw significant weekly increases, reinforcing the broader upward trend.
What It All Means
The current data paints a picture of an energy market under pressure. Declining inventories, rising demand (especially for distillates), and reduced imports are converging to push prices higher. While refinery activity remains stable, the drop in production suggests that supply may not be keeping pace with consumption.
For consumers, this likely means continued high fuel costs in the near term. For businesses, especially those reliant on transportation or logistics, elevated diesel prices could impact margins. And for policymakers, the balance between energy security and market stability remains a critical challenge.
Final Thoughts
As global and domestic factors continue to influence the energy sector, weekly reports like this provide valuable insight into short-term trends and long-term trajectories. Whether you're an investor, policymaker, or everyday consumer, keeping an eye on these indicators can help you better understand—and prepare for—what lies ahead in the energy market.
Disclaimer: This blog post is for informational purposes only and should not be construed as financial advice. Always conduct thorough research and consider seeking advice from a financial professional before making any investment decisions.
Source: https://www.eia.gov/petroleum/supply/weekly/archive/2026/2026_04_29/pdf/highlights.pdf
Start futures forex fx commodity news trading with Haawks G4A low latency machine-readable data, one of the fastest data feeds for DOE data.
Please let us know your feedback. If you are interested in timestamps, please send us an email to sales@haawks.com.