According to our analysis natural gas moved 39 ticks on DOE Natural Gas Storage Report (WNGSR) data on 7 May 2026.
Natural gas (39 ticks)
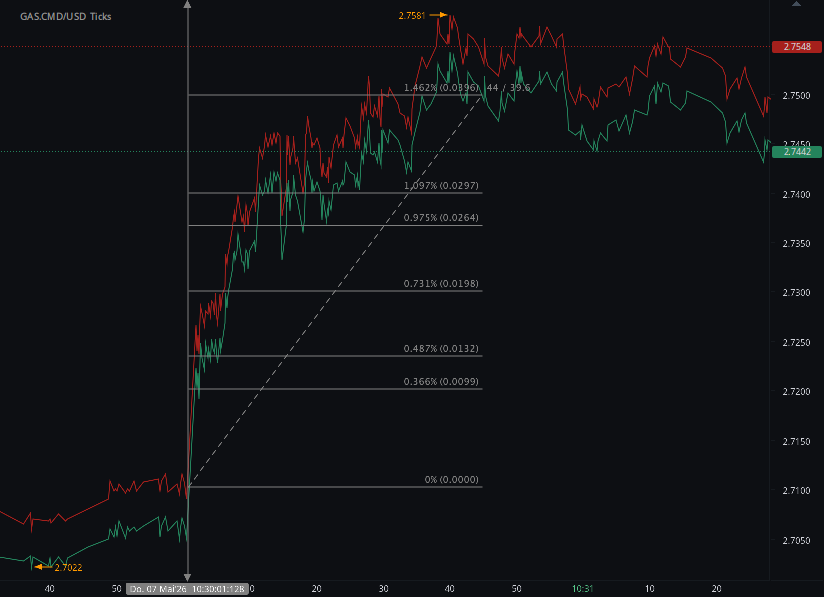
Charts are exported from JForex (Dukascopy).
U.S. Natural Gas Storage Builds by 63 Bcf, Staying Above the Five-Year Average
The U.S. natural gas storage season continued to gain momentum in the week ending May 1, 2026, with working gas inventories rising by 63 billion cubic feet (Bcf) from the previous week. According to the U.S. Energy Information Administration’s Weekly Natural Gas Storage Report, total working gas in underground storage across the Lower 48 states reached 2,205 Bcf.
That puts inventories 75 Bcf higher than the same week last year and 139 Bcf above the five-year average of 2,066 Bcf. In percentage terms, total stocks were 3.5% above year-ago levels and 6.7% above the five-year average.
While inventories remain comfortably within the five-year historical range, the latest report suggests that the market entered May with a relatively healthy storage cushion.
Regional Storage Trends
The weekly build was not evenly distributed across regions. Most areas posted increases, while the Mountain region recorded a small withdrawal.
The East region added 29 Bcf, bringing inventories to 361 Bcf. That level is nearly in line with the five-year average of 362 Bcf and slightly above last year’s 358 Bcf.
The Midwest saw a 23 Bcf increase, with stocks rising to 452 Bcf. Inventories there are just above last year’s level of 450 Bcf, though still 1.5% below the five-year average of 459 Bcf.
The Mountain region stood out with a 2 Bcf decline, leaving storage at 203 Bcf. Even with the weekly draw, this region remains well above historical benchmarks, sitting 13.4% above last year and 48.2% above the five-year average.
The Pacific region added 3 Bcf, bringing stocks to 275 Bcf. This is one of the strongest regional comparisons in the report, with inventories 19.0% above last year and 39.6% above the five-year average.
The South Central region, the largest storage region by volume, added 9 Bcf, bringing inventories to 914 Bcf. That is nearly flat compared with both last year and the five-year average, standing 0.2% above year-ago levels and 0.4% above the five-year average.
Within South Central, salt storage increased by 1 Bcf to 273 Bcf, while nonsalt storage rose by 7 Bcf to 641 Bcf. Salt storage remains 6.2% below last year and 1.4% below the five-year average, while nonsalt storage is above both comparisons.
What the Latest Build Means
The 63 Bcf injection reflects the seasonal transition from winter withdrawal season into spring and summer refill season. During this period, natural gas demand for heating typically declines, allowing more supply to move into underground storage ahead of the next winter.
The latest storage level of 2,205 Bcf suggests that the market is starting the refill season from a solid position. Inventories are not excessively high, but they are comfortably above both last year and the five-year average.
This matters because storage levels play a key role in shaping natural gas market expectations. Higher inventories can help reduce concerns about winter supply tightness, while lower inventories can increase price sensitivity to weather, production changes, and demand swings.
Regional Strength Is Concentrated in the West
One of the most notable details in the report is the strength of storage levels in the Mountain and Pacific regions. The Mountain region is almost 50% above its five-year average, while the Pacific region is nearly 40% above its five-year average.
By contrast, the East and Midwest are much closer to normal, and South Central is essentially in line with historical comparisons. This regional split suggests that national inventories are above average in part because of unusually strong storage positions in the western regions.
Bottom Line
For the week ending May 1, 2026, U.S. natural gas storage increased by 63 Bcf, bringing total working gas inventories to 2,205 Bcf. Stocks are now 75 Bcf above last year and 139 Bcf above the five-year average.
The report points to a generally well-supplied market as the injection season progresses. While regional differences remain, total inventories are within the five-year historical range and sitting above average heading into the warmer months.
Disclaimer: This blog post is for informational purposes only and should not be construed as financial advice. Always conduct thorough research and consider seeking advice from a financial professional before making any investment decisions.
Source: https://ir.eia.gov/ngs/ngs.html
Start futures forex fx commodity news trading with Haawks G4A low latency machine-readable data, one of the fastest data feeds for DOE data.
Please let us know your feedback. If you are interested in timestamps, please send us an email to sales@haawks.com.