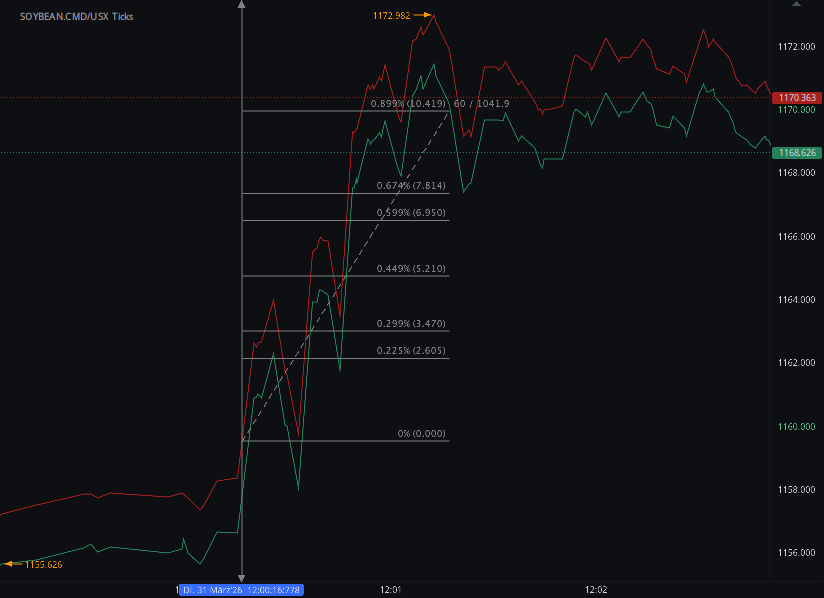
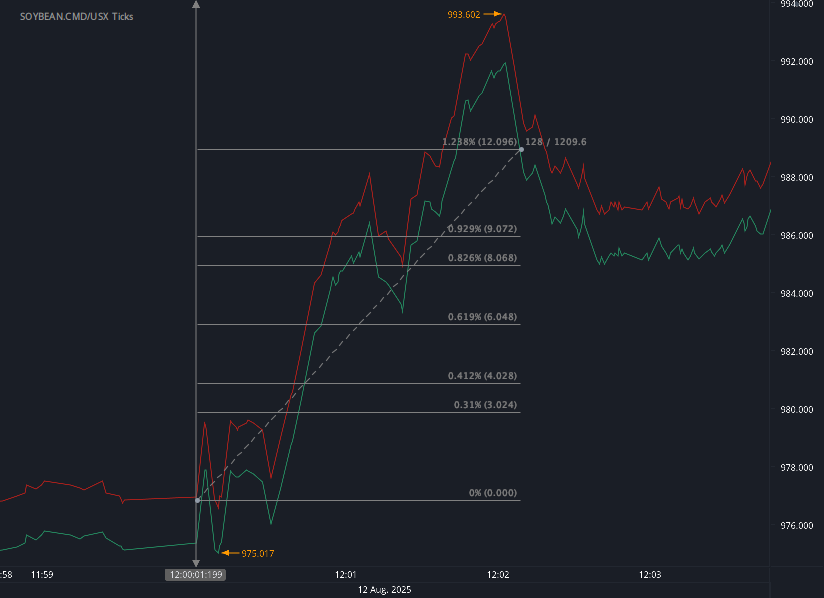
According to our analysis corn (ZC), wheat (ZW) and soybeans (ZS) futures prices moved around 28 / 40 / 48 ticks (total 116) on USDA Grain Stocks and USDA Acreage data on 30 June 2026.
Soybeans (48 ticks)
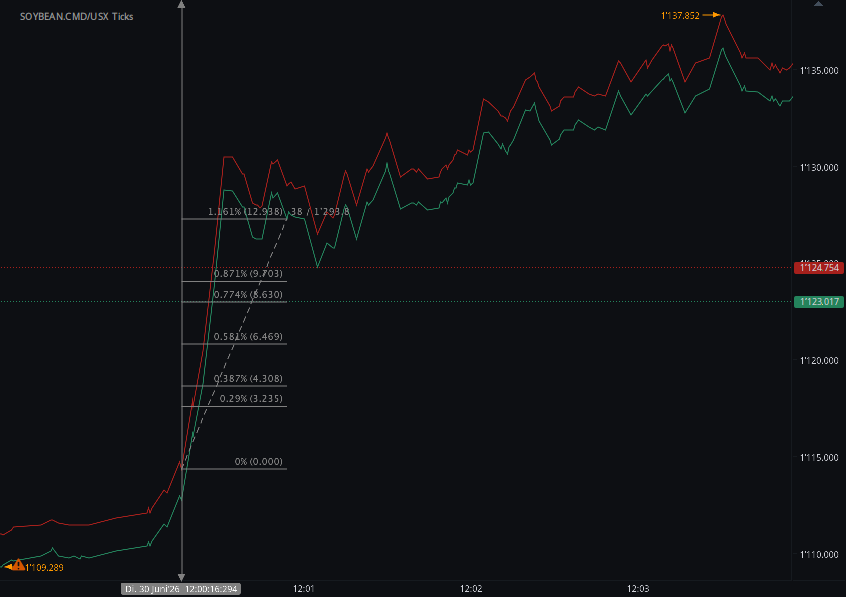
Charts are exported from JForex (Dukascopy).
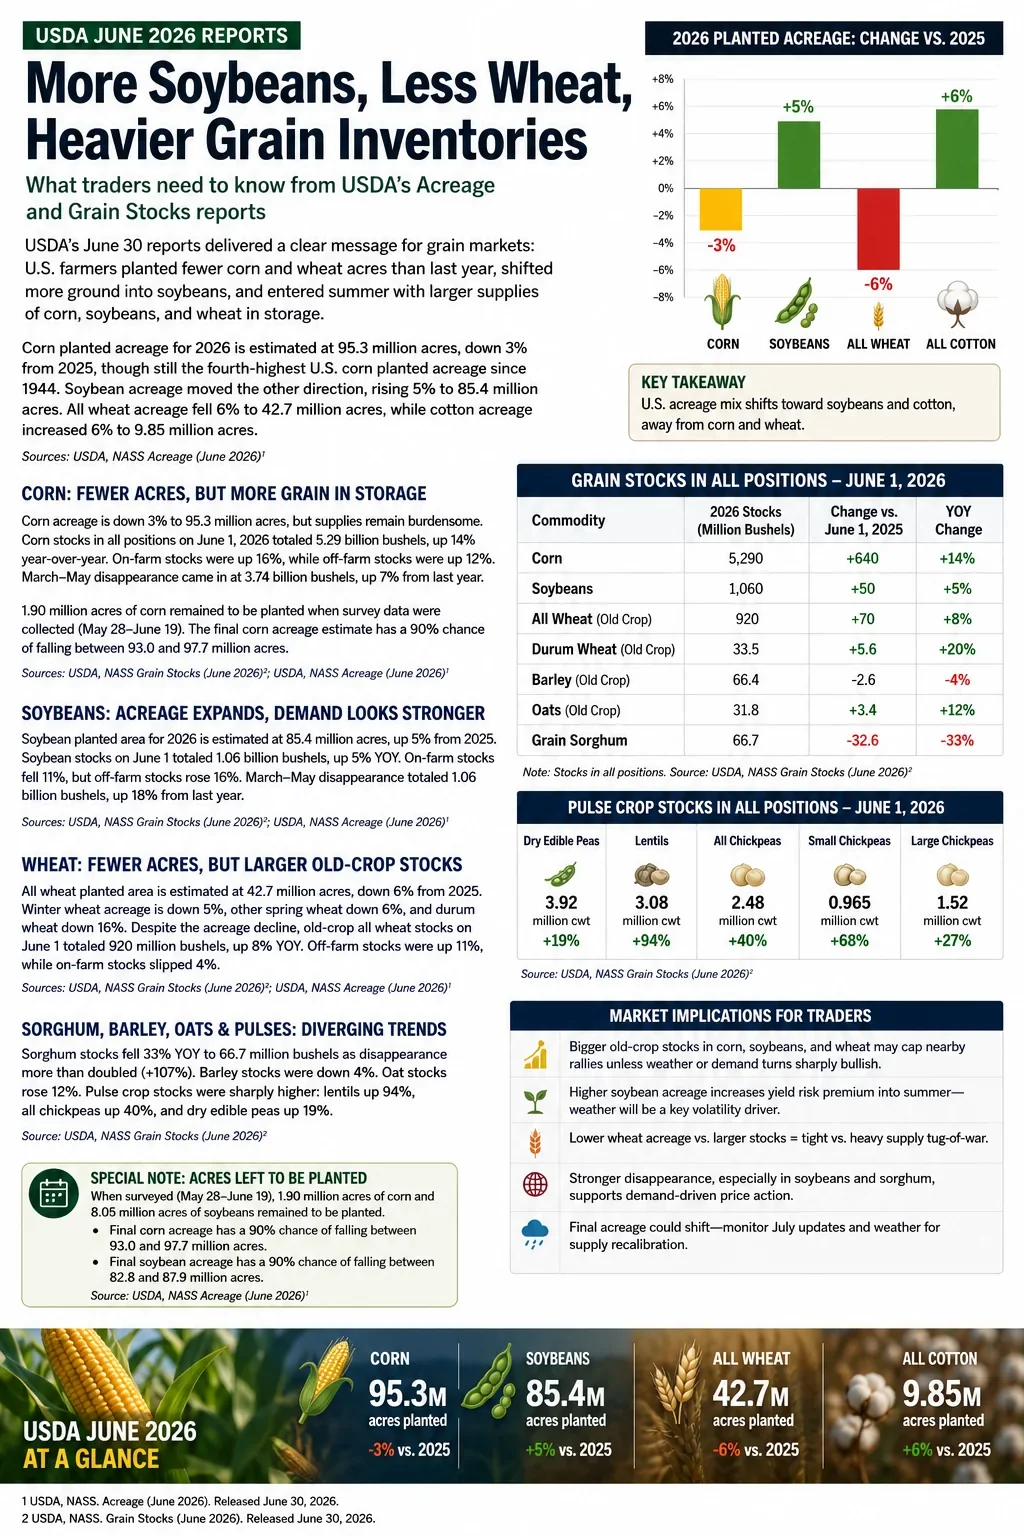
USDA June Data: Bearish Old-Crop Stocks Meet a New-Crop Acreage Reset
Meta description: USDA’s June 2026 Acreage and Grain Stocks reports give grain traders a fresh setup: heavier old-crop corn, soybean, and wheat stocks, lower corn and wheat acreage, and a larger soybean footprint heading into summer weather risk.
The Trade Setup
USDA’s June 30 Acreage and Grain Stocks reports gave traders a classic two-sided summer market: old-crop supplies look heavier, but new-crop acreage introduces fresh risk premium.
The headline acreage numbers were clear. Corn planted area is estimated at 95.3 million acres, down 3% from 2025. Soybean planted area rose 5% to 85.4 million acres. All wheat planted area dropped 6% to 42.7 million acres, while cotton acreage increased 6% to 9.85 million acres. USDA reported larger year-over-year inventories for the three major grain and oilseed contracts. June 1 corn stocks were 5.29 billion bushels, up 14% from last year. Soybean stocks were 1.06 billion bushels, up 5%. Old-crop all wheat stocks were 920 million bushels, up 8%.
For traders, the immediate read is not simply “bearish” or “bullish.” It is more nuanced: nearby supply is comfortable, but the acreage mix changes the sensitivity of new-crop balance sheets to July and August weather.
Corn: Stocks Lean Bearish, Acreage Keeps Weather Premium Alive
Corn gave the market a bearish old-crop signal. USDA’s 5.29 billion bushels of June 1 corn stocks were up 14% year over year. On-farm stocks rose 16%, while off-farm stocks rose 12%. March-May indicated disappearance was 3.74 billion bushels, compared with 3.50 billion during the same quarter last year.
That disappearance number shows demand wimply “bearish” or “bullish.” It is more nuanced: nearby supply is comfortable, but the acreage mix changes the sensitivity of new-crop balance sheets to July and August weather.
Corn: Stocks Lean Bearish, Acreage Keeps Weather Premium Alive
Corn gave the market a bearish old-crop signal. USDA’s 5.29 billion bushels of June 1 corn stocks were up 14% year over year. On-farm stocks rose 16%, while off-farm stocks rose 12%. March-May indicated disappearance was 3.74 billion bushels, compared with 3.50 billion during the same quarter last year.
That disappearance number shows demand was better than last year, but not enough to offset the larger supply cushion. The larger on-farm stock figure also matters for basis. If producers remain patient, cash markets may stay supported locally. If futures rally on weather and farmer selling accelerates, basis could soften quickly in surplus regions.
The acreage number complicates the bearish stocks story. Corn planted acreage at 95.3 million acres is down from last year, with harvested-for-grain acreage forecast at 87.4 million acres. USDA also noted that 1.90 million acres of corn were still left to be planted when survey data were collected, and that final planted acreage has a 90% historical range of 93.0 million to 97.7 million acres around the current estimate.
Trader read: Old-crop corn stocks cap nearby rallies, but lower acreage means December corn can still build weather premium quickly if forecasts turn hot and dry. The cleanest trade lens is old-crop pressure versus new-crop weather optionality.
Soybeans: Acreage Expands, But Demand Is the Bullish Detail
Soybeans delivered a larger acreage number, which is naturally bearish for new-crop supply assumptions. USDA estimated soybean planted acreage at 85.4 million acres, up 5% from 2025, with harvested acreage forecast at 84.4 million acres.
But the stocks report was not one-dimensional. June 1 soybean stocks were **1.06 bDecember corn can still build weather premium quickly if forecasts turn hot and dry. The cleanest trade lens is old-crop pressure versus new-crop weather optionality.
Soybeans: Acreage Expands, But Demand Is the Bullish Detail
Soybeans delivered a larger acreage number, which is naturally bearish for new-crop supply assumptions. USDA estimated soybean planted acreage at 85.4 million acres, up 5% from 2025, with harvested acreage forecast at 84.4 million acres.
But the stocks report was not one-dimensional. June 1 soybean stocks were 1.06 billion bushels, up 5% from last year. However, on-farm stocks were down 11%, while off-farm stocks rose 16%. March-May indicated disappearance was also 1.06 billion bushels, up 18% from the same period a year earlier.
That stronger disappearance figure is the key for traders. Expanded acres pressure the new-crop balances been active enough to keep the bull case alive, especially if crush margins, export demand, or weather risk tighten the forward outlook.
USDA also reported 8.05 million soybean acres left to be planted during the survey window, and the final soybean planted acreage estimate has a 90% historical range of 82.8 million to 87.9 million acres around the current estimate.
Trader read: November soybeans may struggle if weather is benign, but demand signals make the market vulnerable to sharp rallies if August weather turns threatening. Soybean spreads may remain especially sensitive to crush demand and export headlines.
Wheat: Lower Acres Versus Larger Stocks
Wheat has the clearest acreage contraction. USDA estimated all wheat planted area at 42.7 million acres, down 6% from 2025. Winter wheat area was 31.5 million acres, down 5%, while other spring wheat fell 6% and Durum acreage dropped 16%.
At the same time, old-crop wheat stocks were not tight. USDA reported 920 million bushels of old-crop all wheat in storage as of June 1, up *ather turns threatening. Soybean spreads may remain especially sensitive to crush demand and export headlines.
Wheat: Lower Acres Versus Larger Stocks
Wheat has the clearest acreage contraction. USDA estimated all wheat planted area at 42.7 million acres, down 6% from 2025. Winter wheat area was 31.5 million acres, down 5%, while other spring wheat fell 6% and Durum acreage dropped 16%.
At the same time, old-crop wheat stocks were not tight. USDA reported 920 million bushels of old-crop all wheat in storage as of June 1, up 8% from a year earlier. On-farm stocks were down 4%, but off-farm stocks were up 11%.
For futures, that mix argues for caution chasing rallies that are based only on acreage. Lower acres matter, but higher old-crop stocks reduce urgency unless yield, quality, export demand, or global wheat news adds fuel.
Trader read: Wheat needs a catalyst. Lower acreage supports the structure, but larger inventories make weather and export demand the deciding variables.
Sorghum and Pulses: Smaller Markets, Bigger Percentage Moves
Sorghum was one of the sharper stocks stories. June 1 grain sorghum stocks totaled 66.7 million bushels, down 33% from a year ago. March-May indicated disappearance was 105 million bushels, up 107% from the same period last year.
That is a meaningful tightening signal, even if sorghum does not drive the main board the way corn, soybeans, and wheat do. Regional feed demand, export interest, and relative value against corn could become more important.
Pulse crop stocks also moved sharply. Lentil stocks were up 94%, all chickpea stocks were up 40%, and dry edible pea stocks were up 19% from June 1, 2025.
Trader read: These markets matter most for regional cash trade and specialty-crop pricing, but the percentage changes are too large to ignore.
What Traders Should Watch Next
The June reports shift at, or global wheat news adds fuel.
Trader read: Wheat needs a catalyst. Lower acreage supports the structure, but larger inventories make weather and export demand the deciding variables.
Sorghum and Pulses: Smaller Markets, Bigger Percentage Moves
Sorghum was one of the sharper stocks stories. June 1 grain sorghum stocks totaled 66.7 million bushels, down 33% from a year ago. March-May indicated disappearance was 105 million bushels, up 107% from the same period last year.
That is a meaningful tightening signal, even if sorghum does not drive the main board the way corn, soybeans, and wheat do. Regional feed demand, export interest, and relative value against corn could become more important.
Pulse crop stocks also moved sharply. Lentil stocks were up 94%, all chickpea stocks were up 40%, and dry edible pea stocks were up 19% from June 1, 2025.
Trader read: These markets matter most for regional cash trade and specialty-crop pricing, but the percentage changes are too large to ignore.
What Traders Should Watch Next
The June reports shift attention to three market drivers.
First, weather now carries more weight for corn and soybeans. Corn acreage is lower, soybean acreage is higher, and both final acreage estimates still have uncertainty because survey data were collected before planting was fully complete.
Second, basis behavior will matter. Larger corn and wheat stocks can pressure cash markets, especially if futures rallies trigger farmer selling. Soybeans are more complicated because total stocks are higher, but on-farm stocks are lower and spring disappearance was strong.
Third, spreads may tell the story before flat price does. Heavy old-crop stocks argue against panic in nearby supply, while new-crop acreage and weather risk create room for volatility farther out the curve.
Bottom Line
USDA’s June numbers are not a directional signal. They are a volatility setup.
Corn carries bearish old-crop stocks but still has new-crop weather risk. Soybeans gained acres, but demand has been strong enough to keep traders alert. Wheat lost acreage, but larger old-crop stocks mean rallies need confirmation from weather, quality, or export demand.
The practical takeaway for traders: respect the supply cushion, but do not ignore the summer risk premium. The market now moves from acreage math to weather execution.
Disclaimer: This blog post is for informational purposes only and should not be construed as financial advice. Always conduct thorough research and consider seeking advice from a financial professional before making any investment decisions.
Sources: https://esmis.nal.usda.gov/sites/default/release-files/795959/grst0626.pdf, https://esmis.nal.usda.gov/sites/default/release-files/795961/acrg0626.pdf
Haawks G4A is one of the fastest machine-readable data feeds for USDA data. We are beating big names in the industry by seconds. Coverage includes monthly USDA WASDE (World Agricultural Supply and Demand Estimates), quarterly USDA Grain Stocks, yearly USDA Prospective Plantings and USDA Acreage and weekly USDA Crop Progress.
Please let us know your feedback. If you are interested in timestamps, please send us an email to sales@haawks.com.