According to our analysis natural gas moved 19 ticks on DOE Natural Gas Storage Report data on 7 August 2025.
Natural gas (19 ticks)
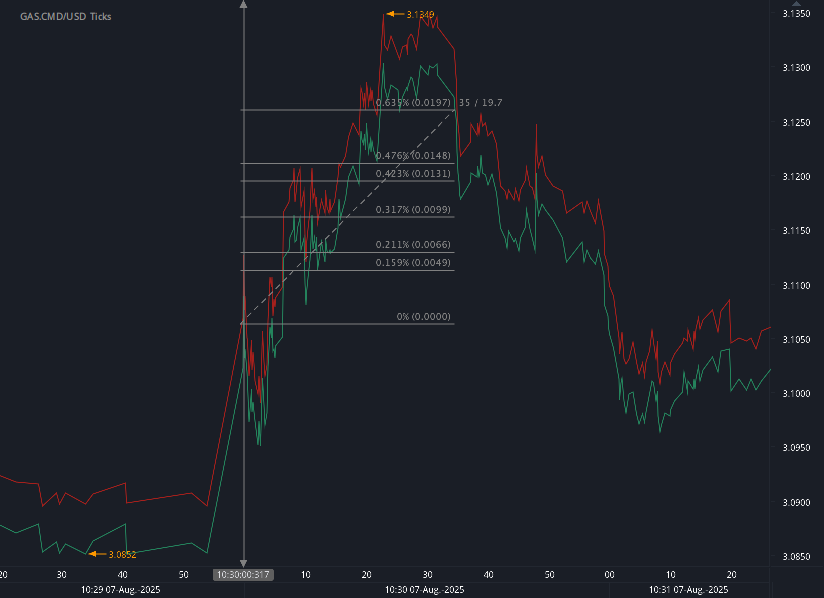
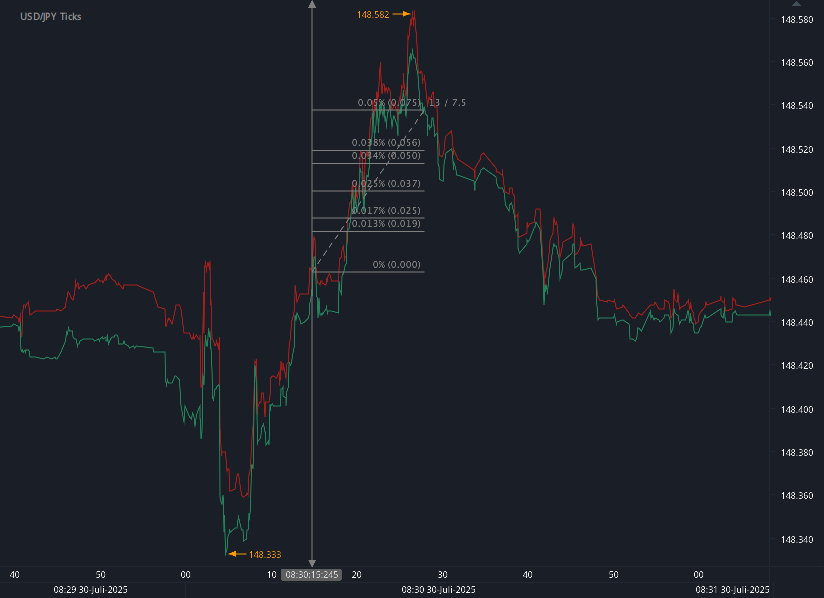
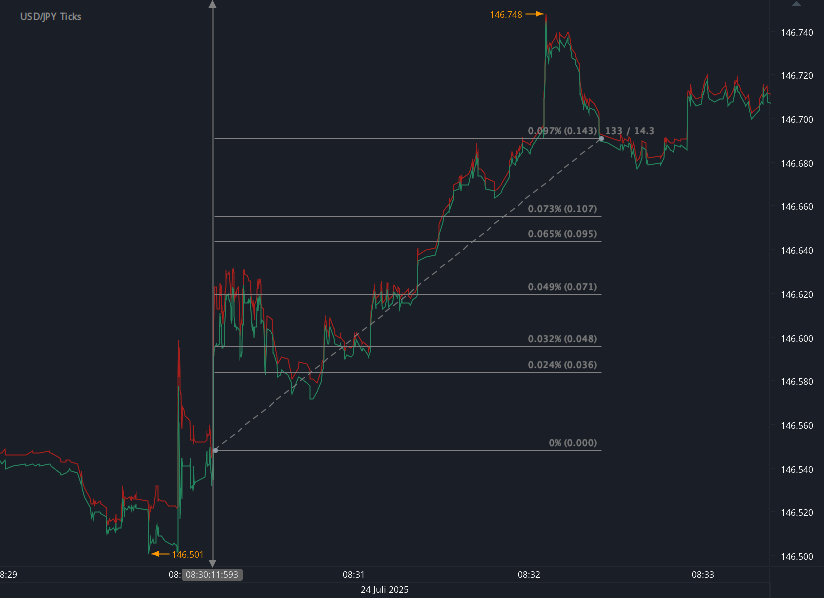
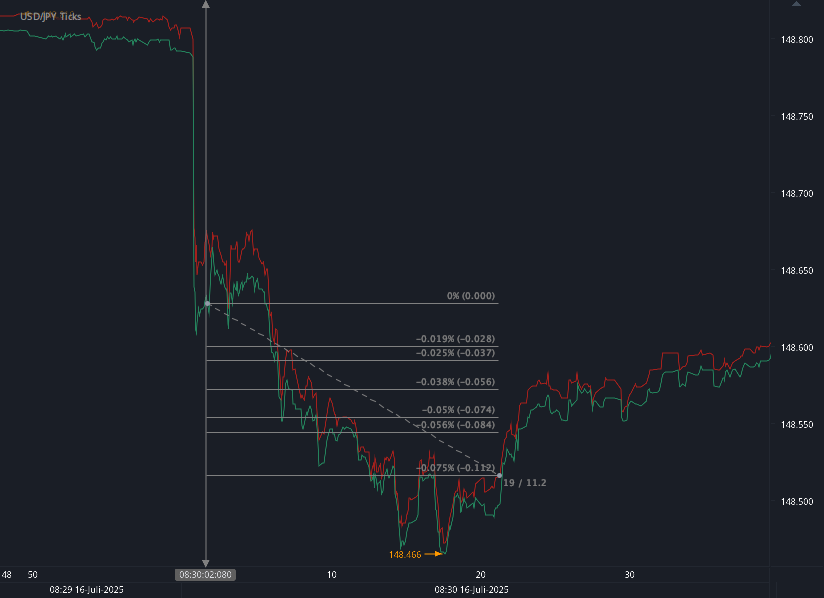
Charts are exported from JForex (Dukascopy).
Weekly Natural Gas Storage Update – August 7, 2025
Slight Build in Storage as Total Remains Above Five-Year Average
The U.S. Energy Information Administration (EIA) released its Weekly Natural Gas Storage Report today, covering storage levels as of August 1, 2025. The data reveals a modest net increase of 7 billion cubic feet (Bcf) in working natural gas storage across the Lower 48 states, bringing the total to 3,130 Bcf.
While this weekly increase is relatively small, the total stock remains 173 Bcf above the five-year average and 137 Bcf below the level at the same time last year.
Regional Highlights
East Region: Added 5 Bcf, now at 656 Bcf
Midwest Region: Increased by 10 Bcf to 775 Bcf
Mountain Region: Rose 6 Bcf to 249 Bcf
Pacific Region: Added 3 Bcf, reaching 305 Bcf
South Central Region: Notably drew down 17 Bcf, dropping to 1,145 Bcf
Salt facilities led this decrease with a 20 Bcf draw
Nonsalt facilities added 3 Bcf
Despite the overall increase, the South Central region’s withdrawal stands out, likely influenced by elevated cooling demand or shifting regional market dynamics.
Year-Over-Year and Historical Comparisons
Total working gas is 4.2% below the level from this time last year (3,267 Bcf in 2024)
However, storage remains 5.9% above the five-year average of 2,957 Bcf (2020–2024)
All regional storage levels remain within historical five-year ranges
What This Means
Natural gas storage is a critical indicator for energy markets, especially heading into the fall shoulder season. While we're seeing slight weekly builds, the below-average year-over-year total suggests tighter supply compared to 2024, possibly impacting prices if demand spikes due to weather or market shifts.
However, the continued surplus over the five-year average provides a buffer against potential volatility.
Looking Ahead
The next Weekly Natural Gas Storage Report will be released on August 14, 2025, and will cover storage data through August 8, 2025. Traders, utilities, and analysts will be closely monitoring updates to assess storage sufficiency ahead of the upcoming winter season.
Disclaimer: This blog post is for informational purposes only and should not be construed as financial advice. Always conduct thorough research and consider seeking advice from a financial professional before making any investment decisions.
Source: https://ir.eia.gov/ngs/ngs.html
Start futures forex fx commodity news trading with Haawks G4A low latency machine-readable data, one of the fastest data feeds for DOE data.
Please let us know your feedback. If you are interested in timestamps, please send us an email to sales@haawks.com.