
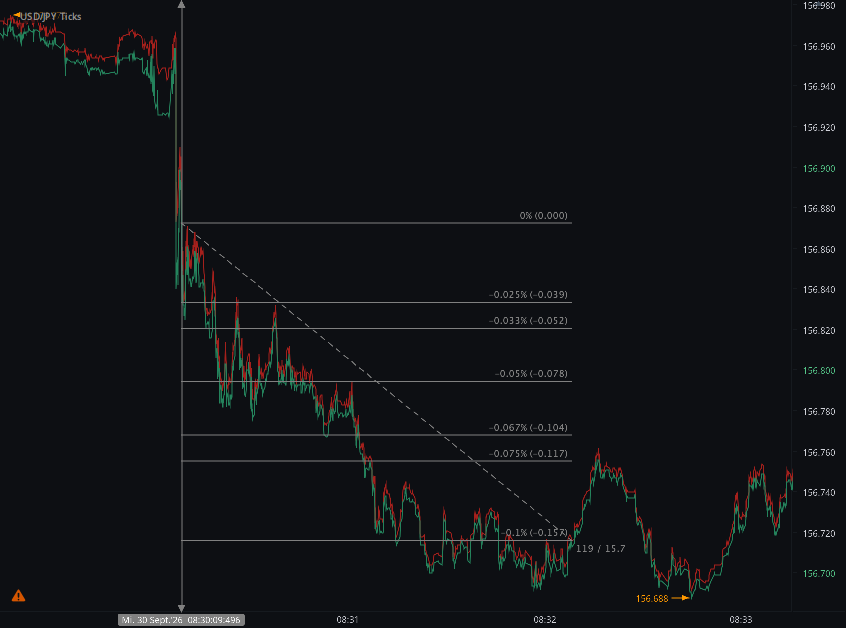
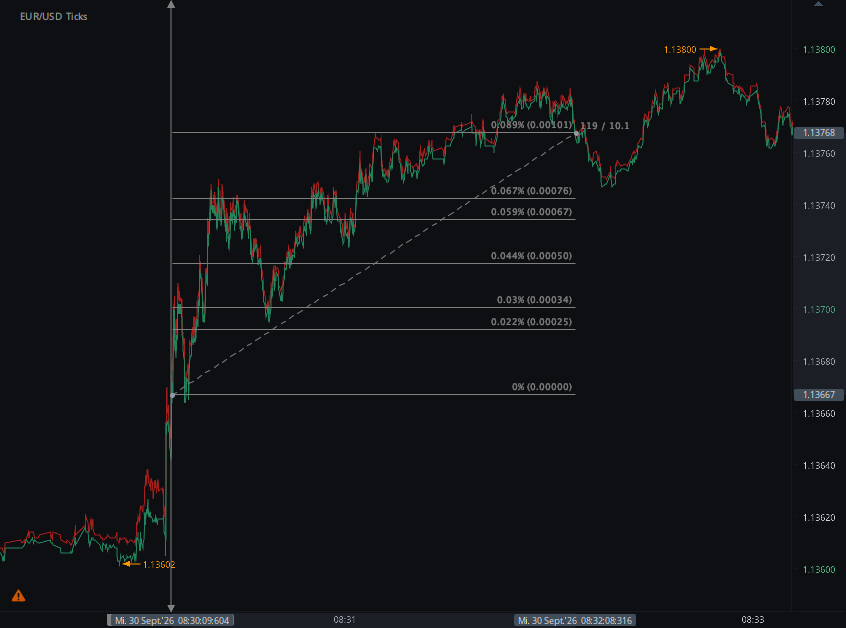
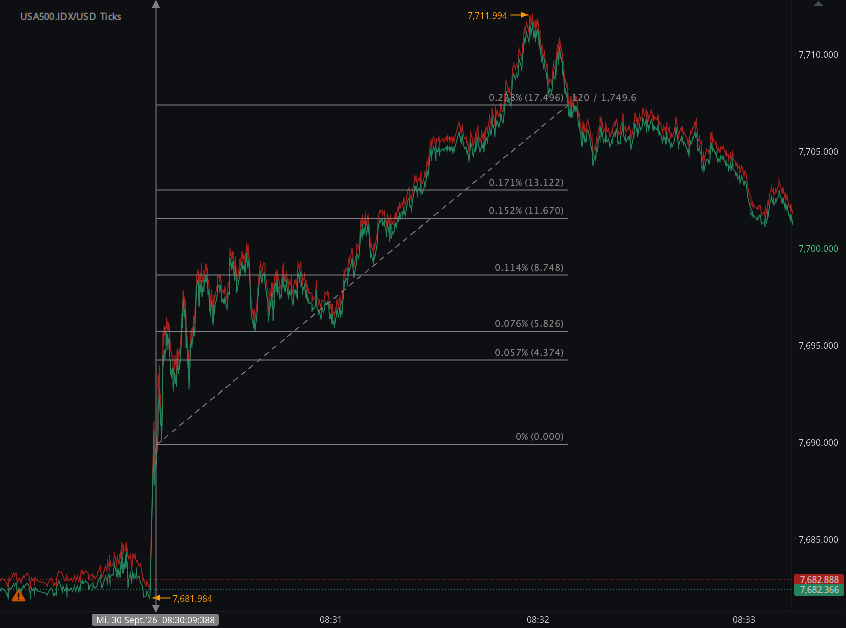
According to our analysis USDJPY moved 15 pips, EURUSD moved 10 pips, US500 moved 68 ticks and XAUUSD 15 points (93 ticks, gold 15 points total) on US BEA Personal Income and Outlays and US BEA Gross Domestic Production (GDP) data on 30 September 2026.
USDJPY (15 pips)
EURUSD (10 pips)
US500 (68 ticks)
XAUUSD (15 points)
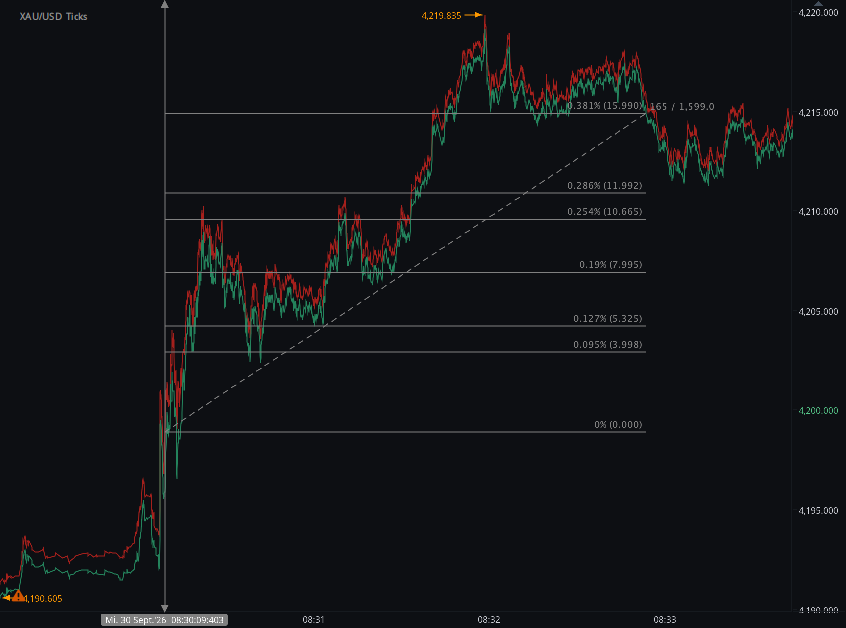
Charts are exported from JForex (Dukascopy).
Softer PCE Inflation Drives Dollar Lower as US500 and Gold Rally
August PCE inflation undershot expectations while the third estimate of second-quarter U.S. GDP was revised sharply higher. The simultaneous BEA releases produced an immediate cross-asset repricing in FX, equities and gold.
Two major U.S. macroeconomic releases hit institutional trading systems simultaneously at 8:30 a.m. ET on September 30: August Personal Income and Outlays, including the Federal Reserve's preferred PCE inflation measures, and the third estimate of second-quarter GDP.
The combined signal was unusual. Inflation was softer than expected, while economic growth was revised materially higher.
In the first minutes after the release, markets appeared to give greater weight to the inflation surprise and its implications for Federal Reserve policy.
HAAWKS measured an immediate 10-tick rise in EUR/USD, 15-tick decline in USD/JPY, 68-tick rise in US500 and 15-point rise in XAU/USD.
Immediate Cross-Asset Reaction
| Instrument | HAAWKS Measured Move | Direction | Institutional Interpretation |
|---|---|---|---|
| EUR/USD | 10 ticks | Higher | Broadly consistent with a softer U.S. dollar following the lower-than-expected PCE inflation readings. |
| USD/JPY | 15 ticks | Lower | Reinforced the initial USD-negative interpretation across major FX pairs. |
| US500 | 68 ticks | Higher | Lower expected policy-rate pressure initially supported equity valuations. |
| XAU/USD | 15 points | Higher | Gold benefited from the initial decline in U.S. rate expectations and dollar weakness. |
August PCE: The Dominant Release-Window Signal
The principal inflation measures came in below market expectations. Headline PCE increased 0.3% month over month, compared with a Reuters consensus estimate of 0.4%.
On a year-over-year basis, headline PCE inflation was 3.4%, below the approximately 3.7% expected before the release.
Core PCE, which excludes food and energy and receives particular attention from Federal Reserve policymakers, rose 0.2% month over month and 3.0% year over year.
HAAWKS view: for the first market reaction, the inflation surprise carried greater policy relevance than the backward-looking GDP revision. The combination of EUR/USD higher, USD/JPY lower, US500 higher and gold higher is consistent with the market initially reducing the probability of additional near-term Federal Reserve tightening.
An Important Institutional Caveat: The PCE Data Were Revised
The September 30 release was not a standard monthly update in isolation. It incorporated BEA's 2026 annual update of the National Economic Accounts, with revisions to personal income, spending and inflation estimates beginning in January 2021.
That distinction matters for systematic interpretation.
July headline PCE inflation was revised down to 0.1% month over month, while July core PCE was also revised to 0.1%.
Reuters reported that methodology changes affecting areas including portfolio-management services, software and legal services contributed materially to lower historical inflation readings.
The Consumer Remained Exceptionally Strong
The inflation data were softer, but the broader household data were not weak.
Nominal personal consumption expenditures increased 0.9% in August, equivalent to a $190.8 billion increase.
Inflation-adjusted real PCE increased 0.6%, indicating that the spending acceleration was not merely a function of higher prices.
Personal income increased only 0.2%, while disposable personal income increased 0.3%. Real disposable income was unchanged.
The personal saving rate declined to 4.1%, showing that the strength in consumption was accompanied by a lower share of disposable income being saved.
| August Household Measure | BEA Result | Institutional Read-Through |
|---|---|---|
| Personal Income | +0.2% | Income growth remained positive but materially lagged consumption growth. |
| Disposable Personal Income | +0.3% | Moderate nominal household-income growth. |
| Real DPI | 0.0% | No monthly increase in inflation-adjusted disposable income. |
| Nominal PCE | +0.9% | Very strong consumer spending despite elevated borrowing costs. |
| Real PCE | +0.6% | Indicates genuine volume growth rather than only price effects. |
| Saving Rate | 4.1% | Household spending growth continued to outpace income growth. |
GDP Delivered a Powerful Counter-Signal
At exactly the same 8:30 a.m. ET release time, BEA published its third estimate of second-quarter GDP.
Real GDP growth was revised sharply higher to an annualized 2.2%, compared with 1.5% in the second estimate.
The 0.7-percentage-point upward revision reflected stronger investment, consumer spending and government spending.
| Q2 U.S. Measure | Second Estimate | Third Estimate | Institutional Significance |
|---|---|---|---|
| Real GDP | 1.5% | 2.2% | Material upward revision to aggregate economic growth. |
| Real Final Sales to Private Domestic Purchasers | 4.2% | 4.6% | Strong underlying private domestic demand. |
| Real GDI | 2.2% | 2.6% | Income-side measure also pointed to firmer activity. |
| Average of GDP and GDI | 1.8% | 2.4% | Broader confirmation that Q2 activity was stronger than previously estimated. |
Underlying Domestic Demand Was Stronger Than Headline GDP
For institutional macro investors, the composition of GDP may be more informative than the headline 2.2% figure.
Real final sales to private domestic purchasers — consumer spending plus private fixed investment — increased at a 4.6% annualized rate.
This measure removes several volatile components of GDP and provides a cleaner indication of underlying private domestic demand.
BEA attributed the Q2 GDP expansion to consumer spending, investment and exports, while increased imports subtracted from the headline calculation.
Among industries, the strongest contributors included real estate and rental and leasing, information, durable-goods manufacturing, and finance and insurance.
Corporate Profits Added to the Growth Signal
Profits from current production increased by $384.0 billion in the second quarter, although that figure was revised down by $16.9 billion from the previous estimate.
The combination of stronger consumer activity, investment and corporate earnings helps explain why the GDP release offered a distinctly growth-positive counterweight to the softer inflation figures.
Why the Inflation Signal Won the First Policy Repricing
Inflation Undershot Expectations
Headline monthly PCE rose 0.3% versus a 0.4% Reuters consensus, while the annual rate was 3.4% versus approximately 3.7% expected.
The Data Were Directly Relevant to the Fed
PCE inflation is the Federal Reserve's preferred consumer-inflation framework, making an inflation surprise immediately relevant to policy-rate pricing.
GDP Was Backward Looking
The 2.2% GDP figure described activity during April through June. The August PCE data provided more recent information about the inflation environment.
Growth Remained a Hawkish Counterweight
Strong consumption, a 4.6% increase in private domestic final sales and the GDP revision argue against interpreting the release as a simple growth slowdown.
Institutional takeaway: this was closer to a "soft inflation, strong demand" configuration than a straightforward dovish macro release. The first price response favored the inflation signal, but the underlying growth data remained too strong to justify treating the report as an unambiguously weak U.S. macro outcome.
Federal Reserve Expectations Repriced Lower
The immediate rates-market response reinforced the cross-asset signal.
Reuters reported that the implied probability of another Federal Reserve rate increase at the October meeting fell to approximately 41.5% after the data, from roughly 51.5% immediately beforehand.
U.S. Treasury yields initially declined and the dollar weakened, consistent with the HAAWKS FX, equity and gold observations.
That repricing did not eliminate the possibility of additional tightening. Inflation remained above the Federal Reserve's longer-run objective and household demand remained exceptionally resilient.
One Timestamp, Multiple Macro Signals
September 30 also illustrates a problem that matters directly to institutional news-trading infrastructure: multiple high-value data sets can be released at precisely the same timestamp.
At 8:30 a.m. ET, systems were required to process not merely one PCE figure but a large matrix of information including:
| Data Family | Examples of Relevant Fields | Primary Market Channel |
|---|---|---|
| PCE Inflation | Headline MoM, headline YoY, core MoM, core YoY | Federal Reserve policy expectations |
| Household Income | Personal income, disposable income, real DPI | Household purchasing capacity |
| Consumer Spending | Nominal PCE, real PCE, goods and services | Current-quarter growth expectations |
| GDP | Real GDP, final sales, investment, consumption | Growth and policy outlook |
| GDI | Real GDI and GDP/GDI average | Confirmation of economic activity |
| Corporate Profits | Current-production profits and industry measures | Equity and growth fundamentals |
Implications for Institutional News-Trading Systems
Field-Level Parsing Is Essential
A system reacting only to headline PCE could miss the interaction among core inflation, spending, income, GDP revisions and prior-period revisions.
Release Vintage Must Be Preserved
The 2026 annual update changed historical PCE and GDP estimates. Institutional research and systematic backtesting therefore need to distinguish the data available in real time from subsequently revised historical series.
Surprise Direction Is Not Enough
Softer inflation was dovish, while stronger GDP and spending were comparatively hawkish. A robust model needs to evaluate the magnitude, timeliness and policy relevance of competing surprises.
Cross-Asset Confirmation Adds Information
EUR/USD higher, USD/JPY lower, gold higher and equities higher provided a coherent initial cross-asset signal consistent with reduced near-term U.S. rate expectations.
Release-Window Movement Is Not Full-Session Performance
HAAWKS measurements isolate the immediate market response to the scheduled release. Subsequent price action incorporates liquidity, positioning, policy commentary and additional economic information.
Immediate Reaction vs. the Full Trading Session
The initial response should not be confused with the eventual daily close.
HAAWKS measured a strong 68-tick US500 increase during the release window, reflecting the first repricing of the new information.
The broader U.S. equity session subsequently became more mixed as investors continued to digest the strength of economic activity and elevated longer-term interest rates.
This distinction is central to institutional event analysis: release-window attribution asks a different question from end-of-day market attribution.
HAAWKS Conclusion
The September 30 BEA releases delivered one of the more complex U.S. macro combinations for systematic news traders: softer inflation alongside substantially stronger growth and exceptionally resilient consumer spending.
August headline PCE increased 0.3% month over month and 3.4% year over year, while core PCE increased 0.2% and 3.0%, respectively.
At the same time, second-quarter real GDP was revised from 1.5% to 2.2%, real final sales to private domestic purchasers increased 4.6%, and August nominal consumer spending surged 0.9%.
The market's initial interpretation nevertheless leaned toward the inflation side of the release.
HAAWKS measured EUR/USD +10 ticks, USD/JPY −15 ticks, US500 +68 ticks and XAU/USD +15 points in the immediate release window.
For institutional trading systems, the event demonstrates why a simultaneous macro release cannot be reduced to one headline field. Current values, consensus expectations, prior revisions, annual benchmarking, growth composition and cross-asset confirmation all need to be evaluated while the market is repricing.
Low-Latency Data. Structured Intelligence. Institutional Execution.
Low-Latency Macro Data for Institutional Markets
HAAWKS G4A provides structured, machine-readable macroeconomic and commodity data covering the United States, Canada and Europe.
The feed is designed for professional news-trading desks, systematic macro strategies and latency-sensitive applications that require field-level data immediately when official releases become public.
API access is available through infrastructure in Chicago, New York and London. Free trials are available for qualified professional users.
Explore HAAWKS G4A Low-Latency DataSources
-
U.S. Bureau of Economic Analysis —
Personal Income and Outlays, August 2026
Official source for personal income, consumer spending, headline and core PCE inflation and the personal saving rate. -
U.S. Bureau of Economic Analysis —
GDP Third Estimate, Industries and Corporate Profits,
Second Quarter 2026
Official source for real GDP, GDI, private domestic final sales, corporate profits and industry-level revisions. -
Reuters — U.S. Inflation Rises Less Than Expected in August
Used for market consensus, Federal Reserve pricing and post-release rates and FX context. -
HAAWKS internal tick-chart analysis —
September 30, 2026
Source for the measured immediate release-window reactions: EUR/USD +10 ticks, USD/JPY −15 ticks, US500 +68 ticks and XAU/USD +15 points.
Built for traders who compete on speed. HAAWKS G4A delivers low-latency, machine-readable macroeconomic and commodity data via API infrastructure in Chicago, New York and London. Explore the feed, share your feedback, or contact us to request a free trial for financial institutions.
