
According to our analysis WTI crude oil moved 24 ticks on DOE Weekly Petroleum Status Report (WPSR) data on 30 September 2026.
WTI crude oil (24 ticks)
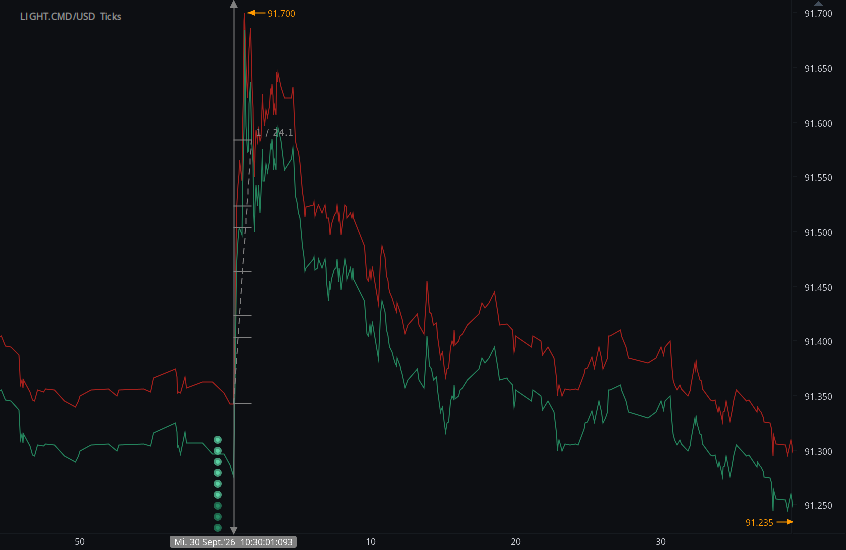
Charts are exported from JForex (Dukascopy).
WTI Rises 24 Ticks as Sharp Product Draws Offset an Unexpected Crude Build
The September 30 EIA petroleum release delivered conflicting inventory signals: U.S. commercial crude stocks unexpectedly increased, while gasoline and distillate inventories fell substantially more than expected.
The September 30 U.S. Energy Information Administration petroleum release presented professional commodity desks with a distinctly two-sided inventory signal.
Commercial crude oil inventories increased by 922,000 barrels during the week ending September 25, directly opposing expectations for an inventory draw.
The refined-product side of the balance sheet, however, told a very different story.
Gasoline inventories declined by approximately 1.7 million barrels, while distillate stocks fell by approximately 2.3 million barrels. Both draws were significantly larger than market expectations.
Inventory Results vs. Market Expectations
| Petroleum Field | Market Expectation | EIA Actual | Surprise | Market Read-Through |
|---|---|---|---|---|
| Commercial Crude Oil | −0.264M barrels | +0.922M barrels | Build vs. expected draw | Negative for the crude balance in isolation. |
| Gasoline | −0.485M barrels | −1.7M barrels | Larger draw | Supportive product-market signal and substantially tighter than consensus. |
| Distillates | −0.190M barrels | −2.3M barrels | Much larger draw | Particularly relevant given already constrained diesel and heating-oil inventories. |
| Cushing, Oklahoma | — | +0.553M barrels | Build | A negative counter-signal at the NYMEX WTI delivery hub. |
WTI Moves 24 Ticks Higher
HAAWKS tick-level analysis recorded a rapid upward response in WTI immediately following the scheduled petroleum release.
Measured during the immediate release window following the September 30, 2026 EIA petroleum data.
The move is notable because the crude inventory headline itself was weaker than expected.
A model reacting only to the commercial crude figure would have seen a 922,000-barrel build against expectations for a 264,000-barrel draw. That represents a swing of almost 1.2 million barrels relative to consensus.
Yet WTI initially moved higher. The broader petroleum balance helps explain why.
The Product Draws Were the More Important Tightness Signal
Gasoline and distillates both delivered materially larger inventory draws than expected.
Gasoline stocks fell from approximately 206.0 million barrels to 204.4 million barrels, a decline of about 1.7 million barrels.
Distillate inventories fell from approximately 107.4 million barrels to 105.2 million barrels, a decline of roughly 2.3 million barrels.
The absolute stock levels are also relevant. Gasoline inventories remained approximately 7% below their five-year seasonal average, while distillate inventories were approximately 14% below the five-year average.
HAAWKS view: the crude build weakened the upstream inventory signal, but the significantly larger-than-expected gasoline and distillate draws reinforced an already tight refined-product market. For WTI pricing, the complete petroleum balance carried more information than the crude headline alone.
Total Commercial Petroleum Inventories Fell 7 Million Barrels
Another important detail is that aggregate commercial petroleum stocks declined despite the rise in crude inventories.
EIA data showed total petroleum stocks excluding the Strategic Petroleum Reserve falling from approximately 1.2514 billion barrels to 1.2443 billion barrels.
That represents a weekly decline of approximately 7.0 million barrels.
| Inventory Measure | Current Week | Previous Week | Weekly Change |
|---|---|---|---|
| Commercial Crude | 427.3M barrels | 426.4M barrels | +0.9M |
| Gasoline | 204.4M barrels | 206.0M barrels | −1.7M |
| Distillates | 105.2M barrels | 107.4M barrels | −2.3M |
| Total Commercial Stocks ex-SPR | 1,244.3M barrels | 1,251.4M barrels | −7.0M |
This is one reason the petroleum release should be evaluated as a multi-variable balance rather than as a single crude-inventory number.
Lower Refinery Runs Help Explain the Inventory Split
U.S. refinery activity slowed meaningfully during the reporting week.
Refinery crude inputs fell by approximately 554,000 barrels per day to 16.257 million barrels per day.
Refinery utilization declined by 1.5 percentage points to 92.5%.
This combination provides an important explanation for the apparently contradictory stock movements.
Lower refinery throughput reduces the amount of crude being processed, which can contribute to a build in crude stocks. At the same time, lower refinery output can tighten gasoline and distillate inventories.
Cushing Added a Negative Counter-Signal
Crude inventories at Cushing, Oklahoma increased by approximately 553,000 barrels.
EIA data put Cushing stocks at approximately 24.3 million barrels, up from about 23.7 million barrels one week earlier.
Cushing deserves separate attention because it is the designated delivery location for NYMEX WTI futures.
In this release, Cushing reinforced the negative crude-inventory signal, making the upward WTI response even more notable and highlighting the importance of the product-market data.
Crude Supply and Flow Data
The EIA overview also provided useful information on production, imports, exports and refinery demand.
| U.S. Crude Measure | Current Week | Previous Week | Weekly Change |
|---|---|---|---|
| Domestic Production | 13.955M b/d | 13.939M b/d | +16K b/d |
| Crude Imports | 5.698M b/d | 5.877M b/d | −179K b/d |
| Crude Exports | 3.570M b/d | 3.281M b/d | +289K b/d |
| Net Crude Imports | 2.128M b/d | 2.596M b/d | −468K b/d |
| Refinery Crude Inputs | 16.257M b/d | 16.811M b/d | −554K b/d |
Net crude imports fell substantially, while domestic production edged higher. However, the reduction in refinery demand was large enough to contribute to the commercial crude inventory build.
Product Supplied Remained Firm
Measures of petroleum products supplied also provided useful context for the tightening product balances.
Total products supplied averaged approximately 21.5 million barrels per day during the latest week.
On a four-week-average basis, total products supplied were approximately 20.8 million barrels per day, up 2.1% from the comparable period one year earlier.
| Product Supplied | Latest Week | Four-Week Average | Four-Week YoY Change |
|---|---|---|---|
| Total Petroleum Products | 21.500M b/d | 20.779M b/d | +2.1% |
| Finished Motor Gasoline | 8.689M b/d | 8.721M b/d | +0.3% |
| Distillate Fuel Oil | 3.948M b/d | 3.776M b/d | +5.2% |
| Jet Fuel | 1.809M b/d | 1.761M b/d | +6.5% |
The strong year-over-year increase in four-week distillate product supplied is particularly relevant given the low level of distillate inventories.
Why Could WTI Rise Despite an Unexpected Crude Build?
Product Draws Were Much Larger Than Expected
Gasoline and distillate inventories both tightened materially more than consensus anticipated, providing a strong offset to the crude build.
Distillate Stocks Were Already Tight
Distillate inventories stood roughly 14% below their five-year seasonal average, increasing the information value of another 2.3M-barrel draw.
Total Commercial Stocks Declined
Aggregate petroleum stocks excluding the SPR fell by approximately 7M barrels despite the commercial crude build.
Refining Activity Fell
Lower refinery runs helped explain both the crude build and the simultaneous tightening in product inventories.
The Crude Headline Alone Was Insufficient
The September 30 release demonstrates why high-frequency petroleum analysis requires simultaneous processing of multiple fields.
A crude-only framework would have classified the release negatively: stocks built when the market expected a draw, and Cushing inventories also increased.
A broader balance-sheet framework would immediately have identified substantial tightening in gasoline and distillates, falling refinery runs and a seven-million-barrel decline in total commercial petroleum inventories.
Professional market takeaway: petroleum releases are multi-dimensional. The first price response can reflect the interaction among crude, products, Cushing, refinery runs, trade flows and demand indicators rather than the sign of any single inventory field.
Release-Window Reaction vs. the Broader Oil Session
The measured 24-tick WTI increase represents the immediate response around the scheduled EIA release.
It should be separated from the broader daily oil move.
Crude prices were already trading higher amid continued concerns over Middle Eastern supply, while tightening U.S. gasoline and distillate inventories added support following the EIA data.
WTI ultimately settled at approximately $90.42 per barrel, up about $1.04 on the session.
The distinction matters for event attribution: the release-window movement isolates the market's response to the new petroleum data, while the full-session price reflects a much broader information set.
Implications for Low-Latency Commodity Strategies
Process the Entire Petroleum Balance
Crude, gasoline, distillates and Cushing can deliver conflicting signals. A robust system needs to parse them concurrently rather than sequentially.
Compare Actual Data with Consensus
The absolute direction of a stock change is not sufficient. The magnitude of the deviation from market expectations determines how much new information the release contains.
Preserve Relationships Between Fields
Lower refinery runs helped explain why crude inventories increased while refined-product stocks declined. Treating each field independently can miss these balance-sheet relationships.
Separate Absolute Stocks from Weekly Changes
Commercial crude stocks were above their seasonal five-year average, while gasoline and distillates remained below theirs. Stock levels and weekly changes therefore provided different signals.
Distinguish Release-Window Movement from Daily Performance
HAAWKS measurements focus on the immediate market response surrounding the official publication. They are not intended to represent the direction or magnitude of the entire trading session.
HAAWKS Conclusion
The September 30 EIA petroleum release delivered a clear example of a mixed inventory report in which the crude headline did not determine the initial market direction.
Commercial crude inventories increased by 922,000 barrels against expectations for a 264,000-barrel draw.
Cushing stocks also increased by approximately 553,000 barrels.
Yet gasoline inventories fell by 1.7 million barrels and distillate inventories fell by 2.3 million barrels, both substantially exceeding expected draws.
Total commercial petroleum inventories excluding the SPR declined by approximately 7 million barrels, while refinery utilization fell to 92.5%.
HAAWKS measured an immediate 24-tick upward movement in WTI crude oil following the release.
For professional market participants, the release highlights the value of structured, low-latency access to the full petroleum data set. Crude inventories matter, but so do refined products, refinery activity, delivery-hub stocks, flows and implied demand.
Low-Latency Data. Structured Intelligence. Professional Execution.
Machine-Readable Data for Professional Markets
HAAWKS G4A provides low-latency, structured macroeconomic and commodity data covering the United States, Canada and Europe.
The feed is designed for systematic strategies, professional trading desks and latency-sensitive applications that require field-level economic and commodity data as official releases become public.
API access is available through infrastructure in Chicago, New York and London. Free trials are available for qualified professional users.
Explore HAAWKS G4A Low-Latency DataSources
-
U.S. Energy Information Administration —
Weekly Petroleum Status Report, September 30, 2026
Official source for U.S. crude, gasoline, distillate, refinery, supply, inventory and product-supplied data. -
Reuters — Oil Prices Rise on Tight Fuel Markets,
September 30, 2026
Used for analyst expectations and broader post-release oil-market context. -
Reuters via BOE Report —
U.S. Crude Stocks Rise, Gasoline and Distillate Inventories Fall
Used for consensus estimates, Cushing inventories and refinery utilization context. -
HAAWKS internal tick-level market analysis —
September 30, 2026
Source for the measured immediate 24-tick upward WTI crude oil movement.
Built for traders who compete on speed. HAAWKS G4A delivers low-latency, machine-readable macroeconomic and commodity data via API infrastructure in Chicago, New York and London. Explore the feed, share your feedback, or contact us to request a free trial for financial institutions.
