
According to our analysis, the 19 November 2026 DOE Weekly Natural Gas Storage Report (WNGSR) generated an immediate 21-tick move in natural gas.
Natural gas (21 ticks)
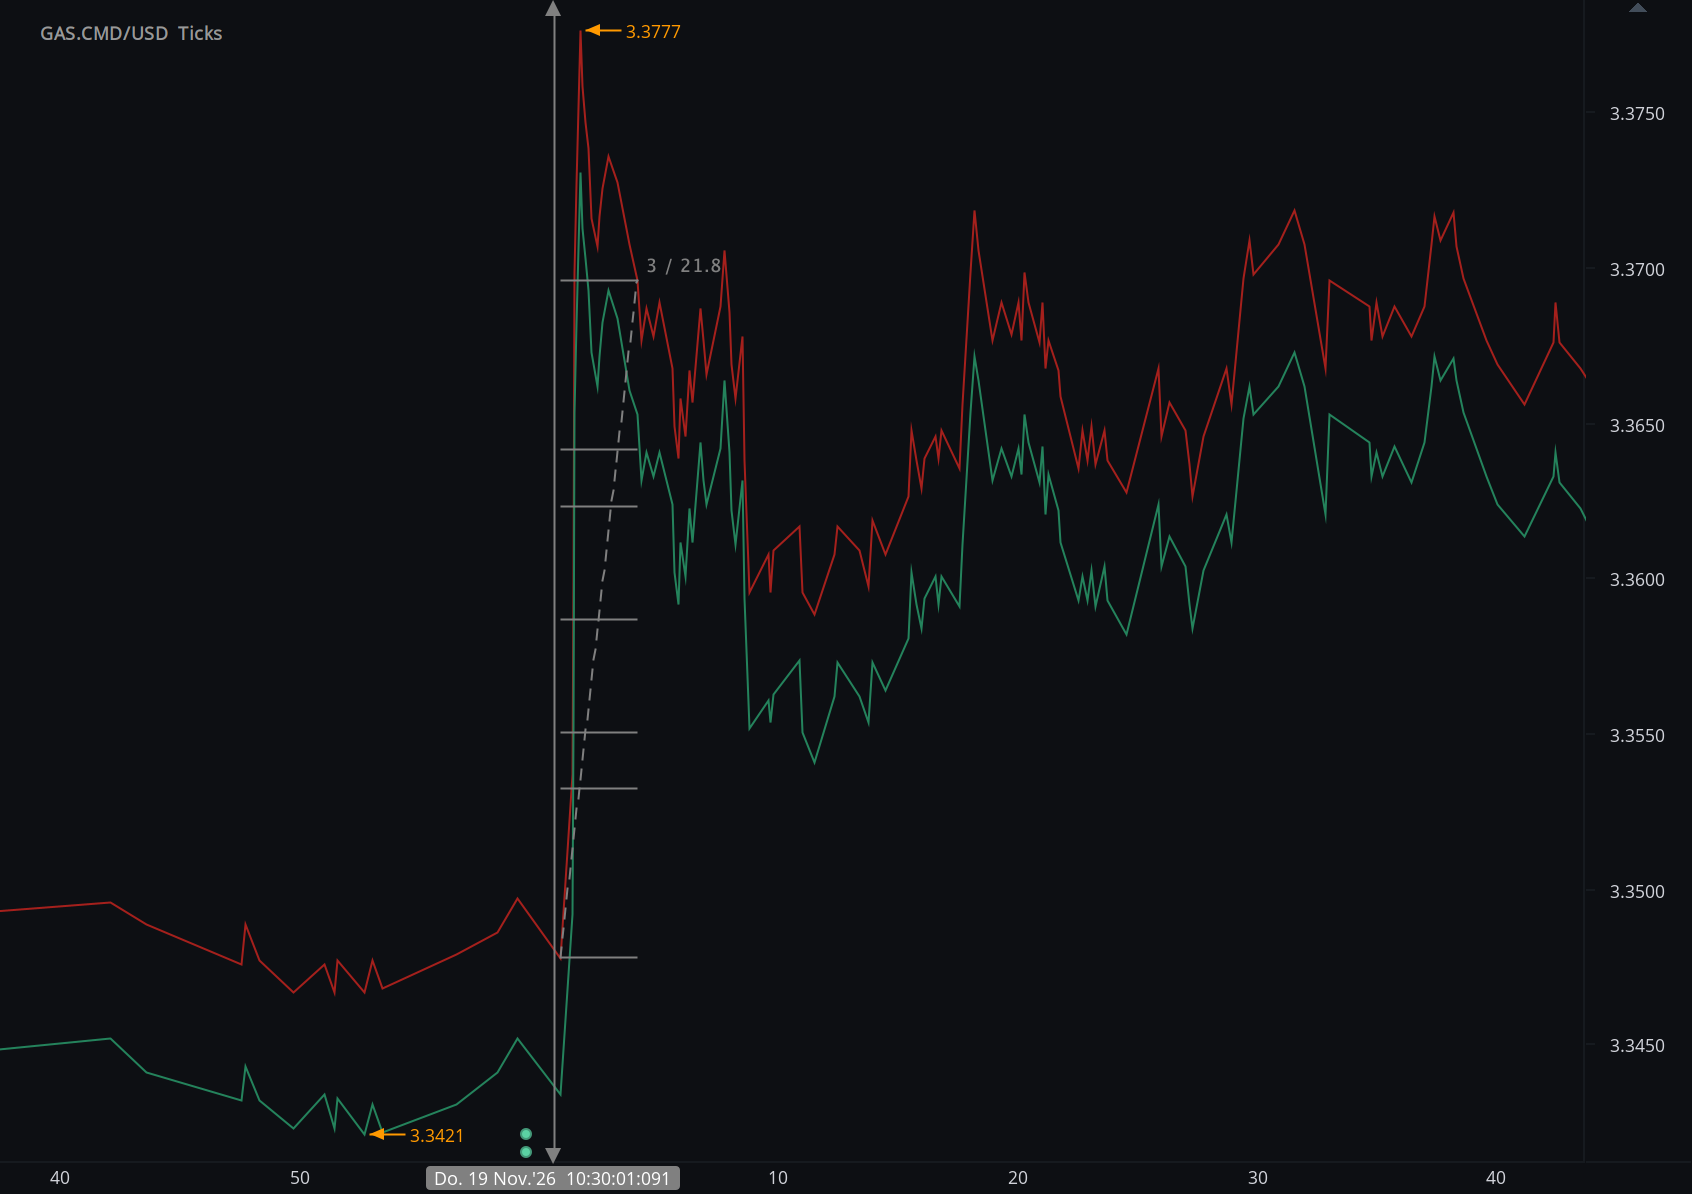
Charts are exported from JForex (Dukascopy).
EIA Natural Gas Storage: Natural Gas Rises 21 Ticks After Smaller-Than-Expected 20 Bcf Build
U.S. working-gas inventories increased by less than the median pre-release estimate for the week ending November 13, prompting an immediate upward repricing in natural gas despite inventories remaining above their five-year seasonal average.
The U.S. Energy Information Administration reported a 20 billion cubic foot injection into underground natural-gas storage for the week ending November 13, 2026.
The build was smaller than the principal pre-release estimate reviewed by HAAWKS. AEGIS reported a 25 Bcf median forecast, with estimates ranging from 19 Bcf to 31 Bcf.
The official figure was therefore 5 Bcf tighter than the median estimate and only 1 Bcf above the most bullish estimate in that cited range.
Total Lower 48 working gas increased from 3,862 Bcf to 3,882 Bcf.
November 19 Storage Report at a Glance
Immediate Natural-Gas Market Response
Release-Window Repricing
+21 TicksHAAWKS measured approximately 21 ticks of upward natural-gas movement during the immediate response to the scheduled EIA storage publication.
The direction of the initial move was consistent with a storage build that was smaller than the median expectation.
The market response was rapid. A smaller injection than anticipated implies that less gas was added to storage during the reporting week than the median forecast suggested.
In isolation, that represents a tighter weekly balance relative to expectations.
The interpretation nevertheless requires additional context because absolute U.S. inventories remained above their normal seasonal level.
Actual vs. Expectations
| Measure | Reference | November 19 Result | Interpretation |
|---|---|---|---|
| Weekly Storage Change | AEGIS median: +25 Bcf | +20 Bcf | 5 Bcf smaller build than median |
| AEGIS Forecast Range | +19 to +31 Bcf | +20 Bcf | Near bullish end of cited range |
| Five-Year Weekly Change | Approximately +15 Bcf | +20 Bcf | Build still exceeded seasonal weekly average |
| Total Working Gas | 3,862 Bcf prior week | 3,882 Bcf | Inventories remained historically comfortable |
HAAWKS view: the November 19 release was supportive relative to expectations, but not uniformly tight when evaluated against seasonal history. The 20 Bcf build was smaller than the 25 Bcf median forecast, yet larger than the approximately 15 Bcf five-year average injection for the corresponding week.
Inventories Reach 3,882 Bcf
Total Lower 48 working gas stood at 3,882 Bcf as of November 13.
That was 66 Bcf, or 1.7%, below the corresponding year-earlier level of 3,948 Bcf.
At the same time, inventories were 80 Bcf, or 2.1%, above the 2021–2025 five-year average of 3,802 Bcf.
The prior week's surplus to the five-year average had been 75 Bcf. The 20 Bcf injection therefore widened the seasonal surplus by approximately 5 Bcf.
This creates an important analytical distinction. The weekly result was tighter than consensus, while the aggregate storage position remained above normal.
Regional Storage Composition
| Region | November 6 | November 13 | Weekly Change | vs. Five-Year Average |
|---|---|---|---|---|
| East | 938 Bcf | 938 Bcf | 0 Bcf | +3.3% |
| Midwest | 1,129 Bcf | 1,128 Bcf | −1 Bcf | +2.1% |
| Mountain | 262 Bcf | 265 Bcf | +3 Bcf | +5.2% |
| Pacific | 298 Bcf | 303 Bcf | +5 Bcf | +5.9% |
| South Central | 1,235 Bcf | 1,248 Bcf | +13 Bcf | −0.2% |
The largest regional increase occurred in South Central storage, where working gas rose by approximately 13 Bcf to 1,248 Bcf.
Salt-cavern inventories increased by approximately 11 Bcf to 323 Bcf, while nonsalt storage increased to approximately 925 Bcf.
South Central inventories nevertheless remained slightly below their five-year average, contrasting with above-average stocks in the East, Midwest, Mountain and Pacific regions.
Why the 20 Bcf Build Was Supportive at Publication
Smaller Than Median Forecast
The 20 Bcf injection was 5 Bcf below the AEGIS median estimate, indicating a tighter weekly balance than the central forecast.
Near the Bullish End of the Range
AEGIS reported a 19–31 Bcf estimate range. The official result was only 1 Bcf above the lowest build in that distribution.
Inventories Still Above Normal
Lower 48 working gas remained 80 Bcf above its five-year average, limiting the case for describing national storage conditions as structurally tight.
Year-on-Year Deficit Remained
Stocks were 66 Bcf below the corresponding 2025 level, providing a tighter comparison against last year's inventory position.
Late-Season Storage Context
The November 19 report arrived after the traditional end of the U.S. natural-gas injection season, which EIA defines as running from April through October.
EIA estimated that Lower 48 inventories ended the 2026 injection season above normal levels, supported by a starting inventory position that was already above the five-year average.
The November 13 reporting week nevertheless produced another net injection rather than a seasonal withdrawal.
The next phase of the storage cycle therefore shifts attention increasingly toward heating demand, weather forecasts, dry-gas production and LNG feedgas demand.
Weather and the Broader Natural-Gas Balance
EIA's November Short-Term Energy Outlook described a warm start to the month and assumed approximately 13% fewer U.S. heating degree days than the 10-year November average.
EIA projected end-November working gas near 3,840 Bcf, reflecting an expectation that withdrawals would begin as seasonal heating demand increased.
Continued growth in U.S. natural-gas production also remained an important counterweight to tighter short-term weather-driven balances.
This backdrop helps explain why one tighter-than-expected weekly storage figure does not by itself define the medium-term price environment.
Release-Window Response vs. Full-Session Performance
The HAAWKS chart captures the immediate repricing around the scheduled EIA publication.
HAAWKS measured approximately 21 ticks of upward natural-gas movement in the selected release window.
The broader session ultimately developed differently. Natural-gas futures later gave back their gains and finished the session lower.
This does not contradict the release-window measurement. It reflects the arrival and repricing of additional information after the initial storage response, including weather expectations, supply, positioning and broader energy-market conditions.
Market-intelligence distinction: release-window analysis isolates how prices respond when the official data become public. A daily close incorporates every material development occurring after the release and therefore answers a different analytical question.
Implications for Real-Time Market Intelligence
Actual vs. Consensus Comes First
The 20 Bcf headline becomes meaningfully more informative once it is compared with the 25 Bcf median forecast.
That 5 Bcf deviation represented the most immediate numerical surprise available at publication.
Seasonal Context Can Point the Other Way
The same 20 Bcf build remained larger than the roughly 15 Bcf five-year weekly average.
This is why a release can be supportive relative to consensus while simultaneously widening the aggregate seasonal inventory surplus.
Forecast Distributions Matter
AEGIS reported estimates between 19 and 31 Bcf. The actual result was therefore not merely below the median; it landed near the tightest end of the cited forecast distribution.
Regional Data Add Information
The national figure was composed of materially different regional changes, including a small Midwest withdrawal and a 13 Bcf South Central injection.
Field-level processing allows these components to be evaluated at the same time as the national headline.
Historical Comparisons Need Multiple Benchmarks
Stocks were below the year-earlier level but above the five-year average.
Neither comparison should be treated as interchangeable with the other.
Precise Publication Timing Matters
The Weekly Natural Gas Storage Report became public at 10:30 a.m. ET.
Low-latency processing and timestamp alignment are necessary to distinguish the immediate storage response from subsequent intraday market developments.
HAAWKS Conclusion
The November 19, 2026 DOE / EIA Weekly Natural Gas Storage Report showed a 20 Bcf injection for the week ending November 13.
The result was 5 Bcf smaller than the AEGIS median estimate of 25 Bcf and near the bullish end of the cited 19–31 Bcf forecast range.
Total Lower 48 inventories increased to 3,882 Bcf.
Stocks remained 66 Bcf below the year-earlier level but stood 80 Bcf above the five-year average.
HAAWKS measured approximately 21 ticks of upward natural-gas movement during the immediate release window.
The release provides a useful example of why natural-gas storage data require several simultaneous comparisons. The weekly build was tighter than expectations and generated an immediate upward repricing, yet the build still exceeded the seasonal weekly norm and left total inventories above their five-year average.
For systematic market infrastructure, the relevant information set therefore extends beyond the headline number to consensus, forecast distribution, seasonal balances, regional storage composition and precise market timestamps.
Real-Time Data. Structured Intelligence. Professional Markets.
Low-Latency Energy and Macroeconomic Data
HAAWKS G4A provides low-latency, machine-readable macroeconomic and commodity data covering the United States, Canada and Europe.
The feed supports systematic strategies, professional trading desks and latency-sensitive applications requiring field-level economic and commodity data as official releases become public.
API infrastructure is available in Chicago, New York and London. Free trials are available for qualified financial institutions.
Explore HAAWKS G4ASources
-
U.S. Energy Information Administration —
Weekly Natural Gas Storage Report, 19 November 2026
Official source for the 20 Bcf injection, Lower 48 working-gas inventories and regional storage data. -
U.S. Energy Information Administration —
Weekly Working Gas in Underground Storage
Official historical source for Lower 48 and regional inventory levels. -
AEGIS Market Insights —
Weekly Gas Statistics, 19 November 2026
Source for the 25 Bcf median pre-release estimate and 19–31 Bcf analyst range. -
The Wall Street Journal —
U.S. Natural Gas Market Coverage, 19 November 2026
Source for seasonal weekly-build and broader session context. -
U.S. Energy Information Administration —
November 2026 Short-Term Energy Outlook
Source for November heating-degree-day, production and end-month storage context. -
HAAWKS internal tick-level market analysis —
19 November 2026
Source for the measured immediate 21-tick upward natural-gas movement.
Built for speed-sensitive market participants. HAAWKS G4A delivers low-latency, machine-readable macroeconomic and commodity data through API infrastructure in Chicago, New York and London. Explore the feed, share your feedback, or contact us to request a free trial for qualified financial institutions.
