
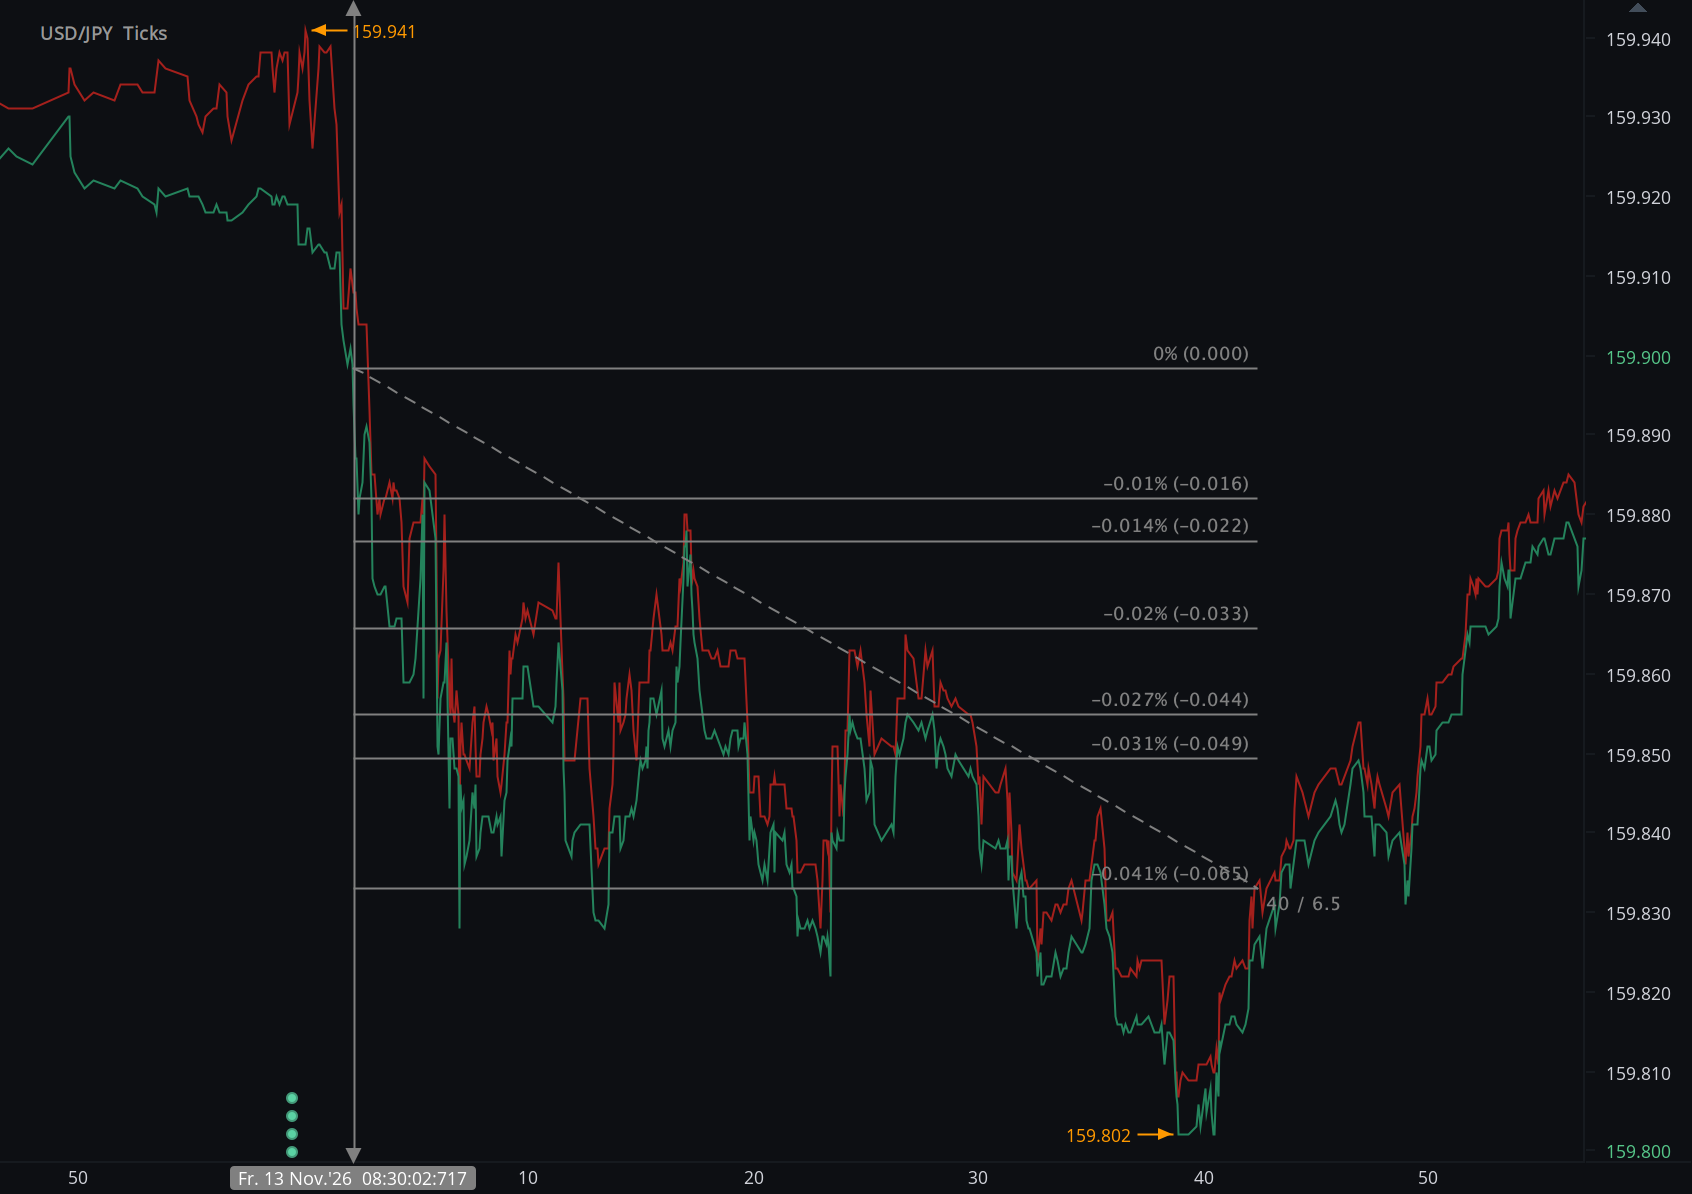
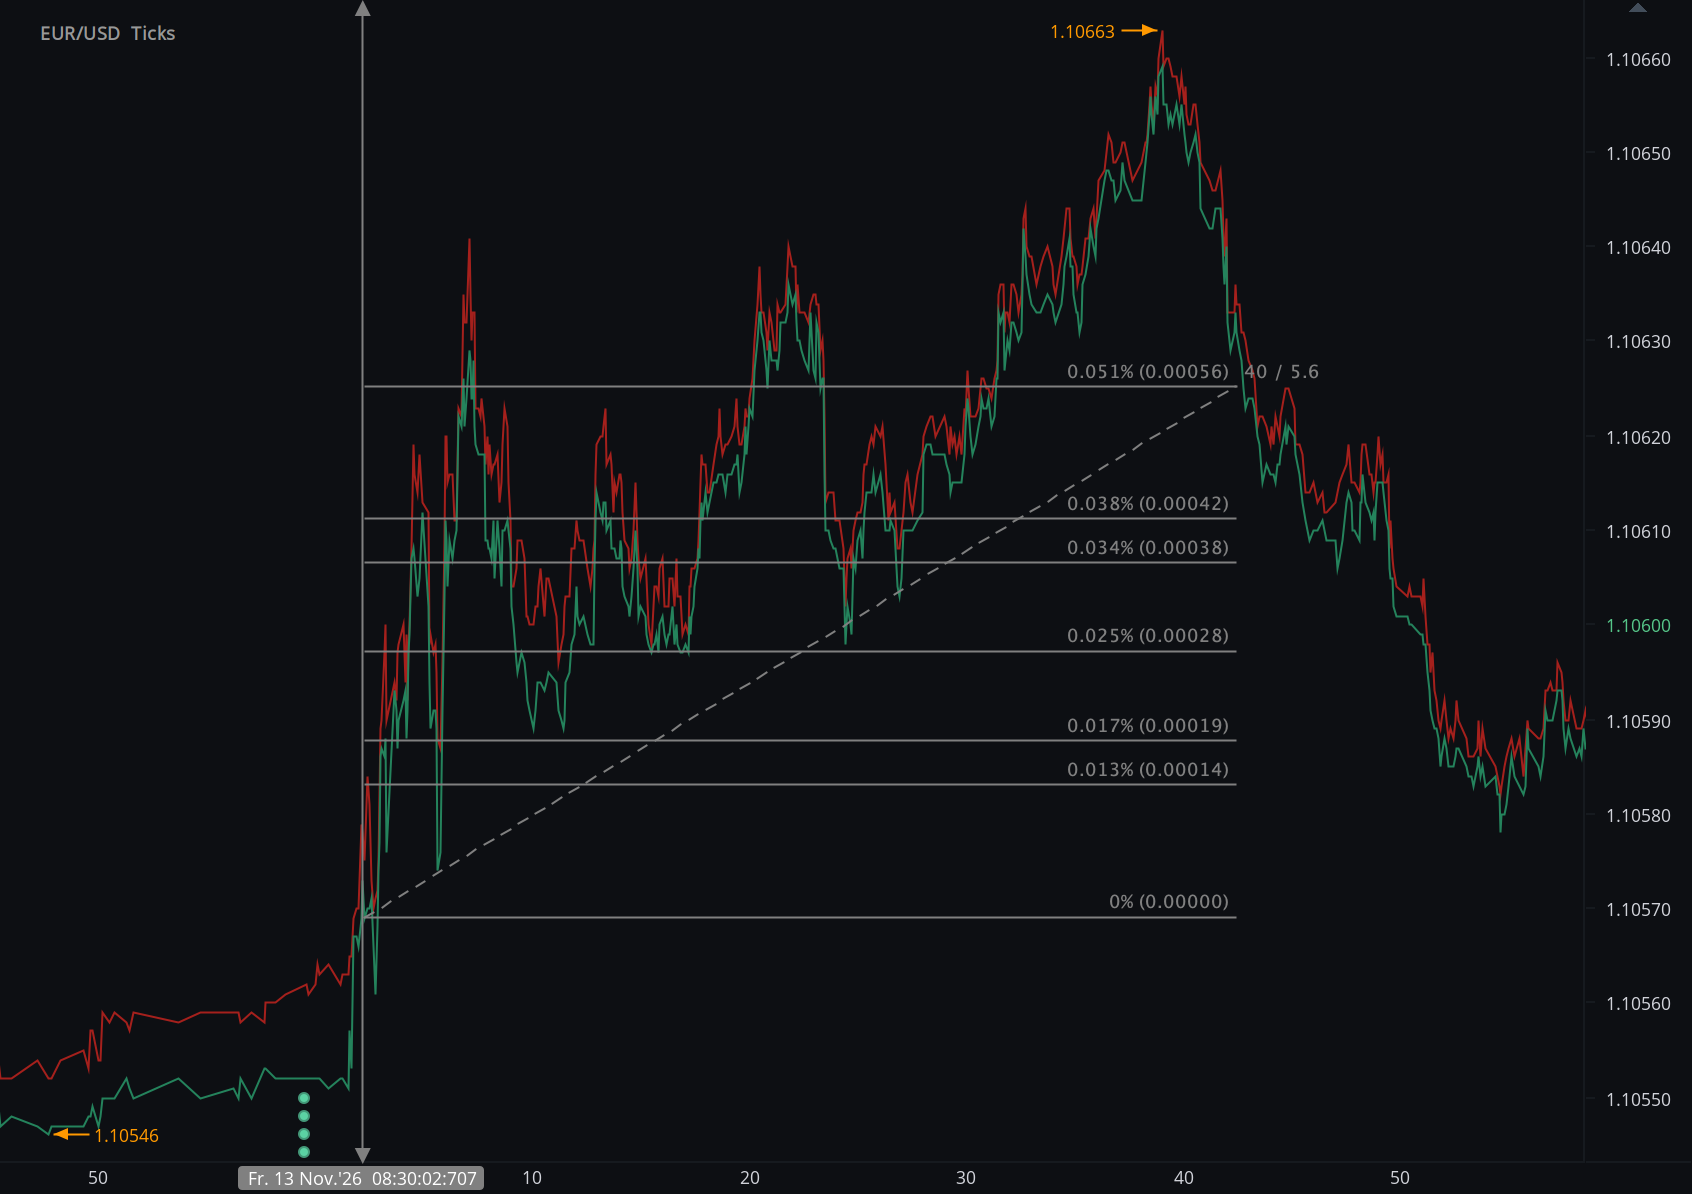
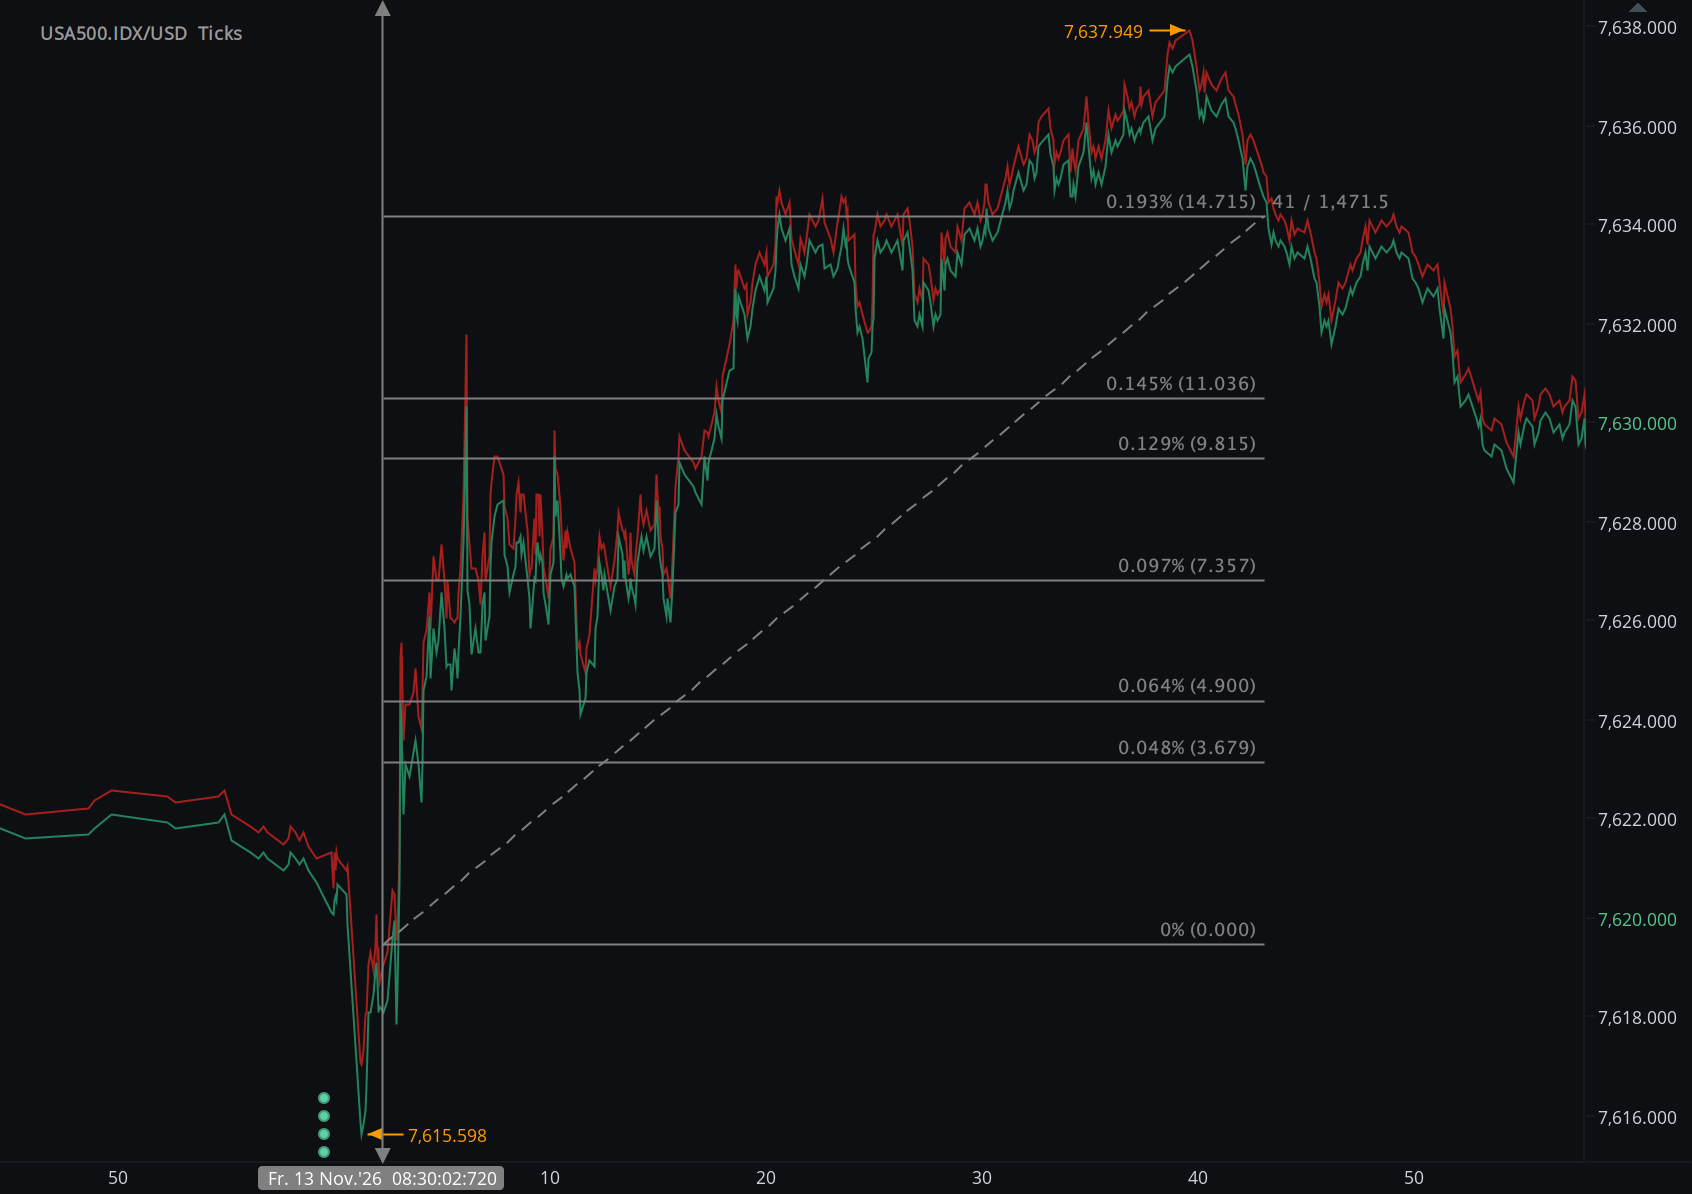
According to our analysis, the 13 November 2026 U.S. BLS Producer Price Index (PPI) generated an immediate cross-asset response of USD/JPY −6 pips, EUR/USD +5 pips, US500 +56 ticks and XAU/USD +16 points.
USD/JPY (6 pips)
EUR/USD (5 pips)
US500 (56 ticks)
XAU/USD (16 points)
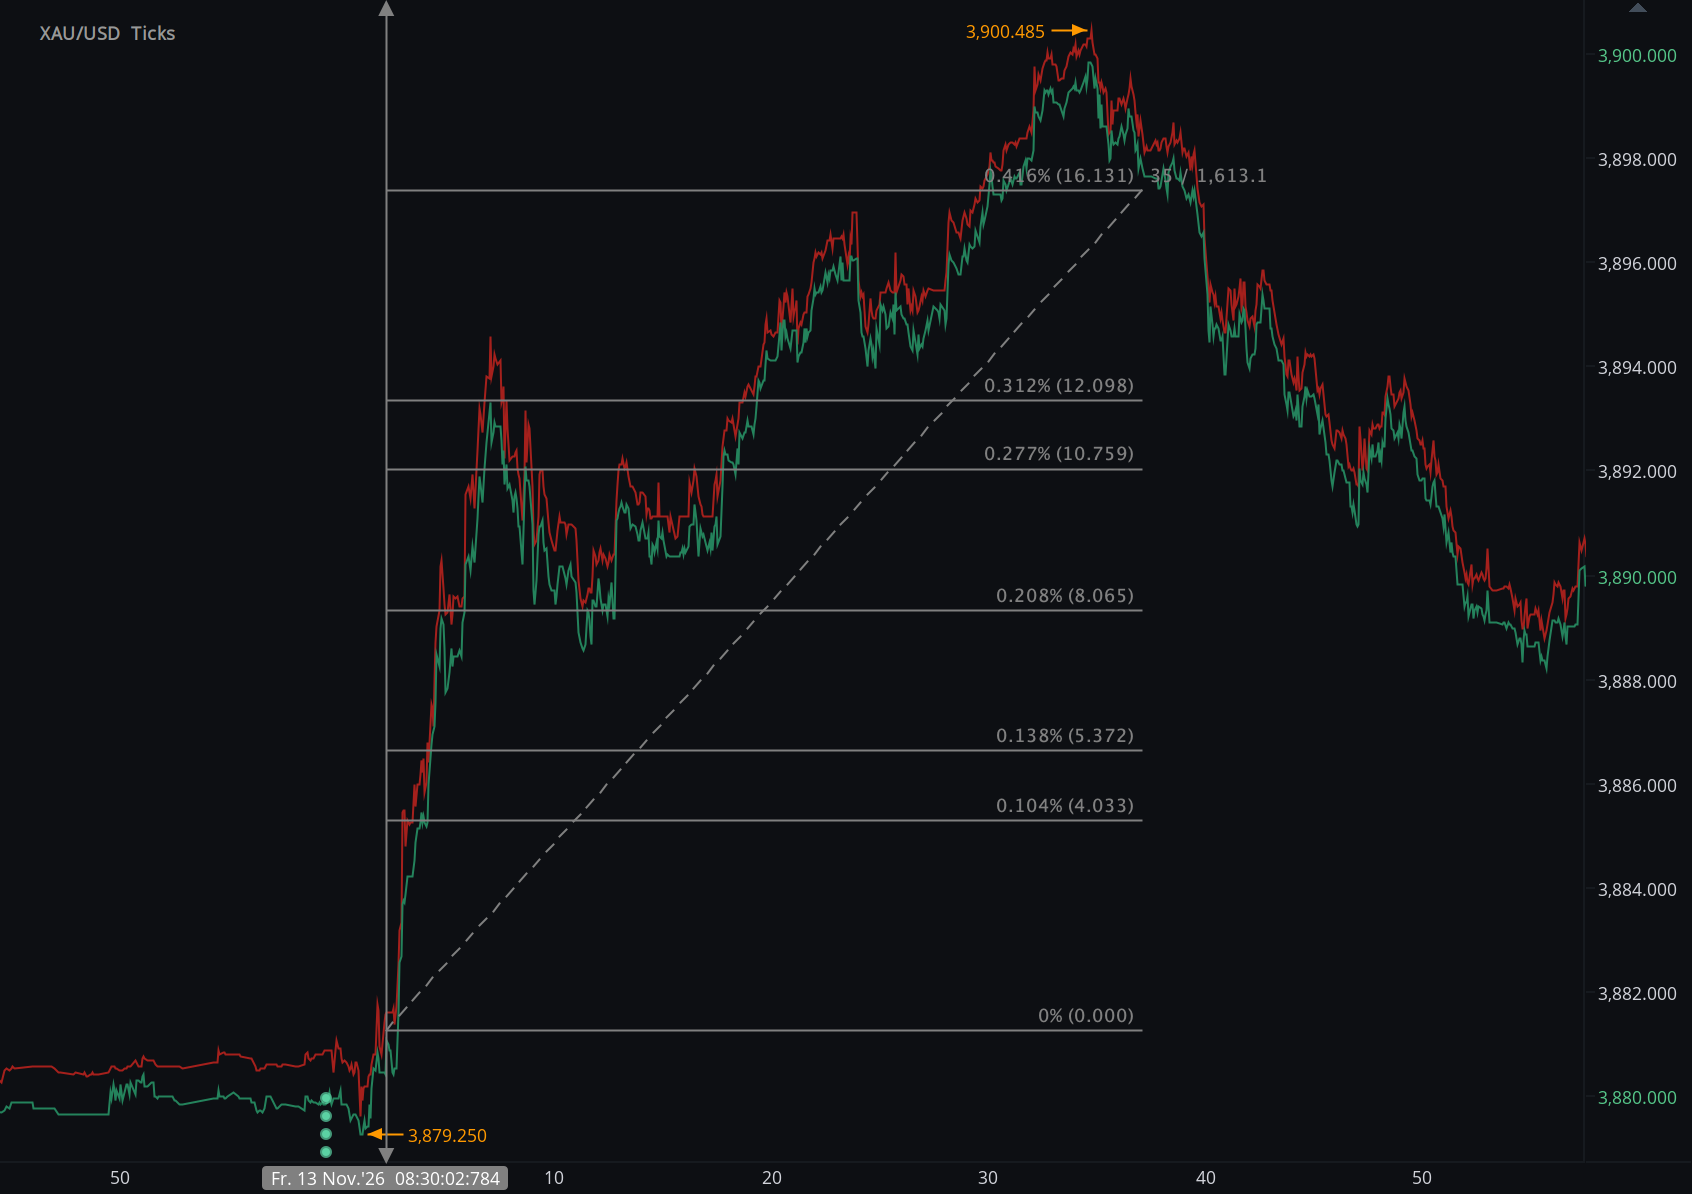
Charts are exported from JForex (Dukascopy).
October 2026 PPI: Softer Headline Drives Initial Dollar Weakness, Equities and Gold Higher
U.S. producer prices increased less than expected at the headline level, prompting an immediate cross-asset repricing even as underlying price measures remained comparatively firm.
The October 2026 U.S. Producer Price Index delivered a softer headline monthly increase than markets had expected, generating an immediate repricing across foreign exchange, U.S. equities and precious metals.
The Bureau of Labor Statistics reported that the Producer Price Index for final demand increased 0.3% month over month in October.
Economists surveyed by Reuters had expected a 0.4% increase.
The September increase was revised higher to 1.4% from the 1.3% initially reported.
On a 12-month basis, final-demand producer prices increased 6.5%, up from 6.3% in September and the largest annual increase since November 2022.
Immediate Cross-Asset Market Response
The first cross-asset response was consistent with markets placing significant weight on the softer-than-expected headline monthly PPI reading.
EUR/USD moved higher and USD/JPY lower, indicating an initial weakening of the U.S. dollar.
US500 rose while gold also moved higher, a combination consistent with an initial easing in rate expectations and Treasury yields.
Reuters subsequently reported that Treasury yields briefly declined following the PPI publication before the broader inflation backdrop and other market developments regained influence later in the session.
Headline PPI vs. Pre-Release Expectations
| Indicator | September | Reuters Consensus | October Actual | Release Signal |
|---|---|---|---|---|
| Final Demand PPI MoM | +1.4% | +0.4% | +0.3% | 0.1 ppt below consensus |
| Final Demand PPI YoY | +6.3% | — | +6.5% | Highest since November 2022 |
| Less Food, Energy & Trade Services MoM | +0.5% | — | +0.5% | Underlying pressure remained firm |
| Less Food, Energy & Trade Services YoY | +5.0% | — | +4.9% | Elevated underlying producer inflation |
HAAWKS view: the immediate market response appears to have placed greater weight on the 0.3% headline monthly increase relative to the 0.4% consensus. However, the broader report was not uniformly soft: annual producer inflation accelerated and the measure excluding food, energy and trade services remained firm at 0.5% month over month.
Goods Rise 0.5% While Services Increase 0.2%
The composition of the October PPI provides important context for the headline result.
Final-demand goods prices increased 0.5%, following a 2.5% rise in September.
Final-demand services prices increased 0.2%, marking a fifth consecutive monthly advance.
| Final-Demand Component | October Change | September Change | Analytical Context |
|---|---|---|---|
| Total Final Demand | +0.3% | +1.4% | Below +0.4% consensus |
| Final Demand Goods | +0.5% | +2.5% | Goods inflation remained firm |
| Goods Excluding Food & Energy | +0.5% | +0.3% | Accelerated |
| Food | +1.3% | +1.1% | Largest monthly increase in eight months |
| Energy | −0.1% | +10.0% | Major moderation from September |
| Final Demand Services | +0.2% | +1.0% | Fifth consecutive monthly increase |
Producer Goods Inflation Remains Broad
More than 60% of the October increase in final-demand goods was attributable to goods excluding food and energy, which increased 0.5%.
Food prices rose 1.3%, their largest monthly increase since February.
BLS reported higher prices for fresh and dry vegetables, processed young chickens and several other food categories.
Basic organic chemical prices increased 3.9%, while prices for electronic components and accessories also advanced.
Energy provided an important offset. Final-demand energy prices edged 0.1% lower after the substantial September increase.
Diesel fuel prices declined 7.9% during October, although Reuters noted that diesel prices remained dramatically higher than a year earlier.
Transportation Costs Drive Much of the Services Increase
Final-demand services increased only 0.2% overall, but the internal composition was more inflationary than the headline suggests.
BLS reported that approximately three-quarters of the services increase could be traced to a 2.0% rise in transportation and warehousing services.
More than 80% of the increase in final-demand services was attributable to truck transportation of freight, where prices increased 3.9%.
Hospital outpatient care and traveler accommodation also increased.
These gains were partly offset by a 0.2% decline in trade-service margins, while airline passenger services and several other categories also moved lower.
The Headline Was Softer; Underlying Inflation Was Not
October illustrates why the PPI should not be classified from the headline actual-versus-consensus comparison alone.
Softer Headline
Final-demand PPI rose 0.3%, one tenth below the Reuters consensus. This provided the clearest softer-than-expected field at publication.
Firm Underlying Measure
Final demand excluding food, energy and trade services rose 0.5% for a second consecutive month.
Annual Inflation Accelerated
Headline PPI accelerated to 6.5% year over year, its fastest annual increase since November 2022.
Core Goods Strengthened
Goods excluding food and energy rose 0.5%, with broad price pressure beyond the volatile energy component.
Analytical distinction: the first release-window repricing and the complete economic interpretation do not have to be identical. The headline miss initially supported equities and gold and weakened the dollar, while underlying producer inflation remained sufficiently firm to preserve concerns about the broader inflation trajectory.
PPI Arrives Three Days After a Hotter CPI Report
The October PPI was published only three days after the October Consumer Price Index delivered stronger-than-expected headline and core consumer inflation.
That sequencing is important.
Markets entered the PPI release with policy expectations already adjusted toward a more restrictive Federal Reserve outlook.
A headline PPI reading below consensus therefore provided an incremental offset to the earlier CPI surprise, even though the underlying producer-price data remained firm.
Reuters reported that economists slightly reduced their estimates for October core PCE inflation after the PPI release, to around 0.3% month over month.
The Federal Reserve outlook nevertheless remained restrictive, reflecting the broader persistence of inflation across recent data.
Reading the Initial Cross-Asset Repricing
EUR/USD +5 Ticks
EUR/USD moved higher as the initial interpretation of the softer headline PPI reduced marginal support for the U.S. dollar.
USD/JPY −6 Ticks
USD/JPY moved lower during the release window, consistent with an initial decline in U.S. rate expectations and Treasury yields.
US500 +56 Ticks
U.S. equities initially benefited from the below-consensus headline as markets marginally reduced the inflation premium embedded in expected interest rates.
XAU/USD +16 Points
Gold moved higher as the dollar and yields initially softened, improving the relative backdrop for the non-yielding asset.
Release-Window Repricing vs. the Broader Session
HAAWKS measurements isolate the first market adjustment around the scheduled 8:30 a.m. ET publication.
That distinction is particularly important for the October PPI.
Reuters reported that Treasury yields initially moved lower after publication, consistent with the softer headline result.
Later in the session, however, yields and the dollar strengthened and U.S. equities traded lower as markets continued to process the broader inflation environment alongside other market-specific developments.
The full-session result therefore should not be used as a substitute for the immediate information response.
HAAWKS methodology: release-window analysis asks how markets repriced when the new official information became public. Full-session performance answers a different question because it incorporates subsequent information, liquidity, positioning and broader market developments.
Implications for Real-Time Market Intelligence
Actual vs. Consensus Is Only the First Layer
The 0.3% headline PPI result was below the 0.4% consensus and produced the clearest initial directional signal.
But a complete interpretation also required processing underlying PPI measures, goods, services, food, energy and historical revisions.
Headline and Core Measures Can Point Differently
The headline was softer than expected while the measure excluding food, energy and trade services remained at a relatively firm 0.5%.
Automated processing therefore benefits from retaining several simultaneous inflation measures rather than assigning one label to the entire release.
Revisions Matter
September final-demand PPI was revised to 1.4% from the previously reported 1.3%.
A low-latency framework should process both the new reference month and relevant prior-period revisions.
Component Structure Matters
Transportation and warehousing, food, core goods and trade margins contributed very differently to the October result.
Field-level data make it possible to distinguish broad price pressure from movements concentrated in a small number of categories.
Cross-Asset Confirmation Adds Context
The simultaneous initial rise in EUR/USD, decline in USD/JPY, increase in US500 and rise in gold provided a coherent cross-market response to the softer headline.
Precise Timestamping Is Essential
The October PPI became public at 8:30 a.m. ET on 13 November 2026.
Accurate event research requires the official publication timestamp to be aligned with instrument-level market data closely enough to distinguish the initial response from later repricing.
HAAWKS Conclusion
The October 2026 Producer Price Index delivered a softer headline result than markets expected, but the broader producer-inflation picture remained comparatively firm.
Final-demand PPI increased 0.3% month over month, below the Reuters consensus of 0.4%.
At the same time, annual producer inflation accelerated to 6.5%, while final demand excluding food, energy and trade services rose 0.5% month over month and 4.9% year over year.
Goods prices increased 0.5%, food prices rose 1.3% and final-demand services increased 0.2%. Transportation and warehousing services advanced 2.0%, led by a 3.9% increase in truck-freight prices.
HAAWKS measured an immediate release-window response of EUR/USD +5 ticks, USD/JPY −6 ticks, US500 +56 ticks and XAU/USD +16 points.
The initial cross-asset pattern was consistent with markets assigning greater weight to the below-consensus headline figure, while the broader report continued to show persistent underlying producer-price pressure.
For systematic macro infrastructure, the release demonstrates why headline surprise, underlying inflation, revisions, component data and cross-asset repricing need to be processed as a single structured information set.
Real-Time Data. Structured Intelligence. Professional Markets.
Real-Time U.S. Macroeconomic Data
HAAWKS G4A provides low-latency, machine-readable macroeconomic and commodity data covering the United States, Canada and Europe.
The feed supports systematic strategies, professional trading desks and latency-sensitive applications requiring field-level economic and commodity data as official releases become public.
API infrastructure is available in Chicago, New York and London. Free trials are available for qualified financial institutions.
Explore HAAWKS G4ASources
-
U.S. Bureau of Labor Statistics —
Producer Price Indexes, October 2026
Official source for final-demand PPI, goods, services, food, energy, underlying inflation measures and revisions. -
U.S. Bureau of Labor Statistics —
Producer Price Index Summary
Current official BLS PPI publication page. -
Reuters —
U.S. Producer Prices Rise Moderately in October,
Inflation Broadens
Source for the 0.4% economist consensus, inflation context, PCE implications and broader market interpretation. -
Reuters — Global Markets, 13 November 2026
Additional context on the initial Treasury response and subsequent full-session dollar and equity-market developments. -
HAAWKS internal tick-level market analysis —
13 November 2026
Source for the measured immediate release-window movements: EUR/USD +5 ticks, USD/JPY −6 ticks, US500 +56 ticks and XAU/USD +16 points.
Built for traders who compete on speed. HAAWKS G4A delivers low-latency, machine-readable macroeconomic and commodity data via API infrastructure in Chicago, New York and London. Explore the feed, share your feedback, or contact us to request a free trial for financial institutions.
