Q4 2025 Macro Trading Recap: Shutdown Data Gaps, Fed Cuts & December Volatility
The final quarter of 2025 was defined by an unusual combination of macro uncertainty, delayed government data, and sharp short-lived market reactions.
The U.S. government shutdown, which began on October 1, 2025 and lasted 43 days, created a major information gap for traders, policymakers, and economists. Several key economic releases were delayed, revised, or left incomplete, including labor-market and inflation data from October and November. The Bureau of Labor Statistics confirmed that it did not publish an October 2025 Employment Situation release, and that some household survey data for October could not be collected retroactively.
That data blackout made December’s releases especially important. When the market finally received fresh inflation, labor, and Federal Reserve guidance, volatility returned quickly—but briefly.
Key Q4 Trading Opportunities
FOMC Interest Rate Decision and Projections
10 December 2025
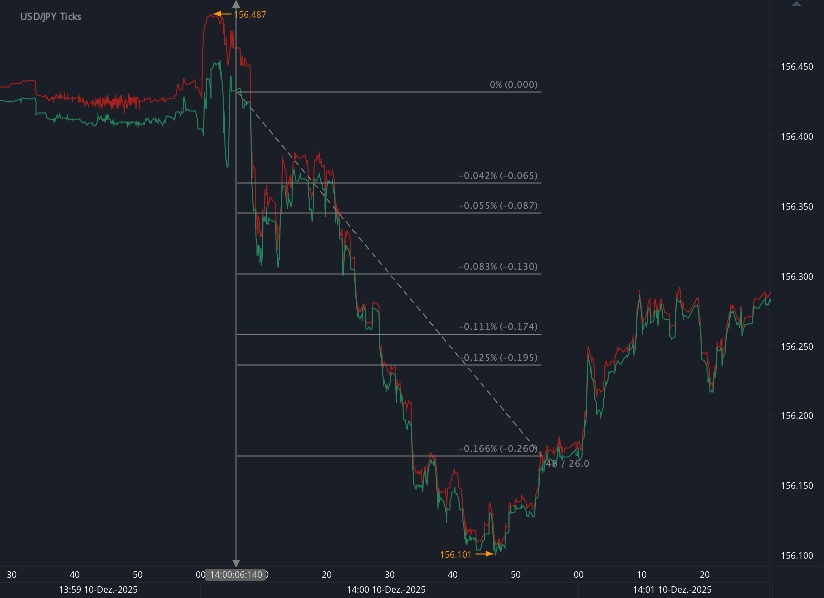
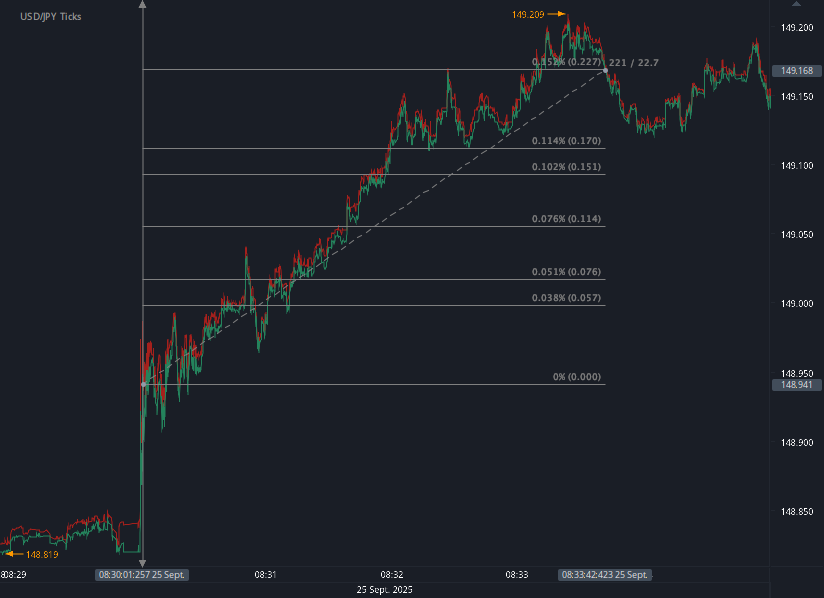
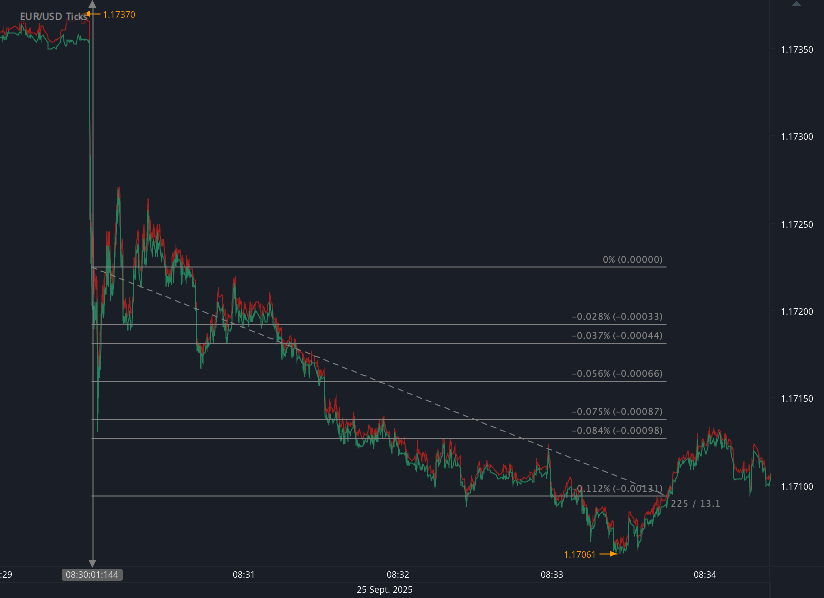
The December FOMC meeting delivered one of the quarter’s cleanest macro-driven moves.
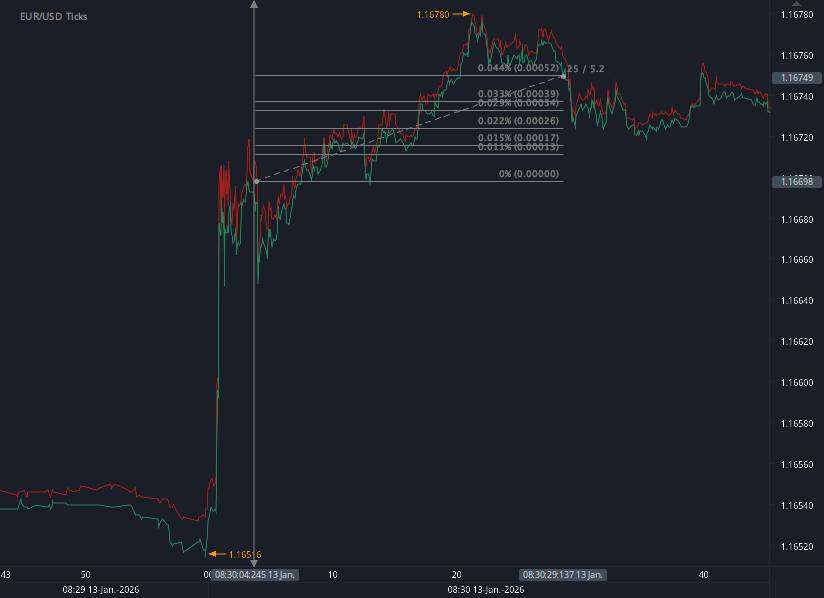
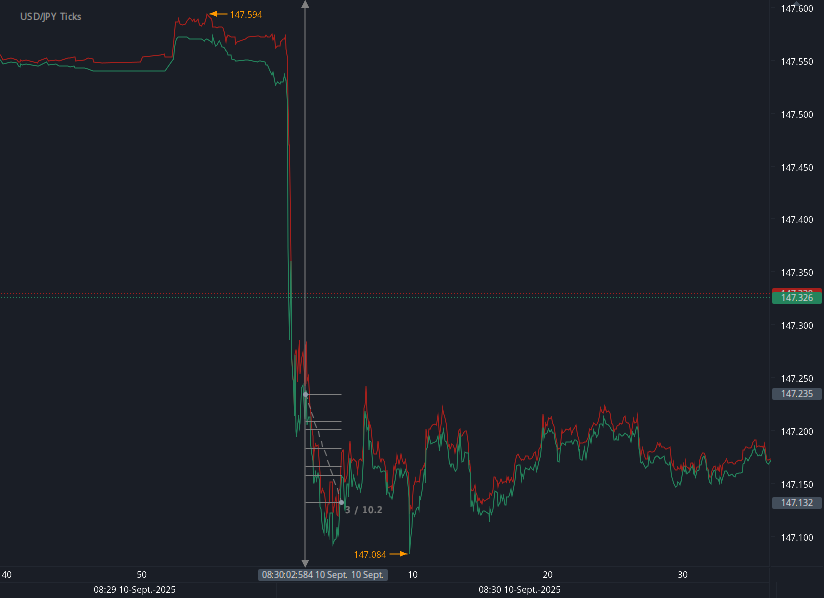
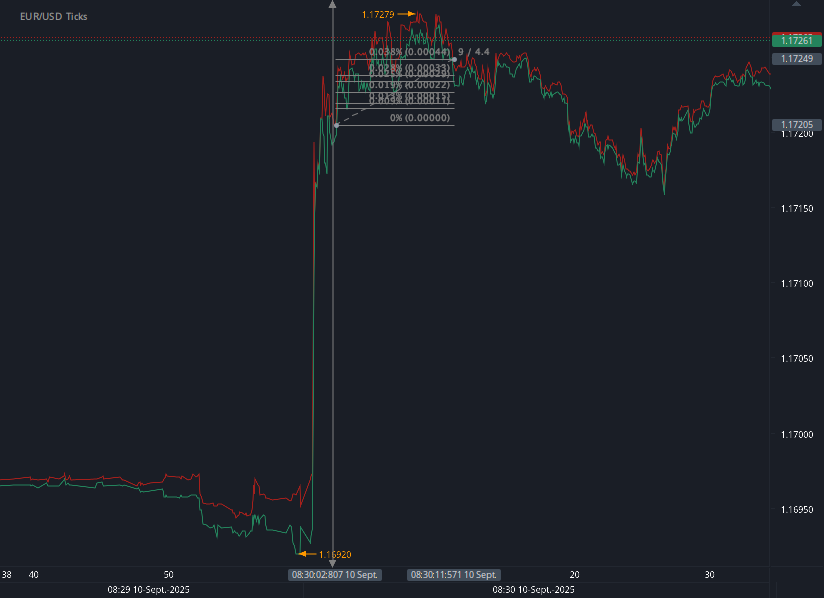
The Fed cut rates by 25 basis points, bringing the target range to 3.50%–3.75%. The decision triggered sharp but short-lived volatility across major FX pairs.
Market reaction:
USDJPY: 26 pips
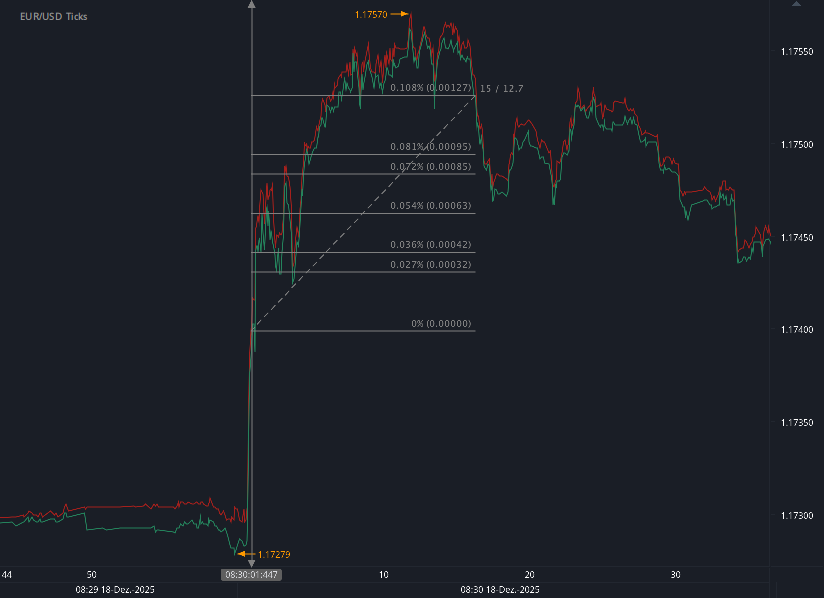
EURUSD: 19 pips
Total potential: 45 pips in 48 seconds
2025 YTD potential: 1,816 pips, compared with 4,305 in 2024
The rate cut mattered not only because of the move itself, but because of the Fed’s reasoning. Inflation was still described as somewhat elevated, but downside risks to employment had increased. That made the meeting a turning point: the Fed was no longer focused only on inflation risk.
The projections also confirmed that this was not a return to zero-rate policy. The median rate path pointed to a structurally higher-rate environment, with the longer-run rate near 3%.
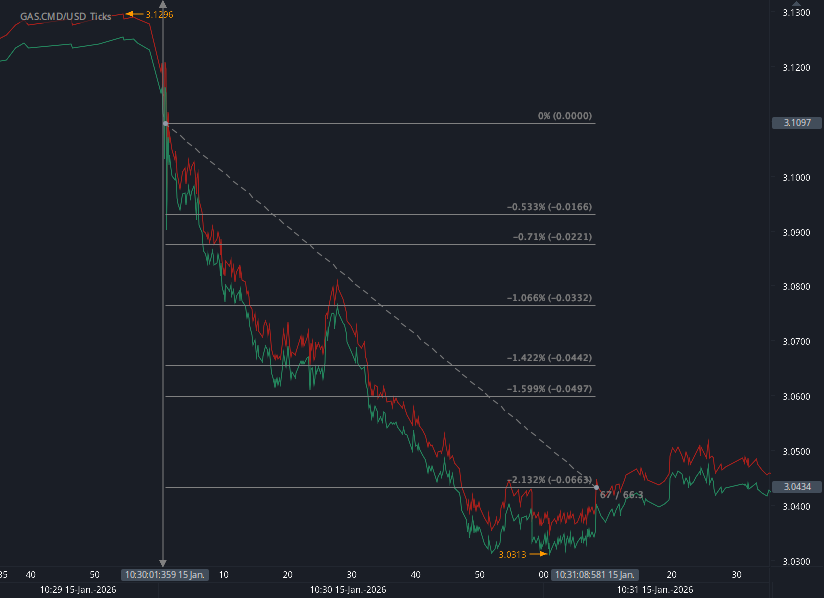
CPI and Jobless Claims
18 December 2025
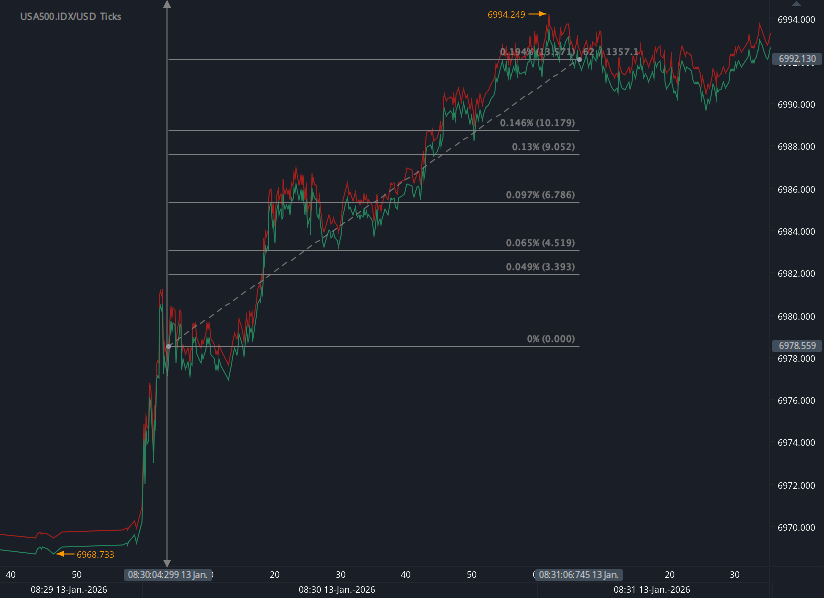
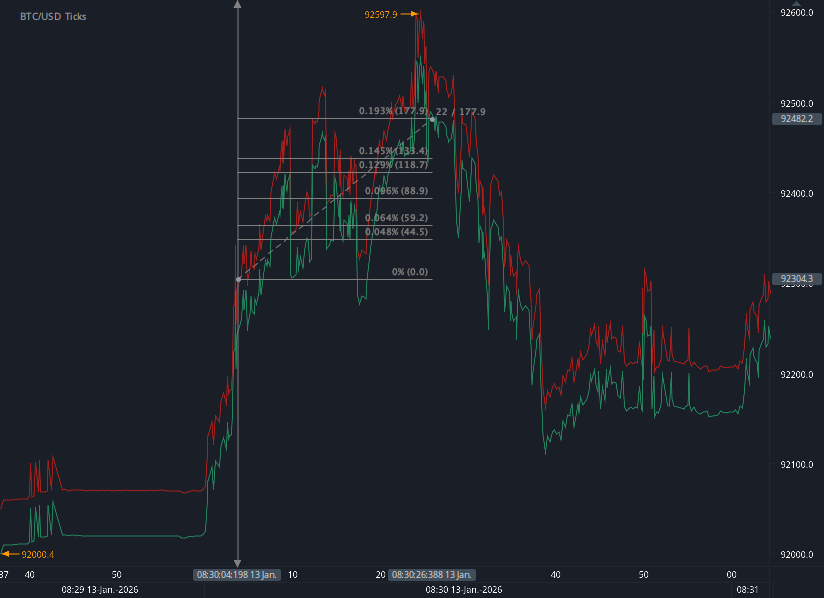
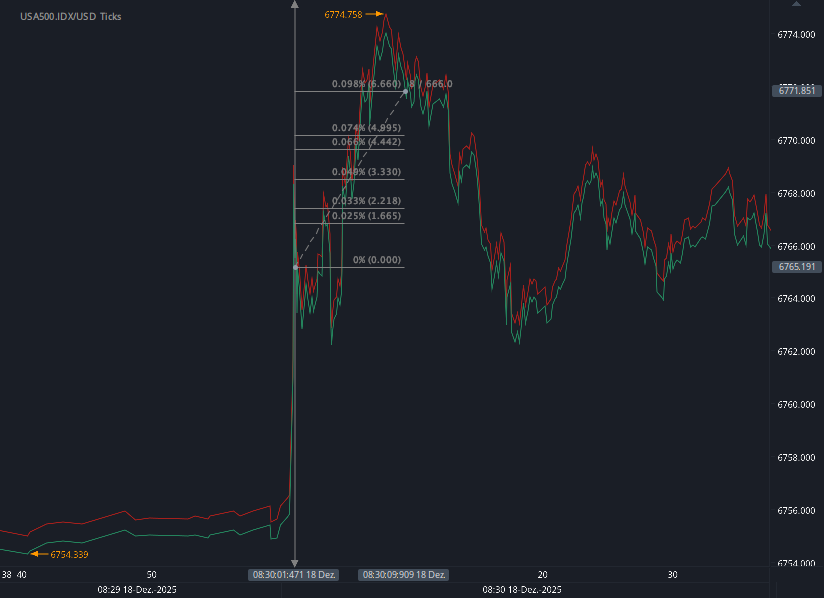
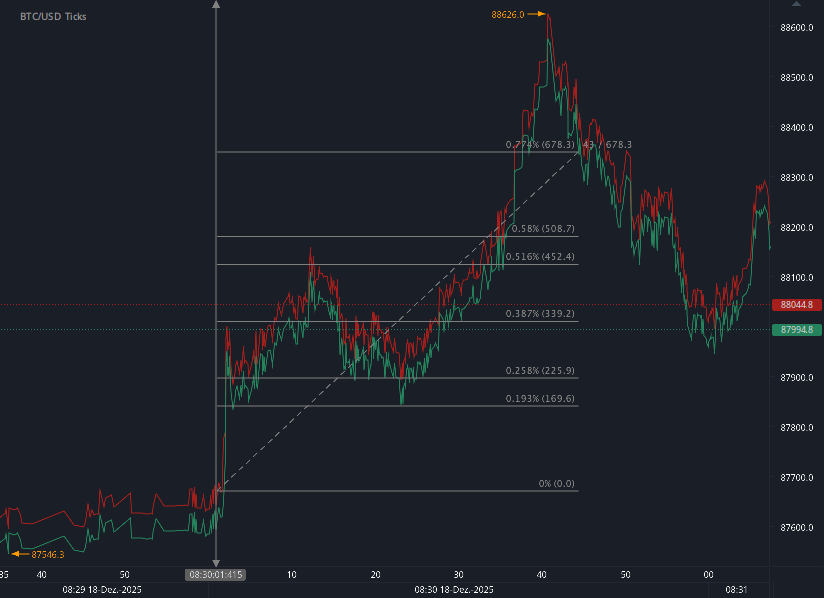
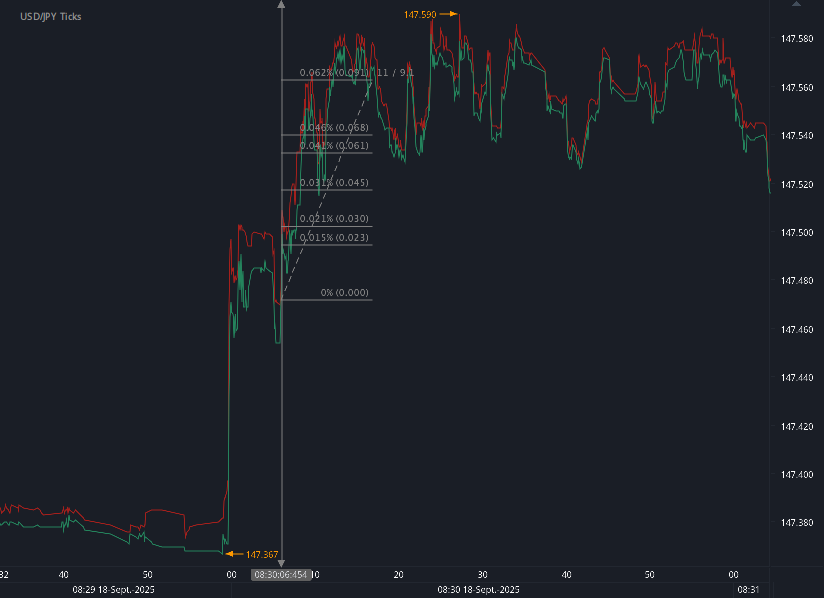
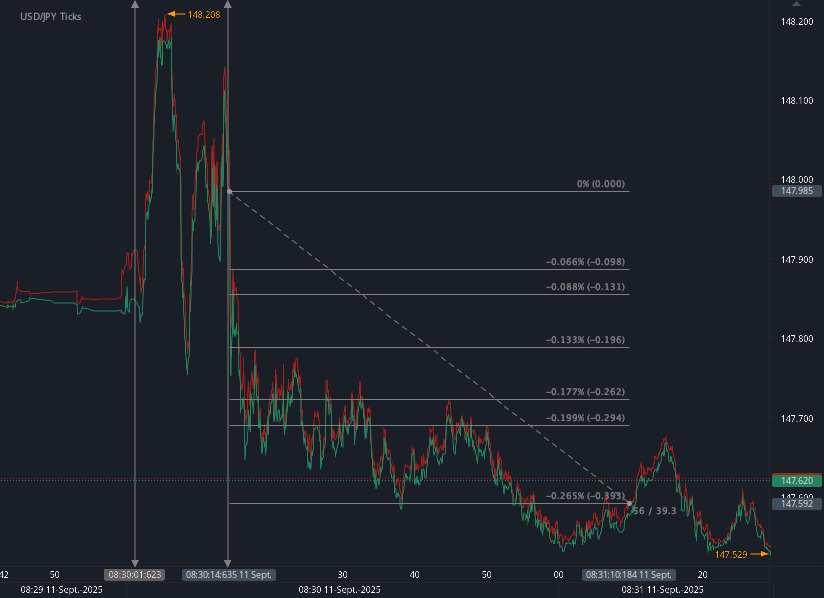
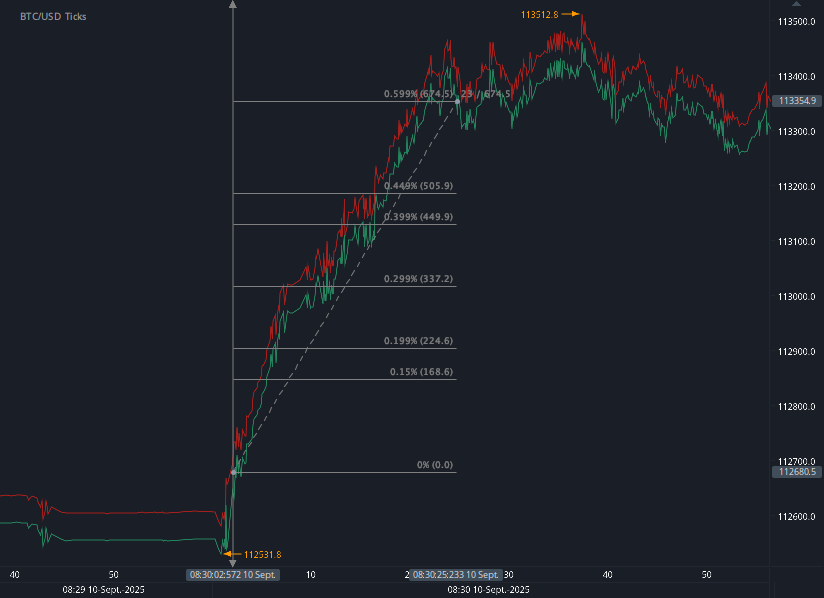
The second major December opportunity came from the combined CPI and jobless claims release.
After weeks of shutdown-related disruption, this data cluster gave traders a clearer picture of inflation and labor-market resilience.
Market reaction:
Bitcoin was the standout mover. The reaction suggested that crypto remained highly sensitive to macro data, especially when inflation appeared controlled and labor-market conditions stayed stable.
The Shutdown Effect: Why December Data Mattered More
The October and November 2025 government shutdown did more than delay headlines. It reduced visibility across the entire macro landscape.
BLS revised several release schedules after the shutdown, and BEA cancelled the advance estimate for Q3 2025 GDP that had originally been scheduled for October 30.
Reuters also reported that delayed government data created a backlog of economic releases, forcing markets to process multiple important indicators in a compressed window.
For traders, that created two important effects:
First, markets entered December with less confidence than usual. With missing or delayed data, positioning became more fragile.
Second, each confirmed release carried more weight. CPI, jobless claims, and the FOMC projections became not just individual events, but catch-up signals after a period of reduced visibility.
This helped explain why the market reactions were sharp, even when the underlying data did not point to a crisis.
Labor Market: Resilient, Not Recessionary
The labor-market picture remained broadly stable.
Initial jobless claims came in at 224k, down 13k from the previous week, while the four-week average held near 217.5k. These levels were consistent with continued expansion rather than recessionary stress.
Insured unemployment remained within the 2025 range, and the insured unemployment rate stayed flat at 1.2%.
The key takeaway was that the labor market was cooling selectively, not breaking broadly.
Some weakness was visible in states and sectors exposed to:
But this looked more like late-cycle adjustment than systemic deterioration.
Inflation: Disinflation Continues, But Services Stay Sticky
The inflation data supported the soft-landing narrative.
Headline CPI was running at 2.7% year over year, while core CPI was at 2.6% year over year. From September to November, headline, core, and shelter inflation each rose only around 0.2% in total, implying a clear downshift in inflation momentum.
Goods inflation was no longer the main problem. Instead, the remaining pressure came from services, shelter, utilities, and selected household costs.
Food inflation showed the same split:
Energy also remained politically sensitive, with electricity, utility gas, and fuel oil continuing to pressure households.
The broader message was clear: inflation was moving in the right direction, but not evenly.
The Fed’s 2026 Problem: Cutting Without Losing Control
The December rate cut showed that the Fed was willing to ease, but cautiously.
The policy message for 2026 was not aggressive stimulus. It was controlled adjustment.
The Fed’s projections suggested:
Growth stabilizing near trend
Unemployment drifting toward the low-to-mid 4% range
Inflation gradually returning toward 2%
Interest rates staying structurally higher than the post-2008 era
The internal split at the FOMC reinforced the uncertainty. One side wanted a larger cut, while others preferred no cut at all. That division showed how narrow the policy path had become.
For markets, this means 2026 may bring fewer obvious policy signals and more dependence on each incoming data release.
What Traders Should Take Away
Q4 2025 confirmed that macro events remain powerful short-term catalysts, even when the broader economic trend appears stable.
The quarter’s major opportunities were extremely brief:
45 pips in 48 seconds after the FOMC decision
12 pips, 6 US500 points, and 678 BTC points in 43 seconds after CPI and jobless claims
Total trading time: roughly 2 minutes, excluding preparation
That is the key lesson.
The edge was not in predicting a multi-week trend. The edge was in being prepared, fast, and precise when the data hit.
Final Thoughts
Q4 2025 was a reminder that macro trading is not only about the numbers. It is also about the information environment around those numbers.
The October–November U.S. government shutdown created a data vacuum. December filled that vacuum with high-impact releases, a Fed rate cut, and a renewed debate over whether the U.S. economy is heading for a soft landing or a more complicated slowdown.
For traders, the conclusion is straightforward: macro releases remain some of the most important volatility events in the market.
Even when the long-term narrative is orderly disinflation and resilient employment, the short-term reaction can be fast, sharp, and highly tradable.
Sources:
Bureau of Labor Statistics — Revised news release dates following the 2025 lapse in appropriations
https://www.bls.gov/bls/2025-lapse-revised-release-dates.htm
Bureau of Labor Statistics — Employment Situation archived releases
https://www.bls.gov/bls/news-release/empsit.htm
Reuters — Schedule for US economic data delayed by government shutdown
https://www.reuters.com/business/schedule-us-economic-data-delayed-by-government-shutdown-2025-11-28/
Reuters — US government shutdown: How it affects key economic data publishing
https://www.reuters.com/world/us/us-government-shutdown-how-it-affects-key-economic-data-publishing-2025-10-21/
Reuters — US Bureau of Economic Analysis working on new economic data calendar post-shutdown
https://www.reuters.com/business/us-bureau-economic-analysis-working-new-economic-data-calendar-post-shutdown-2025-11-14/
U.S. Department of Labor / BLS — The Employment Situation — November 2025
https://www.dol.gov/newsroom/economicdata/empsit_12162025.pdf
Disclaimer: This blog post is for informational purposes only and should not be construed as financial advice. Always conduct thorough research and consider seeking advice from a financial professional before making any investment decisions.