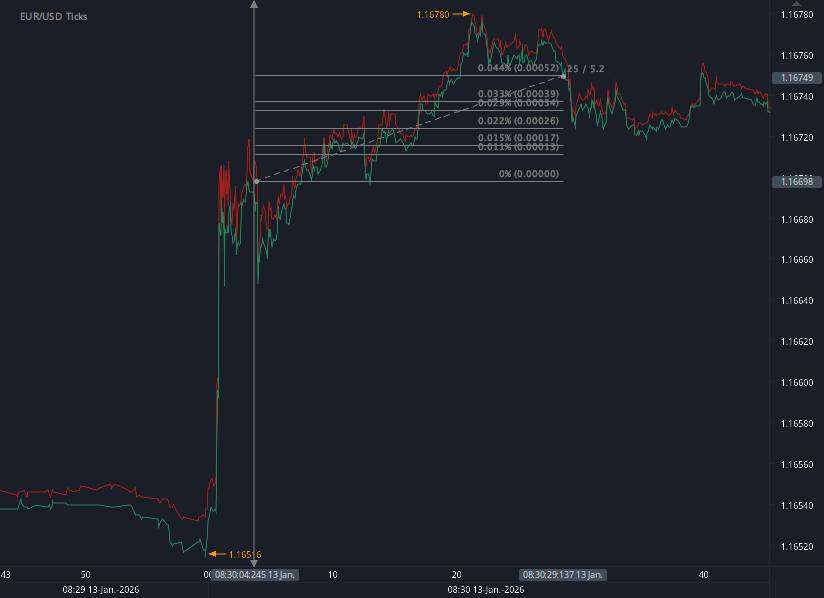
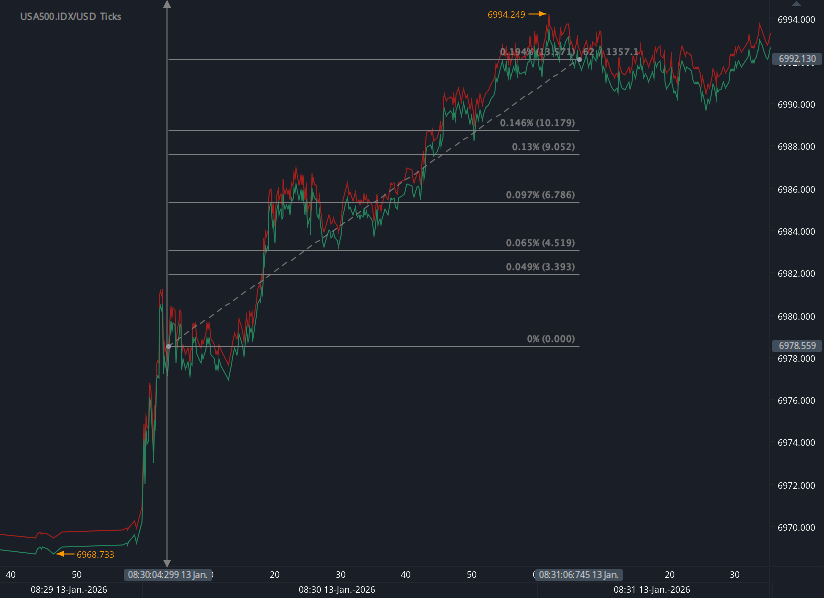
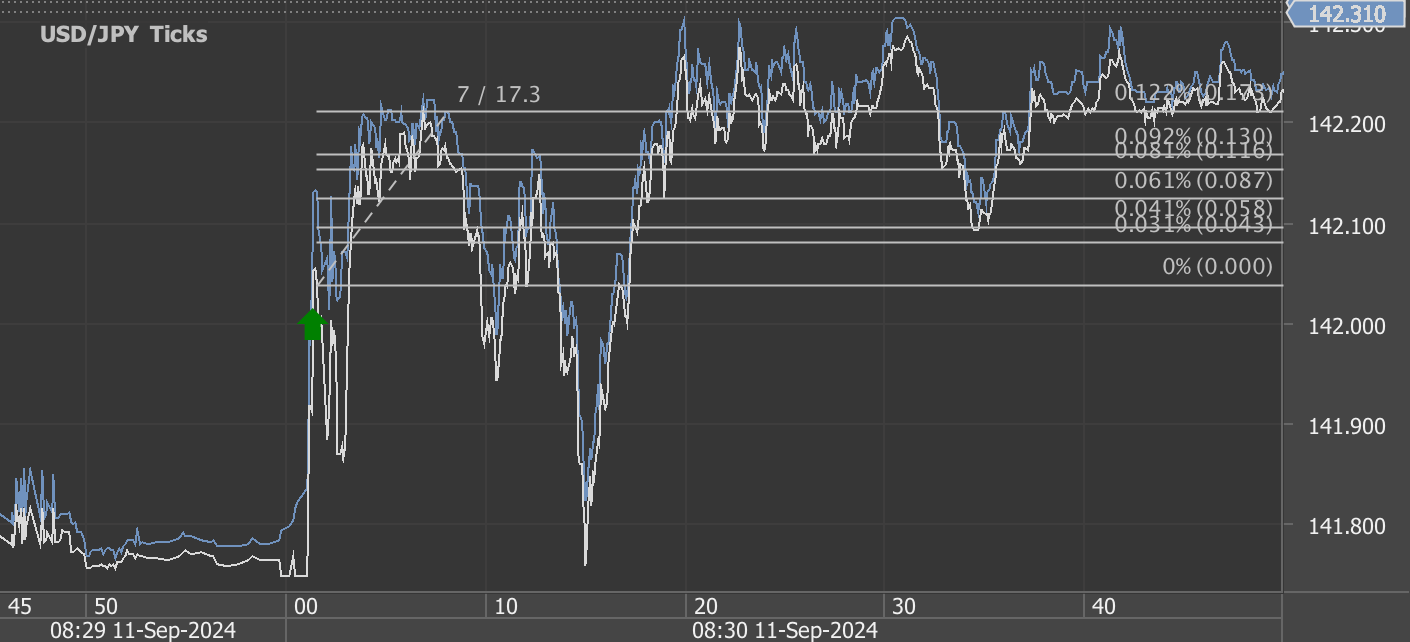
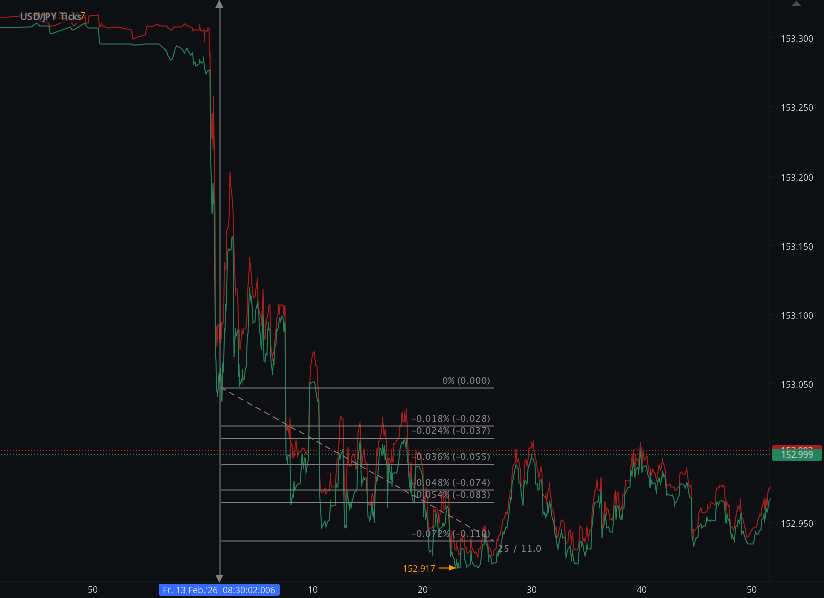
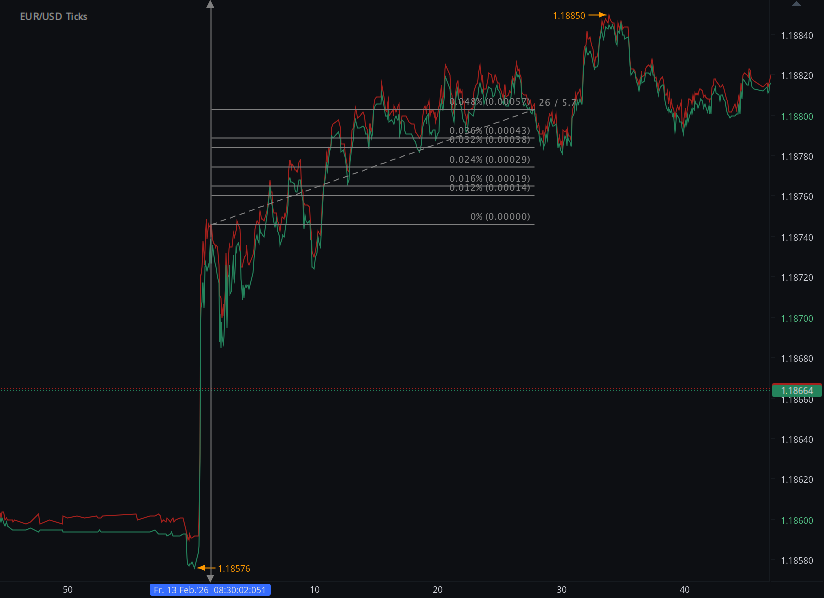
According to our analysis USDJPY and EURUSD moved 16 pips and US500 moved 12 points on US BLS Consumer Price Index (CPI) data on 13 February 2026.
USDJPY (11 pips)
EURUSD (5 pips)
US500 (12 points)
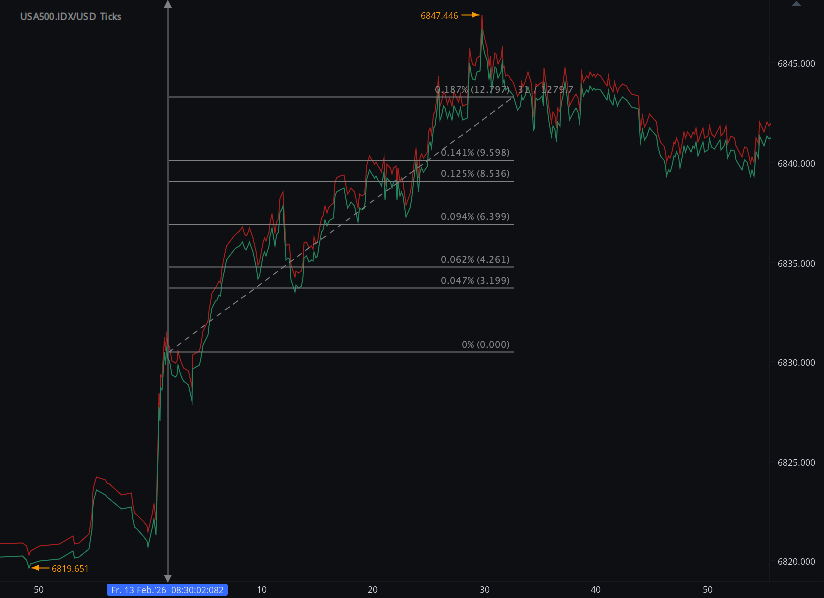
Charts are exported from JForex (Dukascopy).
Inflation Cools Further in January 2026 as Energy Prices Fall
The latest data from the U.S. Bureau of Labor Statistics show that inflation continued to moderate in January 2026, with overall price growth easing on both a monthly and annual basis.
Headline Inflation: Modest Monthly Increase
The Consumer Price Index for All Urban Consumers (CPI-U) rose 0.2 percent in January (seasonally adjusted). Over the past 12 months, prices increased 2.4 percent, down from 2.7 percent in December.
This marks continued progress toward price stability, with year-over-year inflation now firmly in the mid-2 percent range.
What Drove January’s Increase?
Several categories contributed to the monthly increase:
Shelter: +0.2%
Food: +0.2%
Core inflation (all items less food and energy): +0.3%
However, falling energy prices helped offset some of the upward pressure.
Energy Prices: A Key Relief Factor
Energy prices declined 1.5 percent in January, providing a notable offset to increases elsewhere.
Gasoline: −3.2% (−7.5% over the past year)
Electricity: −0.1% (but +6.3% over the past year)
Natural gas: +1.0% (+9.8% over the past year)
Over the last 12 months, overall energy prices are down 0.1 percent, largely due to the steep annual decline in gasoline.
Food Prices: Gradual but Persistent Growth
Food prices increased 0.2 percent in January.
Grocery Prices (Food at Home): +0.2%
Five of six major grocery categories rose:
Cereals and bakery products: +1.2%
Dairy products: +0.8%
Meats, poultry, fish, and eggs: +0.2%
Fruits and vegetables: +0.1%
Nonalcoholic beverages: +0.1%
On a 12-month basis, grocery prices are up 2.1 percent.
Dining Out (Food Away from Home): +0.1%
Restaurant prices rose more modestly in January but are still up 4.0 percent over the past year, with:
Full service meals: +4.7%
Limited service meals: +3.2%
Restaurant inflation continues to outpace grocery inflation.
Core Inflation: Services Still Firm
Core CPI (excluding food and energy) rose 0.3 percent in January and is up 2.5 percent year-over-year.
Key contributors:
Shelter
+0.2% in January
+3.0% over the past year
Owners’ equivalent rent and rent both rose 0.2% for the month.
Transportation Services
+1.4% in January
Airline fares surged 6.5% for the month.
Medical Care
+0.3% in January
+3.9% over the past year
Hospital services: +0.9% in January
Used Cars
−1.8% in January
−2.0% over the past year
Vehicle prices continue to normalize after earlier volatility.
Big Picture: Inflation Is Cooling, But Not Gone
Here’s where inflation stands:
Category12-Month ChangeAll Items2.4%Core (less food & energy)2.5%Food2.9%Energy−0.1%Shelter3.0%
The overall trend shows:
Energy prices helping moderate inflation.
Core services (especially shelter and medical care) continuing to rise.
Restaurant inflation remaining elevated.
Goods prices (like used vehicles) generally softening.
Additional Notes
The CPI index level now stands at 325.252 (1982–84 = 100).
CPI-W (Urban Wage Earners and Clerical Workers) rose 2.2% year-over-year.
The Chained CPI (C-CPI-U) increased 2.2% year-over-year.
October and November 2025 data were unavailable due to the 2025 lapse in appropriations.
Seasonal adjustment factors were revised, affecting data back five years.
What to Watch Next
The February 2026 CPI report will be released on March 11, 2026.
Markets and policymakers will be watching closely to see:
Whether energy continues to ease pressure,
If shelter inflation continues to moderate,
And whether core services remain sticky.
For now, January’s data suggest inflation is gradually stabilizing, though certain categories—particularly services—remain areas of persistent upward pressure.
Disclaimer: This blog post is for informational purposes only and should not be construed as financial advice. Always conduct thorough research and consider seeking advice from a financial professional before making any investment decisions.
Start futures forex fx news trading with Haawks G4A low latency machine-readable data, one of the fastest machine-readable news trading feed for US macro-economic and commodity data.
Please let us know your feedback. If you are interested in timestamps, please send us an email to sales@haawks.com.