Viewing entries tagged
US

Comment

64 pips and US500 14 points potential profit in 58 seconds on 11 September 2025, analysis on futures forex fx news trading USDJPY, EURUSD and US500 on US CPI and US Jobless Claims data

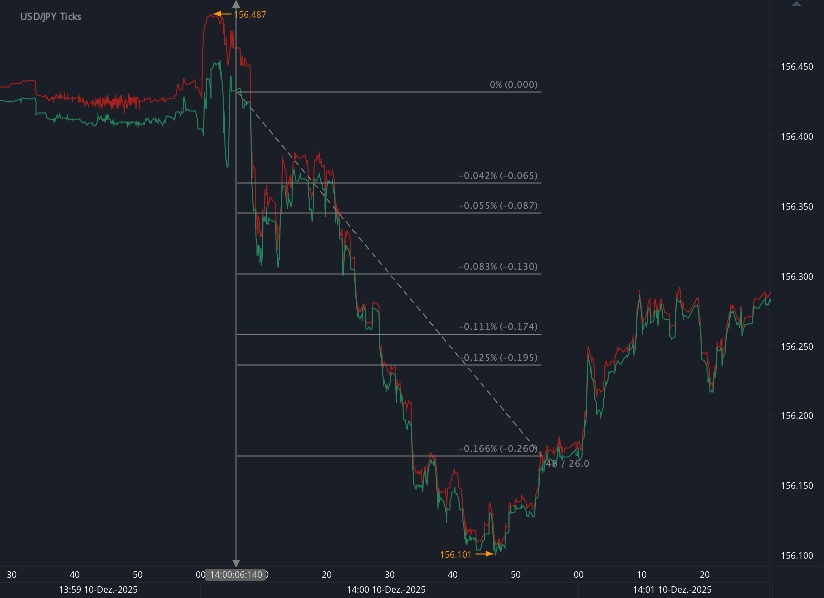
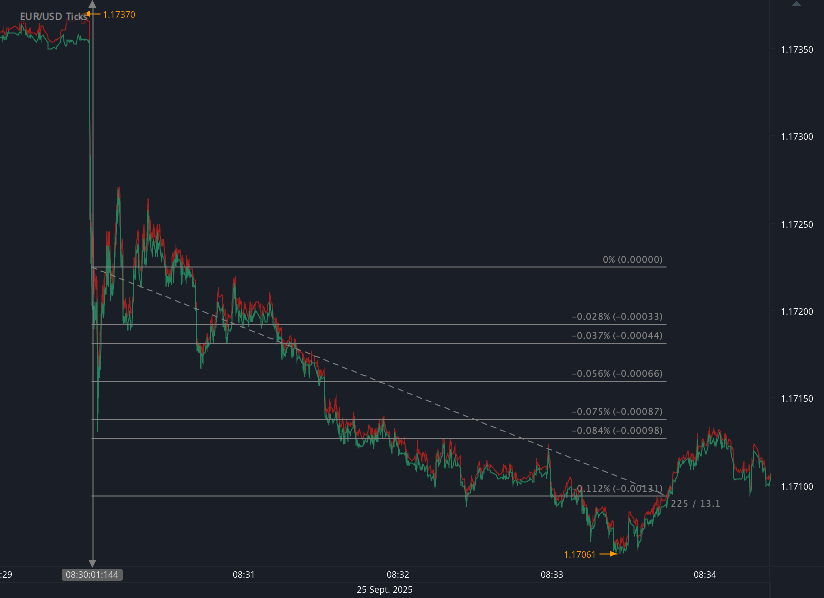
According to our analysis USDJPY and EURUSD moved 64 pips and US500 moved 14 points on US CPI and US Jobless Claims data on 11 September 2025.

USDJPY (39 pips)

EURUSD (25 points)

US500 (14 points)

Charts are exported from JForex (Dukascopy).


US Economy Watch: Claims Jump to 263K, CPI Re-Accelerates to 2.9% YoY

Date: September 11, 2025 (8:30 a.m. ET releases)
Sources: U.S. Department of Labor (weekly jobless claims) & U.S. Bureau of Labor Statistics (CPI)

1) Labor market: initial claims pop to a 4-year high

  • Initial jobless claims (SA): 263,000 for the week ending Sept. 6, up 27,000 from the prior week’s revised 236,000.

    • This is the highest level since Oct. 23, 2021 (268,000).

  • 4-week moving average: 240,500 (+9,750), signaling a clear uptrend beyond weekly noise.

  • Continuing claims (SA): 1.939 million for the week ending Aug. 30, unchanged; insured unemployment rate steady at 1.3%.

Unadjusted detail (signals beneath the seasonal factors):

  • Initial claims (NSA): 204,581, up 7,869 week over week. Seasonal factors had expected a decrease, so the upside surprised.

  • Continuing claims (NSA): 1,814,469, down 77,729 from the prior week.

State color:

  • Biggest weekly increases in initial claims (NSA) for the week ending Aug. 30: Tennessee (+2,870; manufacturing layoffs), Connecticut (+2,270), New York (+1,683; transportation/warehousing, construction, arts & recreation), Illinois (+1,331; manufacturing, wholesale, retail, construction).

  • Biggest decline: Kentucky (-2,833; manufacturing layoffs).

  • Highest insured unemployment rates (week ending Aug. 23): New Jersey (2.8%), Rhode Island (2.5%), Massachusetts (2.2%), Washington (2.1%); California, Connecticut, Minnesota, Puerto Rico (2.0%).

How to read it:
The spike to 263K breaks the prior 220–240K range and lifts the trend (4-week avg 240.5K). Continuing claims are flat, so we’re not yet seeing broad, persistent job loss, but leading indicators are flashing cooling momentum.

2) Inflation: August CPI firmed, led by shelter and energy

  • Headline CPI (SA): +0.4% m/m in August (vs. +0.2% in July).
    Year-over-year: +2.9%, up from 2.7%.

  • Core CPI (ex-food & energy): +0.3% m/m (same as July); +3.1% YoY.

  • Key drivers (m/m):

    • Shelter: +0.4% (largest contributor).

    • Food: +0.5%; food at home +0.6% (broad-based, with fruits & vegetables +1.6%; beef +2.7%).

    • Energy: +0.7% with gasoline +1.9%.

    • Mixed core components: airline fares +5.9%, used vehicles +1.0%, new vehicles +0.3%; medical care -0.2%.

12-month lens:

  • Headline: 2.9%; Core: 3.1%.

  • Food: +3.2% YoY; Energy: +0.2% YoY with a split—gasoline -6.6% vs. electricity +6.2% and natural gas +13.8%.

  • Shelter: +3.6% YoY (still sticky).

What it means:
Inflation progress stalled modestly in August: headline ticked up and core stayed firm at 0.3% m/m. The stickiness in shelter plus rebounds in travel/vehicles kept disinflation from accelerating.

3) The combined picture: cooling jobs momentum + sticky core

  • A higher claims print alongside firmer CPI complicates the near-term policy read: labor is loosening at the margin, but price pressures—particularly in shelter and select services—remain not-quite-tame.

  • Markets and policymakers will watch whether claims stay above ~250K and whether core CPI can downshift below 0.2–0.25% m/m in coming months.

4) Fast facts & charts (text version)

  • Initial claims: 263K (highest since Oct. 2021)

  • 4-wk avg: 240.5K

  • Continuing claims (SA): 1.939M; IUR: 1.3%

  • CPI (Aug): +0.4% m/m, 2.9% YoY

  • Core CPI: +0.3% m/m, 3.1% YoY

  • Big movers: Shelter +0.4% m/m; Food at home +0.6%; Gasoline +1.9%; Airline fares +5.9%

  • State hotspot: TN manufacturing layoffs; CT, NY, IL saw sizable increases in new claims

5) What to watch next

  • Next CPI: Oct. 15, 2025 (Wed), 8:30 a.m. ET (September data)

  • Weekly claims: Every Thursday, 8:30 a.m. ET—watch for confirmation of the step-up above 250K.

  • Shelter measures: Any moderation here would meaningfully aid core disinflation.

Disclaimer: This blog post is for informational purposes only and should not be construed as financial advice. Always conduct thorough research and consider seeking advice from a financial professional before making any investment decisions.

Source: https://www.dol.gov/ui/data.pdf, https://www.bls.gov/news.release/cpi.nr0.htm


Please let us know your feedback. If you are interested in timestamps, please send us an email to sales@haawks.com.

Start futures forex fx news trading with Haawks G4A low latency machine-readable data today, one of the fastest news data feeds for US macro-economic and commodity data.

Comment

Comment

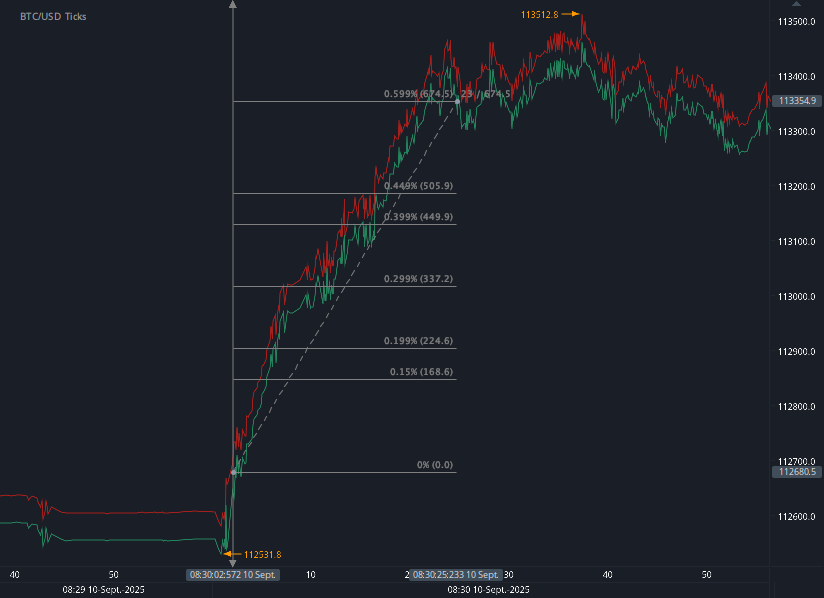
14 pips, BTC 674 points potential profit in 23 seconds on 10 September 2025, analysis on futures forex fx low latency news trading USDJPY, EURUSD and BTC on US BLS Producer Price Index (PPI) data

According to our analysis USDJPY and EURUSD moved 14 pips and BTC moved 674 points on US BLS Producer Price Index (PPI) data on 10 September 2025.

USDJPY (10 pips)

EURUSD (4 pips)

BTC (674 points)

Charts are exported from JForex (Dukascopy).


U.S. Producer Prices Slip in August; Core PPI (Ex-Food & Energy) Down 0.1%

The Bureau of Labor Statistics reported that headline PPI for final demand fell 0.1% in August 2025. Over the past year, producer prices are up 2.6%.

Key takeaways

  • Core PPI (ex food & energy) fell 0.1% m/m and is up 2.8% y/y.

  • Final demand services declined 0.2% m/m, led by a 1.7% drop in trade service margins (wholesalers/retailers).

  • Final demand goods edged +0.1% m/m: core goods rose +0.3%, foods +0.1%, while energy -0.4%.

  • Within services, margins for machinery & vehicle wholesaling -3.9%, while portfolio management +2.0% and freight +0.9% rose.

  • Intermediate stages were mixed: processed goods +0.4%, unprocessed goods -1.1%, and services +0.3%.

What’s moving underneath

  • Goods firmness came from tobacco (+2.3%), beef, processed poultry, electronics components, and electric power.

  • Offsets included utility natural gas (-1.8%), vegetables, eggs, and copper scrap.

  • On the pipeline side, stage 4 intermediate demand +0.5% (11th straight rise), while stage 2 -0.2%.

Why this matters

A negative core print (ex food & energy) at -0.1% m/m suggests some cooling in underlying producer-level inflation even as select core goods remain sticky. Combined with softer services margins, August points to easing pipeline pressures, though the y/y pace remains above pre-pandemic norms.

Next up: September PPI arrives October 16, 2025.

Disclaimer: This blog post is for informational purposes only and should not be construed as financial advice. Always conduct thorough research and consider seeking advice from a financial professional before making any investment decisions.

Source: https://www.bls.gov/news.release/ppi.nr0.htm


Start futures forex fx news trading with Haawks G4A low latency machine-readable data, one of the fastest machine-readable news trading feed for US economic and commodity data.

Please let us know your feedback. If you are interested in timestamps, please send us an email to sales@haawks.com.

Comment

Comment

68 pips and BTC 306 points potential profit in 17 seconds on 5 September 2025, analysis on forex fx futures news trading USDJPY, EURUSD and BTC on US Employment Situation (NFP)

According to our analysis USDJPY and EURUSD moved 68 pips and BTC moved 306 points on US Employment Situation (Non-farm payrolls / NFP) data on 5 September 2025.

USDJPY (42 pips)

EURUSD (26 pips)

BTC (306 points)

Charts are exported from JForex (Dukascopy).


U.S. Jobs Report: August 2025 Employment Situation

The U.S. labor market showed little momentum in August 2025, according to the latest report from the Bureau of Labor Statistics (BLS). Nonfarm payroll employment edged up by just 22,000 jobs, while the unemployment rate held steady at 4.3%. Since April, overall job growth has been subdued, with gains in health care tempered by losses in government and energy-related industries.

Key Highlights from the Household Survey

  • Unemployment rate: 4.3%, essentially unchanged for the month.

  • Number of unemployed people: 7.4 million.

  • Long-term unemployment: 1.9 million, accounting for 25.7% of all unemployed, and up 385,000 over the past year.

  • Labor force participation: 62.3%, down 0.4 percentage point over the year.

  • Employment-population ratio: 59.6%, unchanged from July but also down over the year.

  • Part-time for economic reasons: 4.7 million, little changed in August.

  • Not in the labor force but want a job: 6.4 million, up 722,000 compared to last year.

Unemployment rates across major demographic groups—adult men (4.1%), adult women (3.8%), teenagers (13.9%), Whites (3.7%), Blacks (7.5%), Asians (3.6%), and Hispanics (5.3%)—showed little or no movement.

Key Highlights from the Establishment Survey

  • Total payroll employment: +22,000 jobs in August.

  • Health care: +31,000 jobs, led by gains in ambulatory services, hospitals, and nursing/residential care.

  • Social assistance: +16,000 jobs, mainly in individual and family services.

  • Federal government: -15,000 jobs, continuing a steady decline since January (down 97,000 total).

  • Mining, quarrying, and oil & gas extraction: -6,000 jobs, the sharpest monthly drop in over a year.

  • Wholesale trade: -12,000 jobs, down 32,000 since May.

  • Manufacturing: -12,000 jobs, with a notable -15,000 decline in transportation equipment manufacturing, partly due to strike activity.

Other major sectors—including construction, retail trade, financial activities, leisure and hospitality—showed little change in August.

Wages and Work Hours

  • Average hourly earnings: $36.53, up 10 cents (0.3%) in August. Over the past year, wages increased by 3.7%.

  • Production and nonsupervisory employees: $31.46 per hour, up 12 cents (0.4%).

  • Average workweek: 34.2 hours for all employees, unchanged for the third straight month.

  • Manufacturing workweek: slipped slightly to 40.0 hours, with overtime steady at 2.9 hours.

Revisions to Prior Months

  • June 2025 revised down to -13,000 (from +14,000).

  • July 2025 revised up to +79,000 (from +73,000).

  • Combined revisions: net 21,000 fewer jobs than previously reported.

What’s Next?

The September Employment Situation Report will be released on Friday, October 3, 2025. In addition, the BLS will issue its 2025 preliminary benchmark revision to payroll data on September 9, 2025, aligning survey estimates with unemployment insurance records.

Takeaway

The August report underscores a cooling labor market: job gains remain concentrated in health and social services, while government, manufacturing, and energy sectors shed jobs. Wage growth continues at a moderate pace, but labor force participation remains historically low. With revisions showing weaker summer job growth than initially reported, policymakers and businesses alike may be watching closely for signs of whether this slowdown persists into the fall.

Disclaimer: This blog post is for informational purposes only and should not be construed as financial advice. Always conduct thorough research and consider seeking advice from a financial professional before making any investment decisions.

Source: https://www.bls.gov/news.release/empsit.nr0.htm


Start forex fx futures news trading with Haawks G4A low latency machine-readable data today, one of the fastest news data feeds for US macro-economic and commodity data.

Please let us know your feedback. If you are interested in timestamps, please send us an email to sales@haawks.com.

Comment

Comment

22 pips and BTC 144 points potential profit in 62 seconds on 3 September 2025, analysis on futures forex fx news trading EURUSD, USDJPY and BTC on US BLS Job Openings and Labor Turnover Survey (JOLTS)

According to our analysis USDJPY and EURUSD moved 22 pips and BTC moved 144 points on US BLS Job Openings and Labor Turnover Survey (JOLTS) data on 3 September 2025.

USDJPY (15 pips)

EURUSD (7 pips)

BTC (144 points)

Charts are exported from JForex (Dukascopy).


U.S. Job Openings Hold Steady in July as Hiring and Quits Show Little Movement

The latest Job Openings and Labor Turnover Survey (JOLTS) from the Bureau of Labor Statistics (BLS), released on September 3, 2025, shows a labor market that remains steady through midsummer. Job openings, hiring, and separations in July all showed little change compared with the prior month, suggesting employers and workers are maintaining a cautious but stable pace.

Job Openings: 7.2 Million Positions Available

At the end of July, the number of job openings stood at 7.2 million, representing a 4.3% openings rate. That figure was largely unchanged from June, but sector-level trends showed movement:

  • Health care and social assistance saw the largest decline, with openings down 181,000.

  • Arts, entertainment, and recreation dropped by 62,000.

  • Mining and logging edged down by 13,000.

This cooling in demand contrasts with broader stability across most other industries.

Hiring Activity Remains Flat

Employers hired 5.3 million workers in July, holding the hires rate at 3.3%. The biggest mover was the other services sector, which added 86,000 hires, offsetting weaker activity elsewhere. For most industries, however, hiring levels showed little change.

Separations: A Balanced Picture

Separations—workers leaving jobs due to quits, layoffs, discharges, or other reasons—also stayed steady at 5.3 million (3.3%). Within that:

  • Quits remained at 3.2 million (2.0%), showing workers’ confidence in job switching has leveled off.

    • Quits increased in professional and business services (+197,000).

    • Quits decreased in construction (-80,000) and transportation, warehousing, and utilities (-49,000).

  • Layoffs and discharges held at 1.8 million (1.1%), with notable shifts:

    • Down in professional and business services (-130,000).

    • Up slightly in the federal government (+5,000).

  • Other separations (retirements, deaths, transfers, etc.) fell to 272,000, a drop of 63,000.

Revisions to June Data

The BLS also revised June figures:

  • Job openings were adjusted down by 80,000 to 7.4 million.

  • Hires revised up by 63,000 to 5.3 million.

  • Total separations revised up by 281,000 to 5.3 million.

These adjustments reflect additional employer reports and updated seasonal calculations.

What This Means

The July JOLTS data points to a labor market in equilibrium—not overheating, but not contracting sharply either. Openings remain well above pre-pandemic norms, but hiring and quits suggest both employers and workers are proceeding with caution.

Industries like professional and business services are still dynamic, while sectors such as construction and health care show softening demand. Overall, the numbers underscore a jobs market that is neither surging nor slumping, but settling into a steadier pattern.

The next JOLTS report, covering August 2025, is scheduled for release on September 30, 2025.

Disclaimer: This blog post is for informational purposes only and should not be construed as financial advice. Always conduct thorough research and consider seeking advice from a financial professional before making any investment decisions.

Source: https://www.bls.gov/news.release/jolts.nr0.htm


Start futures #forex fx news #trading with Haawks G4A low latency machine-readable data today, one of the fastest news data feeds for US macro-economic and commodity data.

Please let us know your feedback. If you are interested in timestamps, please send us an email to sales@haawks.com.
Comment

Comment

15 pips potential profit in 36 seconds on 28 August 2025, analysis on futures forex fx low latency news trading USDJPY and EURUSD on US Gross Domestic Product (GDP) data

According to our analysis USDJPY and EURUSD moved 15 pips on US Gross Domestic Product (GDP) data on 28 August 2025.

USDJPY (12 pips)

EURUSD (3 pips)

Charts are exported from JForex (Dukascopy).


U.S. Economy Rebounds in Q2 2025: GDP Grows 3.3%

The U.S. economy showed strong momentum in the second quarter of 2025, according to the Bureau of Economic Analysis (BEA). After contracting slightly in the first quarter, real gross domestic product (GDP) grew at an annual rate of 3.3% from April through June. This second estimate is stronger than the initial reading of 3.0%, reflecting upward revisions in investment and consumer spending.

What’s Driving Growth?

The rebound in GDP was fueled by:

  • Fewer imports – A decline in imports, which are subtracted in GDP calculations, gave the headline number a lift.

  • Stronger consumer spending – Household demand accelerated, particularly in health care, pharmaceuticals, food services, and accommodations.

  • Investment gains – Upward revisions in intellectual property (software and R&D), equipment (led by light trucks), and structures (notably commercial and health care) all contributed.

These positive shifts were partly offset by weaker government spending and higher imports of certain goods, such as industrial supplies and capital goods.

Key Economic Indicators from Q2 2025

  • Real GDP: +3.3% (up from -0.5% in Q1)

  • Current-dollar GDP: +5.3%

  • Real Final Sales to Private Domestic Purchasers: +1.9% (a sharp upward revision from +1.2%)

  • Real Gross Domestic Income (GDI): +4.8% (vs. +0.2% in Q1)

  • Average of GDP and GDI: +4.0%

  • Price Index for Gross Domestic Purchases: +1.8%

  • PCE Price Index: +2.0% (2.5% excluding food and energy)

Corporate Profits Bounce Back

After falling $90.6 billion in the first quarter, corporate profits rose by $65.5 billion in Q2. The turnaround signals improving business conditions alongside consumer strength.

Inflation Check

Inflation pressures remained moderate:

  • The gross domestic purchases price index rose 1.8%.

  • The PCE price index, the Federal Reserve’s preferred gauge, climbed 2.0%.

  • Core PCE (excluding food and energy) rose 2.5%, unchanged from the initial estimate.

Why the Upward Revision?

The BEA revised Q2 growth higher mainly because of:

  • Better-than-expected consumer spending on goods and services.

  • New data showing stronger business investment in software, R&D, light trucks, and construction.

  • Adjustments in trade data, especially petroleum exports and industrial supplies imports.

What’s Next?

The BEA will release its third estimate of Q2 GDP along with updated data on GDP by industry and revised corporate profits on September 25, 2025. This release will also incorporate results from the annual update of the National Economic Accounts, which could shift historical growth patterns.

Bottom Line

After a sluggish start to 2025, the U.S. economy appears to be on a firmer footing. Robust consumer demand, healthier corporate profits, and easing inflation pressures suggest that growth could continue into the second half of the year—though much will depend on investment trends, trade dynamics, and the Federal Reserve’s policy stance.

Disclaimer: This blog post is for informational purposes only and should not be construed as financial advice. Always conduct thorough research and consider seeking advice from a financial professional before making any investment decisions.

Source: https://www.bea.gov/news/2025/gross-domestic-product-2nd-quarter-2025-second-estimate-and-corporate-profits-preliminary


Start futures forex fx news trading with Haawks G4A low latency machine-readable data, one of the fastest machine-readable news trading feeds for macro-economic and commodity data from the US and Europe.

Please let us know your feedback. If you are interested in timestamps, please send us an email to sales@haawks.com.

Comment

Comment

42 pips, BTC 437 points potential profit in 50 seconds on 14 August 2025, analysis on futures forex fx low latency news trading USDJPY, EURUSD and BTC on US BLS Producer Price Index (PPI) data

According to our analysis USDJPY and EURUSD moved 42 pips and BTC moved 437 points on US BLS Producer Price Index (PPI) data on 14 August 2025.

USDJPY (28 pips)

EURUSD (14 pips)

BTC (437 points)

Charts are exported from JForex (Dukascopy).


Key Takeaways: July 2025 PPI

1. Overall Movement

  • Final demand PPI rose 0.9% in July (seasonally adjusted).

  • On a 12-month basis, final demand prices were up 3.3%, the largest increase since February 2025.

2. Goods vs. Services

  • Services: Up 1.1%—major driver of the July increase.

    • Trade services (margins for wholesalers/retailers) jumped 2%.

    • Machinery & equipment wholesaling margins alone accounted for 30% of the rise.

    • Some declines: hospital outpatient care (-0.5%), furniture retailing, pipeline energy transport.

  • Goods: Up 0.7%.

    • Food: +1.4%, with fresh/dry vegetables +38.9%.

    • Energy: +0.9% (gasoline down 1.8%).

3. Core PPI (less food, energy, and trade services)

  • Rose 0.6% in July.

  • On a 12-month basis, up 2.8%—largest rise since March 2022.

Intermediate Demand (inputs for other goods/services)

  • Processed goods: +0.8%, driven by diesel fuel (+11.8%).

  • Unprocessed goods: +1.8%, led by raw milk (+9.1%).

  • Services: +0.8%, driven by financial and postal/courier services.

By Production Stage

  • Stage 1 (raw materials/services entering production): +1.1%

  • Stage 2: +0.5%

  • Stage 3: +1.1%

  • Stage 4 (finished goods/services before sale to final demand): +0.8%

This shows that price pressures are broad-based, affecting raw inputs and final goods/services, with notable jumps in food, energy, and trade/service margins.

Implications

  • Inflation signal: PPI rising at these rates suggests continuing cost pressures that could eventually feed into consumer prices (CPI).

  • Sector insights:

    • Food and energy remain volatile.

    • Trade margins are a major contributor, showing higher costs along distribution chains.

    • Financial services costs are climbing (portfolio management, securities).

Disclaimer: This blog post is for informational purposes only and should not be construed as financial advice. Always conduct thorough research and consider seeking advice from a financial professional before making any investment decisions.

Source: https://www.bls.gov/news.release/ppi.nr0.htm


Start futures forex fx news trading with Haawks G4A low latency machine-readable data, one of the fastest machine-readable news trading feed for US economic and commodity data.

Please let us know your feedback. If you are interested in timestamps, please send us an email to sales@haawks.com.

Comment

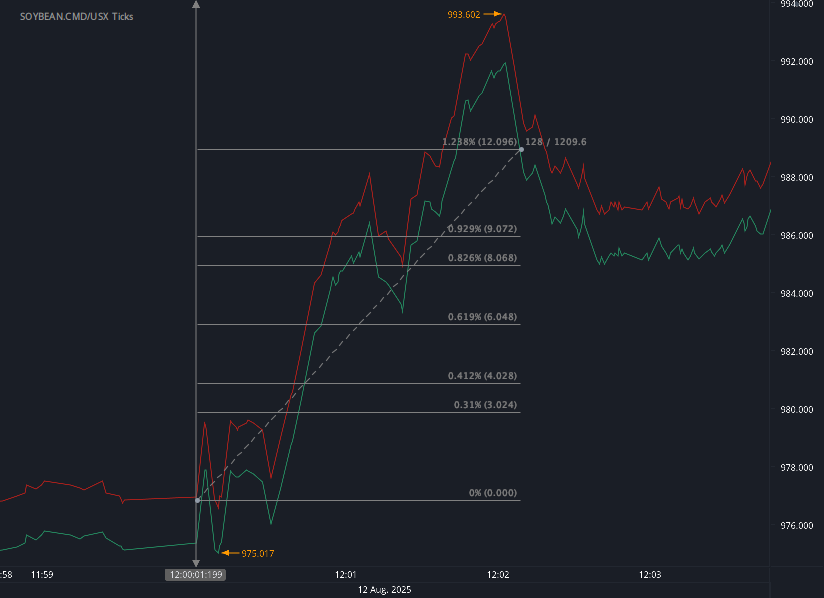
96 ticks potential profit on 12 August 2025, analysis on trading corn, wheat and soybeans futures on USDA WASDE data

Comment

96 ticks potential profit on 12 August 2025, analysis on trading corn, wheat and soybeans futures on USDA WASDE data

According to our analysis corn (ZC), wheat (WC) and soybeans (ZS) futures prices moved around 96 ticks (28 ticks, 20 ticks, 48 ticks) on USDA WASDE (World Agricultural Supply and Demand Estimates) data on 12 August 2025.

Soybeans (48 ticks)

Charts are exported from JForex (Dukascopy).


August 2025 WASDE Report: Record Crops, Price Shifts, and Global Supply Changes

The USDA’s latest World Agricultural Supply and Demand Estimates (WASDE), released August 12, 2025, paints a complex picture for the coming marketing year. While some U.S. crops are setting production records, others are tightening in supply, with global market ripples reaching nearly every major commodity. Here’s a breakdown of the key takeaways.

Wheat: Slightly Tighter in the U.S., Lower Stocks Worldwide

  • U.S. Outlook:

    • Supplies: Down slightly to 1.927 billion bushels due to reduced harvested area, even as yields tick up to 52.7 bu/acre.

    • Use: Domestic use trimmed by 5 million bushels (mainly food), but exports up 25 million thanks to strong sales of Hard Red Winter wheat.

    • Ending Stocks: Cut to 869 million bushels.

    • Price: Lowered 10 cents to $5.30/bu.

  • Global Outlook:

    • Supplies: Down 2.5 million tons due to lower production in China, Brazil, and Argentina.

    • Consumption: Down 1.1 million tons, with feed use weaker in several Asian countries.

    • Trade: Slightly higher, led by U.S. exports.

    • Ending Stocks: Dropped to 260.1 million tons, the lowest since 2015/16.

Corn & Coarse Grains: Record U.S. Crop, Prices Under Pressure

  • U.S. Corn:

    • Production: A record 16.7 billion bushels, up 1 billion from last month on bigger acreage and a yield forecast of 188.8 bu/acre.

    • Use: Domestic use up 545 million bushels, with feed demand surging.

    • Exports: Projected record 2.9 billion bushels.

    • Ending Stocks: Up to 2.1 billion bushels, highest since 2018/19.

    • Price: Lowered 30 cents to $3.90/bu.

  • Global Coarse Grains:

    • Production: Higher overall, but foreign output down in the EU and Serbia from heat/dryness.

    • Stocks: Global corn ending stocks up to 282.6 million tons.

Rice: Bigger U.S. Harvest, Global Stocks Ease

  • U.S. Outlook:

    • Production: 208.5 million cwt, higher on acreage despite a yield drop.

    • Exports: Up to 97 million cwt, with strong medium/short-grain sales to Japan.

    • Ending Stocks: 44.6 million cwt, down 12% year-over-year.

    • Price: Higher for California medium/short-grain, overall $14.20/cwt.

  • Global Outlook:

    • Supplies: Slight dip to 728.7 million tons.

    • Consumption: Record 542 million tons.

    • Ending Stocks: Down to 186.7 million tons.

Oilseeds: U.S. Soybeans Tighter on Lower Area

  • U.S. Soybeans:

    • Production: 4.3 billion bushels, down 43 million on smaller acreage despite higher yields (53.6 bu/acre).

    • Exports: Cut 40 million bushels on slow early sales.

    • Ending Stocks: Down to 290 million bushels.

    • Price: Unchanged at $10.10/bu.

  • Global Soybeans:

    • Production: Lower in the U.S. and Serbia.

    • Stocks: Down 1.2 million tons to 124.9 million.

Sugar: More U.S. Supply, Higher Stocks

  • 2025/26 U.S. Sugar:

    • Production: Higher for both beet and cane sugar, especially in Louisiana.

    • Ending Stocks: Up to 2.16 million STRV, boosting the stocks-to-use ratio to 17.75%.

Livestock, Poultry & Dairy: Shifts in Meat Mix, Firm Milk Output

  • Meat Production:

    • Beef & Pork: Lower on reduced slaughter and lighter weights.

    • Poultry: Broilers up; turkey down. Eggs slightly lower.

  • Prices:

    • Cattle & Hogs: Higher into 2026.

    • Broilers: Lower in the second half of 2025.

    • Turkey: Higher on tight red meat supplies.

    • Milk: Output forecasts raised; 2025 all-milk price steady at $22.00/cwt.

Cotton: Smaller U.S. Crop Tightens Supplies

  • Production: Cut to 13.2 million bales, down 1.4 million from July on higher abandonment in the Southwest.

  • Exports: Down 500,000 bales.

  • Ending Stocks: Down to 3.6 million bales.

  • Price: Up to 64¢/lb.

  • Global: Production, consumption, and trade all down; ending stocks reduced over 3.4 million bales.

The Big Picture

August’s WASDE tells two main stories: record corn production pushing prices down and tightness in wheat, soybeans, cotton, and some livestock products supporting prices. Global weather, shifting trade patterns, and domestic supply surges are setting up a marketing year of both opportunity and volatility.

Disclaimer: This blog post is for informational purposes only and should not be construed as financial advice. Always conduct thorough research and consider seeking advice from a financial professional before making any investment decisions.

Source: https://www.usda.gov/oce/commodity/wasde/wasde0825.pdf


Haawks G4A is one of the fastest machine-readable data feeds for USDA data. We are beating big names in the industry by seconds. Coverage includes monthly USDA WASDE (World Agricultural Supply and Demand Estimates), quarterly USDA Grain Stocks and yearly USDA Prospective Plantings and USDA Acreage.

Please let us know your feedback. If you are interested in timestamps, please send us an email to sales@haawks.com.

Comment

Comment

59 pips, US500 17 points, BTC 461 points potential profit in 72 seconds on 12 August 2025, analysis on futures forex fx low latency news trading EURUSD, USDJPY, US500, BTC on US CPI

According to our analysis USDJPY and EURUSD moved 59 pips, US500 moved 17 points and BTC moved 461 points on US BLS Consumer Price Index (CPI) data on 12 August 2025.

USDJPY (35 pip)

EURUSD (24 pips)

US500 (17 points)

BTC (461 points)

Charts are exported from JForex (Dukascopy).


July 2025 Consumer Price Index (CPI) Update: What You Need to Know

The U.S. Bureau of Labor Statistics (BLS) released its Consumer Price Index (CPI) data for July 2025, offering important insights into inflation and price changes affecting everyday Americans. Here’s a breakdown of the key takeaways from the latest report:

Modest Monthly Increase in Overall Prices

The CPI for All Urban Consumers (CPI-U) rose by 0.2% in July on a seasonally adjusted basis, a slight slowdown from June’s 0.3% increase. Over the past year, prices have increased by 2.7%, showing steady but moderate inflation.

What’s Driving the July Increase?

  • Shelter Costs: The main contributor to the monthly rise was shelter, which increased by 0.2%. Rent and owners' equivalent rent both edged up, indicating that housing costs continue to be a significant factor in inflation.

  • Food Prices: The overall food index remained flat in July. However, food away from home (restaurants, takeout) saw a small 0.3% rise, while food at home (groceries) actually decreased slightly by 0.1%. Within groceries, dairy products and meats experienced price gains, but other categories like cereals and bakery products fell.

  • Energy Prices: Energy costs declined by 1.1%, largely due to a 2.2% drop in gasoline prices. Electricity and natural gas prices also edged lower, easing some pressure on household energy bills.

Core Inflation (Excluding Food and Energy)

Prices for all items excluding food and energy rose 0.3% in July, following a 0.2% increase in June. This category includes:

  • Medical Care: Increased notably, with dental services up 2.6% and hospital services also rising.

  • Transportation Services: Airline fares jumped 4.0%, reversing a previous decline.

  • Recreation, Household Furnishings, and Used Vehicles: All saw moderate price increases.

Conversely, lodging away from home and communication services saw price declines.

Year-Over-Year Inflation Trends

  • The all items index rose 2.7% over the past 12 months.

  • Core inflation (less food and energy) increased by 3.1%, reflecting ongoing upward pressure on many services and goods.

  • Energy prices dropped 1.6% year-over-year, driven largely by lower gasoline costs.

  • Food prices climbed 2.9%, with food away from home rising faster (3.9%) than food at home (2.2%).

Noteworthy Changes and Methodology Updates

  • The BLS has updated how it measures wireless telephone services prices by using alternative data sources and methods, aiming for more accurate inflation tracking in this sector.

  • Starting with October 2025 data, long-term care insurance will be removed from the health insurance index due to changes in that market.

What Does This Mean for You?

The July CPI data suggests that while inflation remains moderate, housing and medical care costs continue to be significant contributors to rising prices. Consumers may see some relief from falling energy prices, but dining out and healthcare expenses are becoming more costly.

Looking Ahead

The next CPI report is scheduled for release on September 11, 2025.

Disclaimer: This blog post is for informational purposes only and should not be construed as financial advice. Always conduct thorough research and consider seeking advice from a financial professional before making any investment decisions.

Source: https://www.bls.gov/news.release/cpi.nr0.htm


Start futures forex fx news trading with Haawks G4A low latency machine-readable data, one of the fastest machine-readable news trading feed for US macro-economic and commodity data.

Please let us know your feedback. If you are interested in timestamps, please send us an email to sales@haawks.com.

Comment

Comment

19 ticks potential profit in 35 seconds on 7 August 2025, analysis on futures news trading natural gas on DOE Natural Gas Storage Report data

According to our analysis natural gas moved 19 ticks on DOE Natural Gas Storage Report data on 7 August 2025.

Natural gas (19 ticks)

Charts are exported from JForex (Dukascopy).


Weekly Natural Gas Storage Update – August 7, 2025

Slight Build in Storage as Total Remains Above Five-Year Average

The U.S. Energy Information Administration (EIA) released its Weekly Natural Gas Storage Report today, covering storage levels as of August 1, 2025. The data reveals a modest net increase of 7 billion cubic feet (Bcf) in working natural gas storage across the Lower 48 states, bringing the total to 3,130 Bcf.

While this weekly increase is relatively small, the total stock remains 173 Bcf above the five-year average and 137 Bcf below the level at the same time last year.

Regional Highlights

  • East Region: Added 5 Bcf, now at 656 Bcf

  • Midwest Region: Increased by 10 Bcf to 775 Bcf

  • Mountain Region: Rose 6 Bcf to 249 Bcf

  • Pacific Region: Added 3 Bcf, reaching 305 Bcf

  • South Central Region: Notably drew down 17 Bcf, dropping to 1,145 Bcf

    • Salt facilities led this decrease with a 20 Bcf draw

    • Nonsalt facilities added 3 Bcf

Despite the overall increase, the South Central region’s withdrawal stands out, likely influenced by elevated cooling demand or shifting regional market dynamics.

Year-Over-Year and Historical Comparisons

  • Total working gas is 4.2% below the level from this time last year (3,267 Bcf in 2024)

  • However, storage remains 5.9% above the five-year average of 2,957 Bcf (2020–2024)

  • All regional storage levels remain within historical five-year ranges

What This Means

Natural gas storage is a critical indicator for energy markets, especially heading into the fall shoulder season. While we're seeing slight weekly builds, the below-average year-over-year total suggests tighter supply compared to 2024, possibly impacting prices if demand spikes due to weather or market shifts.

However, the continued surplus over the five-year average provides a buffer against potential volatility.

Looking Ahead

The next Weekly Natural Gas Storage Report will be released on August 14, 2025, and will cover storage data through August 8, 2025. Traders, utilities, and analysts will be closely monitoring updates to assess storage sufficiency ahead of the upcoming winter season.

Disclaimer: This blog post is for informational purposes only and should not be construed as financial advice. Always conduct thorough research and consider seeking advice from a financial professional before making any investment decisions.

Source: https://ir.eia.gov/ngs/ngs.html


Start futures forex fx commodity news trading with Haawks G4A low latency machine-readable data, one of the fastest data feeds for DOE data.

Please let us know your feedback. If you are interested in timestamps, please send us an email to sales@haawks.com.

Comment

Comment

157 pips and BTC 158 points potential profit in 305 seconds on 1 August 2025, analysis on forex fx futures news trading USDJPY, EURUSD and BTC on US Employment Situation (NFP)

According to our analysis USDJPY and EURUSD moved 157 pips and BTC moved 158 points on US Employment Situation (Non-farm payrolls / NFP) data on 1 August 2025.

USDJPY (76 pips)

EURUSD (81 pips)

BTC (158 points)

Charts are exported from JForex (Dukascopy).


July 2025 Jobs Report: U.S. Labor Market Shows Minimal Growth Amid Mixed Signals

The U.S. Bureau of Labor Statistics (BLS) released its July 2025 Employment Situation report, and the labor market continues to show signs of a cooling trend. With just 73,000 jobs added, the monthly job growth has remained tepid since April. The unemployment rate was unchanged at 4.2%, signaling a labor market in a holding pattern as economic uncertainty lingers.

Key Takeaways from July 2025:

Sluggish Job Growth

  • Nonfarm payroll employment rose by only 73,000, well below the average gains seen earlier in the year.

  • Revisions to previous months were significant: May was revised down by 125,000 jobs and June by 133,000, meaning a combined loss of 258,000 jobs from earlier estimates.

Unemployment Rate Holds Steady

  • The unemployment rate remained at 4.2%, largely unchanged since May 2024.

  • The number of unemployed people stood at 7.2 million.

Employment Trends by Sector:

Gains

  • Health care added 55,000 jobs, continuing a strong upward trend. Key contributors were:

    • Ambulatory health care services: +34,000

    • Hospitals: +16,000

  • Social assistance rose by 18,000, mainly driven by:

    • Individual and family services: +21,000

Losses

  • Federal government employment dropped by 12,000 in July and has declined by 84,000 since January.

No Significant Change

  • Industries such as manufacturing, construction, retail, professional services, and leisure and hospitality saw little to no movement.

Worker Demographics and Labor Force Participation:

  • Labor force participation rate: 62.2% (unchanged for the month, down 0.5 percentage points over the year)

  • Employment-population ratio: 59.6% (also little changed)

  • Long-term unemployed (27 weeks or more): Up 179,000 to 1.8 million, making up 24.9% of total unemployed

  • New entrants to the labor force (seeking their first job): Up 275,000 to 985,000

  • Discouraged workers: Decreased by 212,000 to 425,000, following an increase in the prior month

Wages and Work Hours:

  • Average hourly earnings for private nonfarm employees increased by $0.12 (0.3%) to $36.44

  • Over the past 12 months, wages rose by 3.9%

  • Average workweek: Increased slightly by 0.1 hour to 34.3 hours

Looking Ahead

While health care and social services continue to show resilience, the broader employment landscape is stagnating. Job creation has softened significantly, revisions to past reports indicate weaker momentum than previously thought, and long-term unemployment is creeping up.

The next jobs report—covering August—will be released on Friday, September 5, 2025. Additionally, the preliminary 2025 benchmark revision to employment data will be released on September 9, 2025, offering a deeper look into the actual state of the labor market using QCEW data.

Bottom Line: The July 2025 labor market report points to a slow summer for job growth. While wage gains and stable unemployment offer some reassurance, shrinking revisions and rising long-term unemployment suggest that the labor market is cooling more quickly than previously thought.

Disclaimer: This blog post is for informational purposes only and should not be construed as financial advice. Always conduct thorough research and consider seeking advice from a financial professional before making any investment decisions.

Source: https://www.bls.gov/news.release/empsit.nr0.htm


Start forex fx futures news trading with Haawks G4A low latency machine-readable data today, one of the fastest news data feeds for US macro-economic and commodity data.

Please let us know your feedback. If you are interested in timestamps, please send us an email to sales@haawks.com.

Comment