

HAAWKS Launches 40 Weekly USDA Export Sales Data Points
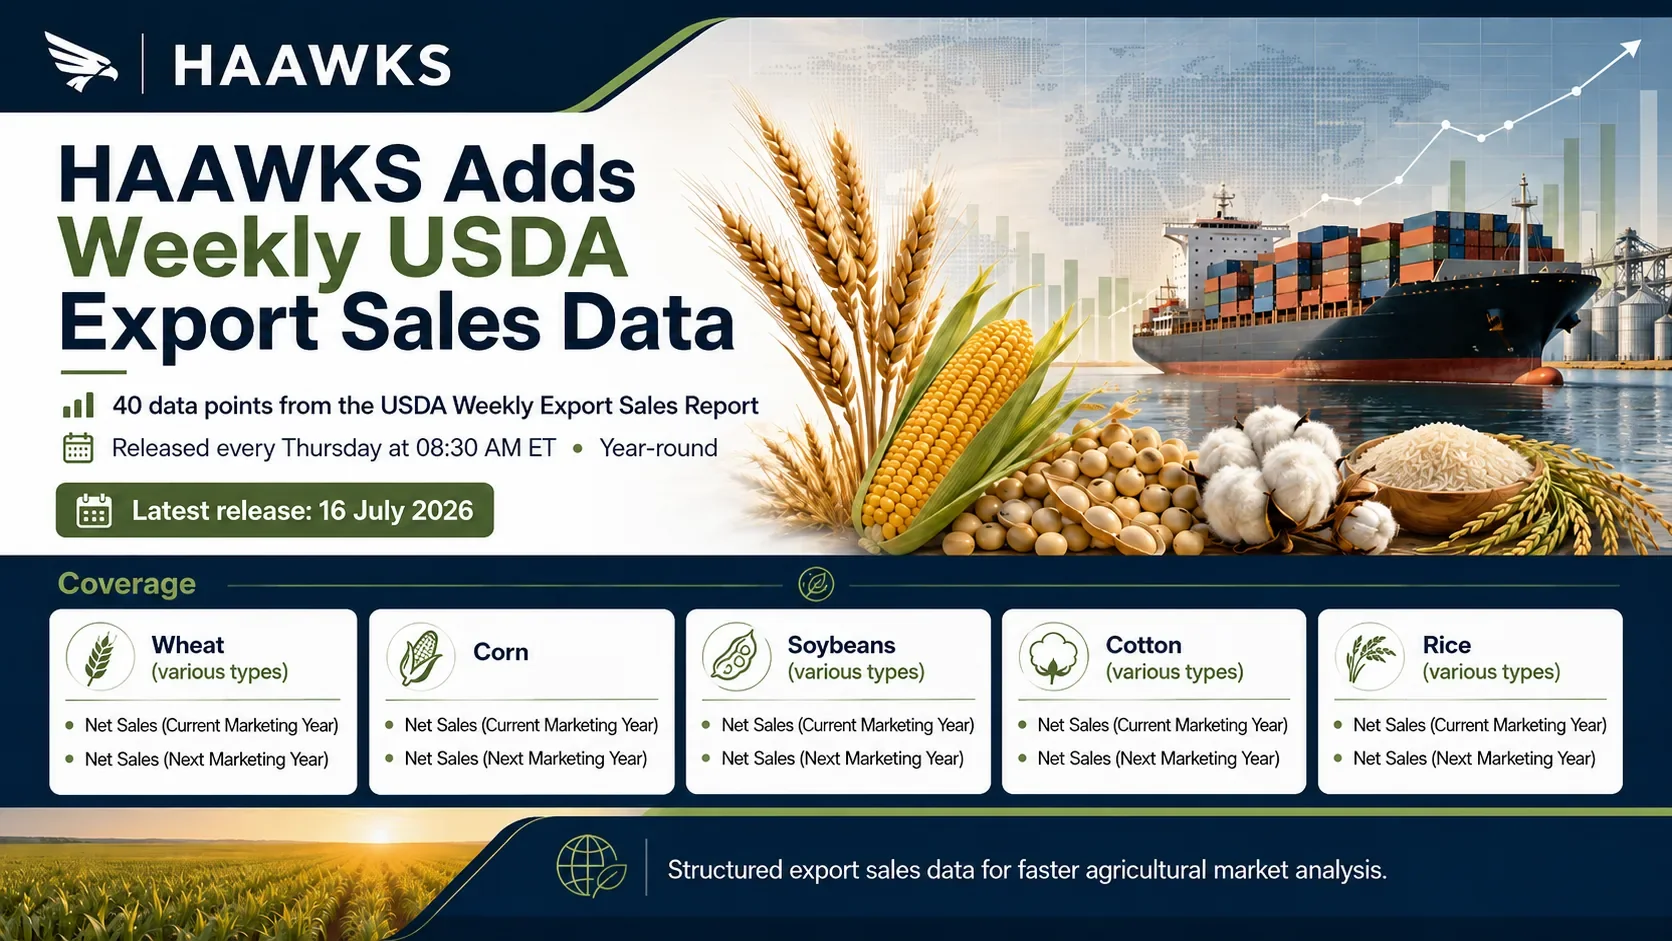
On Thursday, July 16, 2026, HAAWKS expanded its agricultural market coverage with the launch of 40 structured data points from the USDA Weekly Export Sales Report.
Published every Thursday at 8:30 AM ET throughout the year, the report provides one of the most timely official indicators of international demand for U.S. agricultural commodities.
The new HAAWKS dataset covers weekly net export sales for wheat, corn, soybeans, cotton, and rice, with separate values for the current and next marketing years.
Unlike reports released after agricultural markets have closed, the Weekly Export Sales Report is published while the principal futures contracts are actively trading. This makes speed, accurate normalization, and machine-readable delivery especially important for algorithmic and event-driven market participants.
What HAAWKS Delivers
HAAWKS will disseminate 40 data points covering five major commodity groups and their relevant product classifications.
| Commodity | Data Coverage |
|---|---|
|
Wheat Various types and classes |
Net sales for the current marketing year and next marketing year |
| Corn | Net sales for the current marketing year and next marketing year |
|
Soybeans Various types |
Net sales for the current marketing year and next marketing year |
|
Cotton Various types |
Net sales for the current marketing year and next marketing year |
|
Rice Various types |
Net sales for the current marketing year and next marketing year |
The individual product and commodity classifications provide more detailed information than a single headline export-sales figure. This allows users to identify differences in demand across crop types, qualities, and delivery periods.
Why Weekly Export Sales Matter
The USDA Weekly Export Sales Report provides a current view of overseas demand for U.S. agricultural products.
Strong net sales may indicate improving international demand, increased forward purchasing, or progress toward USDA full-year export projections. Weak sales, cancellations, or net reductions may point to softer demand, changing destination activity, or stronger competition from other exporting countries.
However, the market does not react only to whether sales appear high or low.
The most important signal is frequently the difference between the reported value and what market participants expected before the release.
A weekly corn export-sales figure may be supportive if it exceeds expectations, but the same figure may be disappointing if traders anticipated an even larger result.
For systematic analysis, the core event signal can be expressed as:
Export-sales surprise = reported net sales − expected net sales
The size and direction of that surprise can then be assessed alongside:
The previous reporting week
Recent weekly averages
Seasonal export patterns
Outstanding export commitments
Reported cancellations
Major destination activity
Progress toward USDA export projections
Current and next marketing year allocations
Current and Next Marketing Year Sales
HAAWKS provides separate data points for the current marketing year and the next marketing year.
Current marketing year net sales represent new commitments, adjustments, and cancellations for delivery during the active marketing year. These figures are particularly relevant to near-term demand and the pace required to meet annual export forecasts.
Next marketing year net sales represent forward commitments for delivery after the current marketing year ends. They can provide an early indication of demand for the upcoming crop cycle and may become increasingly important as the current marketing year approaches its conclusion.
Separating the two periods helps traders and analysts distinguish immediate demand from longer-term purchasing activity.
It also prevents a large next-year sale from being interpreted as an equally strong signal for nearby supply and demand conditions.
What Are Net Export Sales?
Net export sales represent newly reported sales after accounting for cancellations, reductions, destination changes, and other adjustments.
A positive number generally indicates that new sales exceeded cancellations and reductions during the reporting period.
A negative number can occur when cancellations or downward adjustments are larger than newly reported sales.
Net sales are therefore not the same as physical exports or shipments. A sale represents a commitment, while an export represents the physical movement of the commodity.
For a complete demand assessment, traders may compare net sales with:
Physical exports
Outstanding sales
Accumulated exports
Destination-level activity
Historical seasonal patterns
USDA annual export forecasts
Released During Active Futures Trading
The report is published every Thursday at 8:30 AM ET while major agricultural futures markets are open.
CME grain and oilseed futures, including corn, soybeans, and wheat, continue trading until 8:45 AM ET during the overnight session. Trading then pauses before the main daytime session begins at 9:30 AM ET.
ICE Cotton No. 2 futures are also actively trading at 8:30 AM ET.
This creates two important reaction windows.
| Time | Market Event | Relevance |
|---|---|---|
| 8:30 AM ET | USDA Weekly Export Sales Report released | Immediate data ingestion and event detection |
| 8:30–8:45 AM ET | CME grain and oilseed futures remain open | Initial algorithmic price discovery |
| 8:45–9:30 AM ET | CME grain and oilseed trading pause | Further analysis and order preparation |
| 9:30 AM ET | CME daytime session begins | Broader liquidity and potential follow-through |
| 9:30 AM ET | Regular U.S. stock and ETF trading begins | Potential reaction in related listed instruments |
The 15-minute period between the report release and the end of the overnight CME session is especially relevant for automated traders.
During this window, systems can ingest the new figures, compare them with expectations, identify material surprises, apply risk controls, and generate trading signals while the underlying futures remain tradable.
Directly Relevant Markets
The data is most directly relevant to futures and options linked to the commodities included in the report:
CBOT corn futures and options
CBOT soybean futures and options
CBOT wheat futures and options
KC hard red winter wheat futures and options
Minneapolis hard red spring wheat futures and options
ICE Cotton No. 2 futures and options
CBOT rough rice futures and options
The report may also be relevant to related commodity spreads and processing relationships, including soybean crush components and differences among wheat classes.
The strength of the market reaction depends on more than the headline figure. It can also be affected by the reporting period, destination, size of revisions or cancellations, seasonal demand, existing positioning, liquidity, and whether the result was already anticipated.
Designed for Algorithmic Trading Workflows
Many HAAWKS clients consume market news through automated or algorithmic systems rather than by manually reading and interpreting reports.
For these users, an official report published as a document or web page must first be converted into standardized fields before it can be used reliably.
HAAWKS transforms the USDA release into structured data points designed for systematic consumption.
The dataset can support workflows such as:
Real-time event detection
Automated estimate comparison
Surprise calculation
Commodity and product classification
Current-year and next-year separation
Cancellation and net-reduction detection
Historical event analysis
Quantitative model inputs
Automated alerts
Trading signal generation
Risk-management checks
Dashboard and API integration
Consistent field definitions are particularly important when the same report contains numerous commodities, product types, marketing years, destinations, and adjustments.
By normalizing the data, HAAWKS allows systems to compare each new observation with prior releases without repeatedly interpreting the underlying report structure.
From Release to Market Signal
An algorithmic workflow may process the report in several stages:
Receive the structured HAAWKS data.
Validate the commodity, product type, and marketing year.
Compare the reported figure with the expected value.
Calculate the size and direction of the surprise.
Compare the result with prior weeks and historical ranges.
Apply commodity-specific signal thresholds.
Check liquidity, market conditions, and risk limits.
Generate an alert, analytical output, or trading instruction.
Not every statistical surprise creates a meaningful price move.
A large soybean sales figure, for example, may have limited impact if it was widely expected or if it reflects a previously announced transaction. Conversely, an unexpected cancellation or net reduction may matter even when the absolute weekly figure appears relatively small.
The HAAWKS dataset provides the structured inputs needed for users to make those distinctions within their own models and strategies.
More Than a Headline Figure
The detailed structure of the Weekly Export Sales Report helps users look beyond aggregate demand.
Important questions include:
Which commodity or product class was sold?
Does the sale apply to the current or next marketing year?
Were previous commitments cancelled or reduced?
Which destinations were involved?
Are sales concentrated among one or several buyers?
How does the result compare with the pace needed to meet USDA projections?
Are reported commitments translating into physical exports?
Is one commodity class performing differently from another?
For wheat, cotton, rice, and soybeans, product-level differences can be particularly important. Strong demand for one class or type does not necessarily imply equally strong demand for the broader commodity category.
Expanding HAAWKS Agricultural Coverage
The addition of USDA Weekly Export Sales data strengthens HAAWKS’ coverage of both the demand and supply sides of agricultural markets.
USDA Crop Progress data provides insight into planting, crop development, condition, and harvest activity.
USDA Export Sales data provides insight into international demand, cancellations, and forward purchasing commitments.
Together, the datasets help users monitor how U.S. production conditions interact with global demand throughout the agricultural cycle.
By delivering official USDA information in a clean, structured, and machine-readable format, HAAWKS helps traders and analysts move more efficiently from report publication to systematic market analysis.
For algorithmic participants, that means receiving structured data while the directly relevant futures markets are still trading.
Sources
-
USDA Foreign Agricultural Service — Export Sales Reporting Program
Official information about the reporting program and the Thursday 8:30 AM ET release schedule.
https://www.fas.usda.gov/programs/export-sales-reporting-program -
USDA Foreign Agricultural Service — Weekly Export Sales
Official weekly reports and downloadable export-sales data.
https://apps.fas.usda.gov/esrqs/#/reports -
CME Group — Corn Futures
Contract information and trading hours for CBOT corn futures.
https://www.cmegroup.com/markets/agriculture/grains/corn.html -
CME Group — Soybean Futures
Contract information and trading hours for CBOT soybean futures.
https://www.cmegroup.com/markets/agriculture/oilseeds/soybean.html -
CME Group — Chicago Wheat Futures
Contract information and trading hours for CBOT wheat futures.
https://www.cmegroup.com/markets/agriculture/grains/wheat.html -
CME Group — KC Hard Red Winter Wheat Futures
Contract information for KC HRW wheat futures.
https://www.cmegroup.com/markets/agriculture/grains/kc-wheat.html -
CME Group — Rough Rice Futures
Contract information and trading hours for rough rice futures.
https://www.cmegroup.com/markets/agriculture/grains/rough-rice.html -
ICE — Cotton No. 2 Futures
Official contract specifications and trading hours.
https://www.ice.com/products/254/Cotton-No-2-Futures
Disclaimer: This blog post is for informational purposes only and should not be construed as financial advice. Always conduct thorough research and consider seeking advice from a financial professional before making any investment decisions.