
According to our analysis natural gas moved 39 ticks on DOE Natural Gas Storage Report (WNGSR) data on 16 July 2026.
Natural gas (39 ticks)
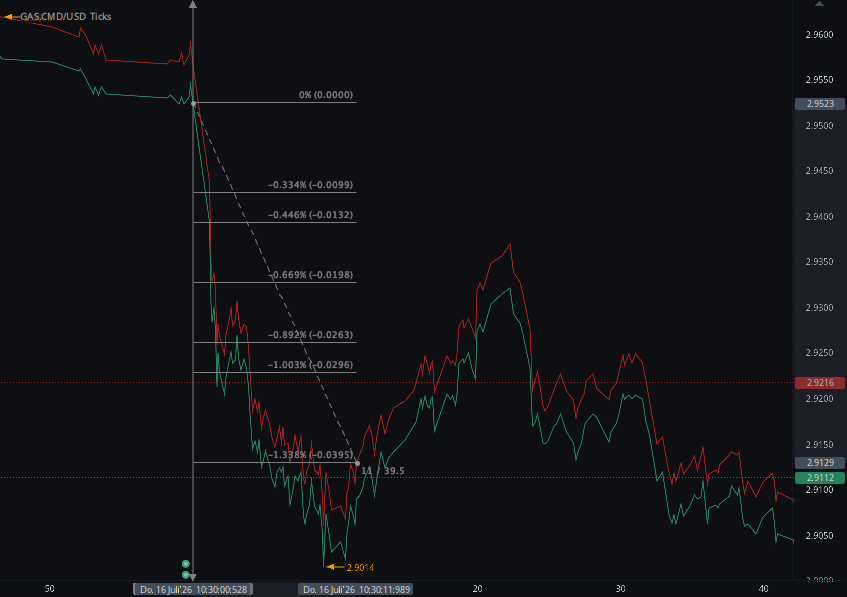
Charts are exported from JForex (Dukascopy).
Natural Gas Storage Build Triggers a 39-Tick Selloff in 11 Seconds
U.S. natural gas futures reacted sharply after the EIA reported a 41 Bcf storage injection, with the market looking beyond the slightly smaller-than-expected build to focus on abundant inventories and strong domestic production.
The U.S. Energy Information Administration reported that working natural gas inventories increased by 41 billion cubic feet during the week ending July 10, bringing total Lower 48 storage to 3,024 Bcf.
The build was slightly smaller than the Reuters analyst consensus of 43 Bcf and below the five-year average injection of 45 Bcf. Despite the modestly tighter weekly flow, natural gas sold off immediately after the release.
Storage Report at a Glance
| Storage Indicator | Reported | Comparison | HAAWKS Read-through |
|---|---|---|---|
| Weekly Net Change | +41 Bcf | Reuters forecast: +43 Bcf | The injection was 2 Bcf below consensus, representing a slightly tighter weekly result than expected. |
| Five-Year Average Injection | +45 Bcf | Actual was 4 Bcf smaller | The weekly flow was below normal, but the total inventory surplus remained substantial. |
| Total Working Gas | 3,024 Bcf | 3,045 Bcf one year ago | Inventories were 21 Bcf, or 0.7%, below the comparable year-earlier level. |
| Five-Year Average Stocks | 2,843 Bcf | Current stocks: +181 Bcf | The 6.4% storage surplus continued to provide a bearish buffer against weather-driven demand. |
Immediate Market Reaction
Natural Gas Fell 39 Ticks in 11 Seconds
The HAAWKS tick chart recorded an immediate 39-tick decline in natural gas within the first 11 seconds following the 10:30 a.m. ET storage release. The speed of the move showed that the market interpreted the broader storage and supply backdrop as bearish, despite the injection coming in slightly below expectations.
| Market | Measured Move | Time Window | Initial Direction | Interpretation |
|---|---|---|---|---|
| Natural Gas | 39 ticks | 11 seconds | Lower | Immediate selling indicated that surplus inventories and broader supply conditions outweighed the slightly smaller weekly build. |
Regional Storage Breakdown
The Midwest recorded the largest regional injection at 20 Bcf, followed by the East with 14 Bcf. The South Central region added only 3 Bcf as a 5 Bcf withdrawal from salt facilities partially offset an 8 Bcf injection into nonsalt storage.
| Region | Working Gas | Weekly Change | vs. Last Year | vs. Five-Year Average |
|---|---|---|---|---|
| East | 614 Bcf | +14 Bcf | −1.9% | +1.7% |
| Midwest | 749 Bcf | +20 Bcf | +3.0% | +6.2% |
| Mountain | 240 Bcf | +4 Bcf | +2.6% | +21.2% |
| Pacific | 319 Bcf | 0 Bcf | +8.5% | +21.8% |
| South Central | 1,103 Bcf | +3 Bcf | −5.2% | +2.7% |
| Total Lower 48 | 3,024 Bcf | +41 Bcf | −0.7% | +6.4% |
Why Did Natural Gas Fall?
The Storage Surplus Remained Large
Although the weekly injection was slightly smaller than expected, inventories remained 181 Bcf above the five-year average. That surplus continued to limit concerns about supply availability during the summer cooling season.
Production Remained Strong
Lower 48 natural gas production averaged approximately 110.3 Bcf per day during July. Strong output gave the market confidence that storage could remain adequately supplied even as electricity demand increased.
LNG Feedgas Flows Were Below Their Peak
Feedgas flows to major U.S. LNG export terminals averaged around 17.4 Bcf per day during July, below the record level reached in April. Reduced export demand left more domestic supply available to the U.S. market.
HAAWKS view: The 41 Bcf injection was nominally supportive because it came in below both consensus and the five-year average. However, the 39-tick selloff showed that traders placed greater weight on the continuing inventory surplus, high production and subdued LNG demand.
What Traders Should Watch Next
Weather remains the most important near-term variable. Sustained heat across the Midwest and East could increase power-sector gas consumption and produce a smaller injection in the next storage report.
Traders should also monitor Lower 48 production, LNG terminal activity and the pace at which the five-year storage surplus narrows. A series of tighter injections would be more important than a single below-average build.
The next EIA Weekly Natural Gas Storage Report is scheduled for July 23, 2026, at 10:30 a.m. ET.
HAAWKS Conclusion
The July 16 natural gas storage report delivered a slightly tighter result than expected. The 41 Bcf injection was below the 43 Bcf Reuters consensus and the 45 Bcf five-year average build.
The immediate market response was nevertheless decisively bearish. Natural gas dropped 39 ticks in only 11 seconds, demonstrating that the market remained more concerned with abundant total inventories than with the modest weekly miss.
Total working gas stood at 3,024 Bcf—21 Bcf below the prior-year level but still 181 Bcf above the five-year average. This left the market adequately supplied and reduced the urgency to price a near-term shortage.
The key message is that the headline injection cannot be viewed in isolation. Storage levels, production, weather, electricity demand and LNG exports collectively determine whether a report is genuinely bullish or bearish.
Trade smart. Stay informed. Stay ahead.
Sources
-
U.S. Energy Information Administration — Weekly Natural Gas
Storage Report
Official source for the 41 Bcf injection, total Lower 48 inventories, regional storage changes and comparisons with last year and the five-year average. -
Reuters — U.S. natural gas prices slide on rising production and
ample storage
Used for the 43 Bcf analyst consensus, five-year average injection, production, LNG flows and broader futures-market context. -
HAAWKS internal natural gas tick-chart analysis — July 16, 2026
Used for the measured release-window market reaction of 39 ticks lower in 11 seconds.
Haawks G4A low latency machine-readable data is one of the fastest data feeds for DOE data.
Please let us know your feedback. If you are interested in timestamps, please send us an email to sales@haawks.com.