We are pleased to announce that there was a potential of 399 pips/ticks and US500 4 points (16 ticks) profit out of the following 10 events in the second quarter of 2026 based on our ex-post analysis. The potential performance for 2025 was 1,828 pips/ticks.
Q2 2026
DOE Petroleum Status Report (WPSR) (51 ticks / 15 April 2026)
DOE Natural Gas Storage Report (WNGSR) (19 ticks / 23 April 2026)
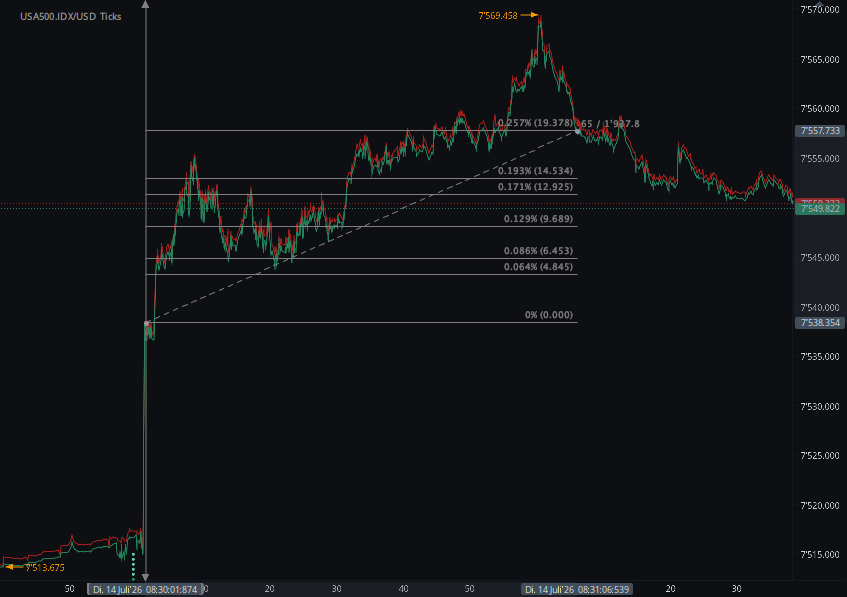
University Michigan Consumer Sentiment / Inflation Expectations (US500 4 points / 24 April 2026)
DOE Petroleum Status Report (WPSR) (49 ticks / 29 April 2026)
DOE Natural Gas Storage Report (WNGSR) (18 ticks / 30 April 2026)
DOE Petroleum Status Report (WPSR) (57 ticks / 6 May 2026)
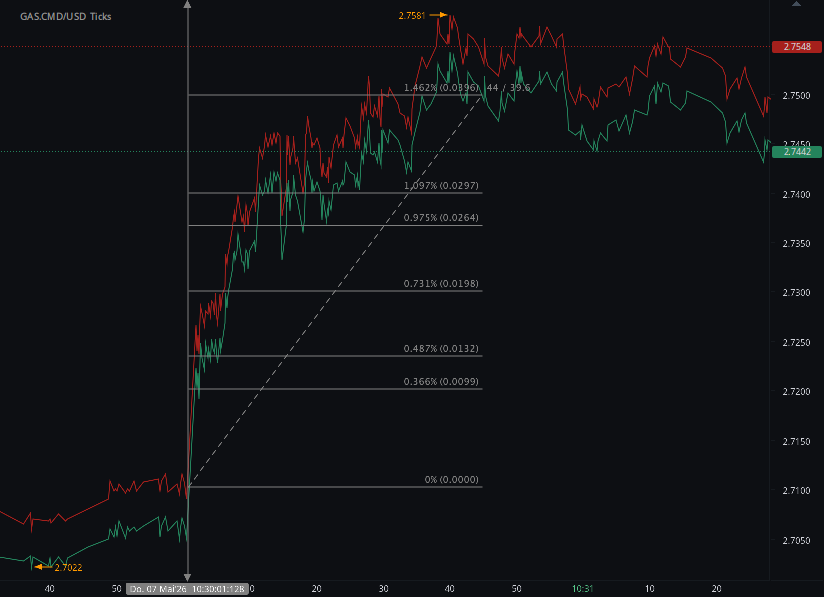
DOE Natural Gas Storage Report (WNGSR) (39 ticks / 7 May 2026)
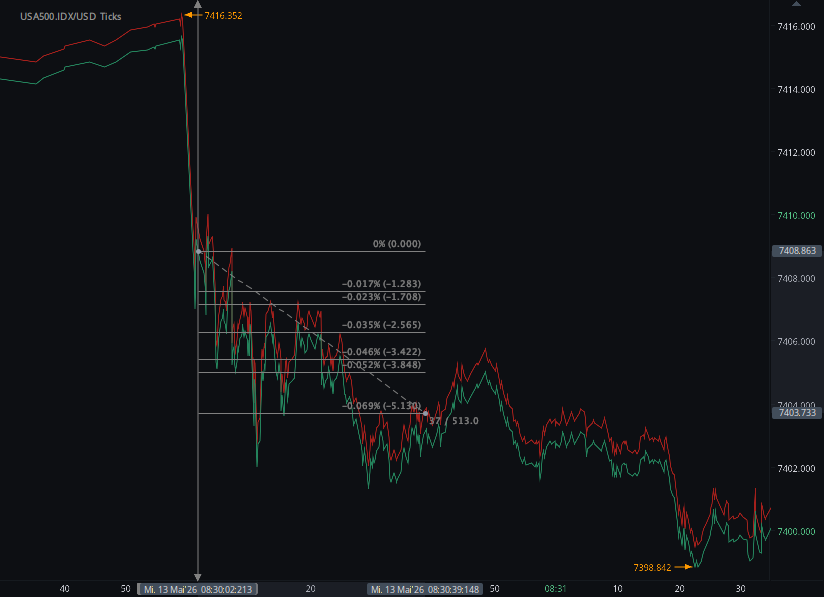
US BLS Producer Price Index (PPI) (20 ticks / 13 May 2026)
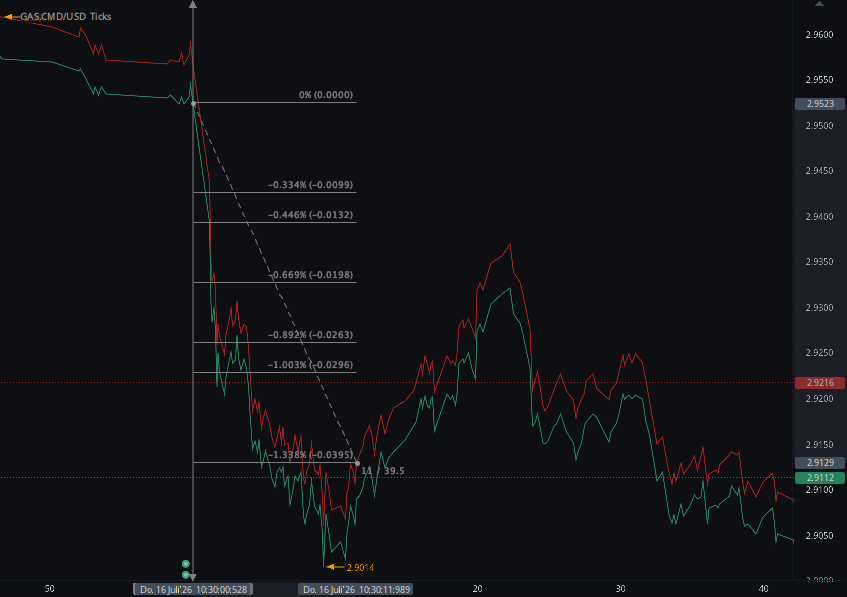
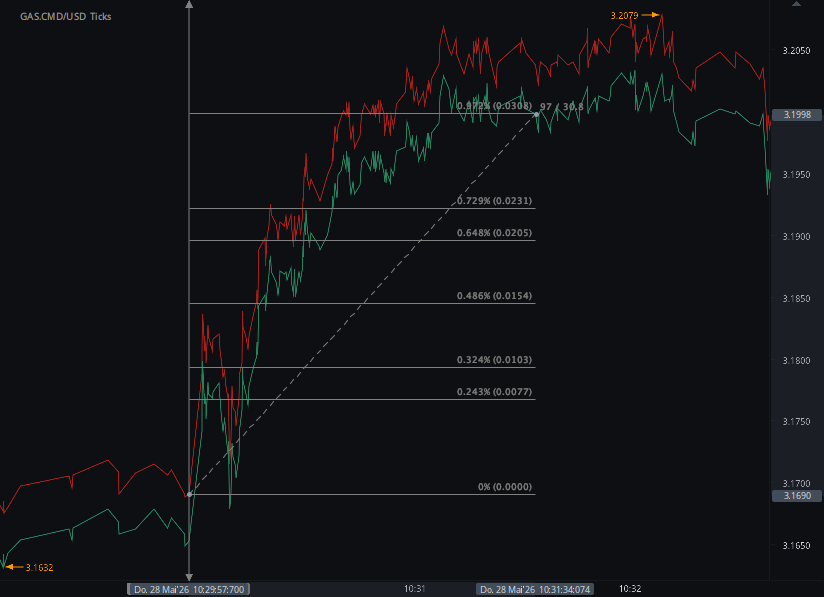
DOE Natural Gas Storage Report (WNGSR) (30 ticks / 28 May 2026)
USDA Grain Stocks and USDA Acreage (116 ticks / 30 June 2026)
Total trading time would have been around 12 minutes in 3 months! (preparation time not included)
You can click on each release for detailed information.
April–June 2026 News Trading Wrap-Up: 399 Ticks and US500 4 Points Across 10 Releases
DOE/EIA energy reports, U.S. inflation and consumer data, and USDA agricultural releases produced a series of rapid market reactions across crude oil, natural gas, US500 and grain futures.
The second quarter of 2026 demonstrated how structured economic and commodity data can generate sharp market moves in very short trading windows.
Across 10 selected HAAWKS-covered releases between April 15 and June 30, the measured market reactions produced an indicative cumulative total of 399 ticks, together with a separate 4-point move in the US500.
The releases covered several distinct market drivers: weekly petroleum inventories, natural gas storage, producer inflation, consumer sentiment and inflation expectations, and USDA acreage and grain inventory data.
Performance at a Glance
Monthly Breakdown
Petroleum, natural gas and consumer sentiment releases drove the month’s measured opportunities.
DOE/EIA energy data remained active, while the PPI release added an equity-index futures opportunity.
USDA Grain Stocks and Acreage data generated the largest combined move in the selected period.
| Month | Number of Releases | Measured Movement | Main Release Categories |
|---|---|---|---|
| April 2026 | 5 | 137 ticks + US500 4 points | Petroleum, natural gas and consumer sentiment |
| May 2026 | 4 | 146 ticks | Petroleum, natural gas and Producer Price Index |
| June 2026 | 1 | 116 ticks | USDA Grain Stocks and Acreage |
| Total | 10 | 399 ticks + US500 4 points | Energy, macroeconomic and agricultural data |
All Selected Releases
| Date | News Release | Primary Market | Measured Move |
|---|---|---|---|
| April 15, 2026 | DOE/EIA Weekly Petroleum Status Report | Crude oil futures | 51 ticks |
| April 23, 2026 | DOE/EIA Weekly Natural Gas Storage Report | Natural gas futures | 19 ticks |
| April 24, 2026 | University of Michigan Consumer Sentiment and Inflation Expectations | US500 | 4 points |
| April 29, 2026 | DOE/EIA Weekly Petroleum Status Report | Crude oil futures | 49 ticks |
| April 30, 2026 | DOE/EIA Weekly Natural Gas Storage Report | Natural gas futures | 18 ticks |
| May 6, 2026 | DOE/EIA Weekly Petroleum Status Report | Crude oil futures | 57 ticks |
| May 7, 2026 | DOE/EIA Weekly Natural Gas Storage Report | Natural gas futures | 39 ticks |
| May 13, 2026 | U.S. Bureau of Labor Statistics Producer Price Index | US500 futures | 20 ticks |
| May 28, 2026 | DOE/EIA Weekly Natural Gas Storage Report | Natural gas futures | 30 ticks |
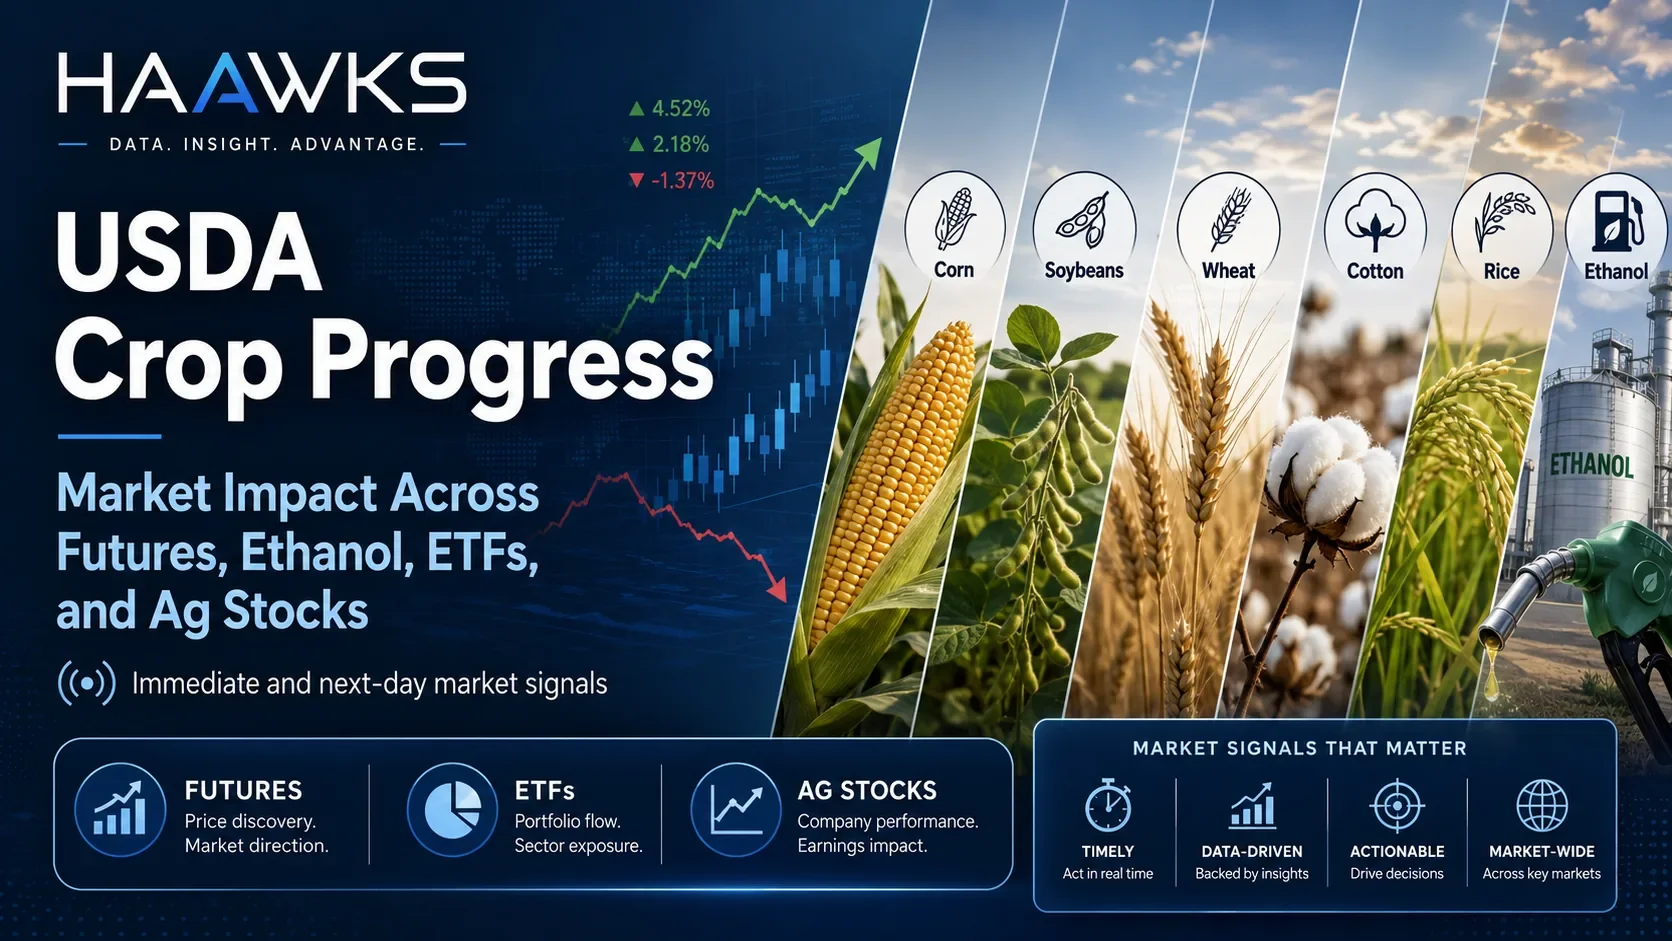
| June 30, 2026 | USDA Grain Stocks and USDA Acreage | Corn, wheat and soybean futures | 116 ticks total |
Which Releases Generated the Most Movement?
| Release Category | Number of Events | Cumulative Move | HAAWKS Read-through |
|---|---|---|---|
| Petroleum Status Report | 3 | 157 ticks | Crude oil inventory data produced the highest cumulative total among the recurring report categories. |
| Natural Gas Storage Report | 4 | 106 ticks | Natural gas provided the highest frequency of selected opportunities during the period. |
| USDA Grain Stocks and Acreage | 1 | 116 ticks | The combined corn, wheat and soybean reaction was the largest single selected event. |
| Producer Price Index | 1 | 20 ticks | Producer inflation generated a fast reaction in US500 futures. |
| Michigan Consumer Data | 1 | US500 4 points | Sentiment and inflation expectations produced a smaller but measurable equity-index reaction. |
What the Results Show
Energy Data Remained the Core Driver
DOE/EIA petroleum and natural gas reports accounted for seven of the 10 selected events and 263 of the 399 cumulative ticks. Energy reports therefore represented approximately two-thirds of the measured tick total.
Recurring Reports Created Repeat Opportunities
Petroleum and natural gas reports did not produce only one isolated reaction. Their weekly publication schedules generated multiple market-moving events during April and May.
Macroeconomic Data Still Mattered
The Producer Price Index and Michigan consumer data showed that equity-index futures remained sensitive to inflation, sentiment and changes in the interest-rate outlook.
Agricultural Data Produced the Largest Event
USDA Grain Stocks and Acreage reports produced 116 combined ticks across corn, wheat and soybeans, demonstrating the importance of machine-readable agricultural data during major seasonal releases.
HAAWKS view: The period showed that market-moving opportunities were not concentrated in one asset class. Energy reports offered frequency, macroeconomic data affected equity-index futures, and the USDA reports produced the largest combined reaction. The common factor was speed: structured information was rapidly incorporated into futures prices.
Why Low-Latency Data Matters
Scheduled economic releases can move futures markets within seconds. During these periods, the ability to receive structured data quickly can be as important as understanding the underlying economic result.
Machine-readable data allows trading systems and professional users to process individual data fields without waiting for a complete report to be read manually. This is particularly relevant for reports containing numerous related figures, including petroleum inventories, regional natural gas storage, inflation components and agricultural supply data.
Speed alone does not remove execution risk. Spreads may widen, available liquidity may decline and slippage may increase around major releases. Traders still require disciplined risk limits, reliable infrastructure and a clear understanding of the contracts being traded.
HAAWKS Conclusion
The selected April–June 2026 releases produced a diverse set of futures news trading opportunities across energy, equity indices and agricultural markets.
The three DOE/EIA Petroleum Status Reports generated 157 ticks, while four Natural Gas Storage Reports generated 106 ticks. The Producer Price Index added 20 ticks in US500 futures, and Michigan consumer data produced a separate 4-point US500 move.
The largest single selected event came on June 30, when USDA Grain Stocks and Acreage data generated a combined 116 ticks across corn, wheat and soybean futures.
Together, the selected releases represented 399 ticks of indicative market movement, plus US500 4 points. The results reinforce the importance of fast data delivery, contract-specific analysis and disciplined execution around scheduled economic news.
Trade smart. Stay informed. Stay ahead.
Explore HAAWKS Machine-Readable Data
HAAWKS G4A provides low-latency machine-readable macroeconomic and commodity data for professional users covering U.S. economic releases, DOE/EIA energy reports and USDA agricultural data.
Explore HAAWKS G4A Data FeedsSources
-
HAAWKS — April 2026 monthly news trading analysis
Source for the five selected April releases, 137 cumulative ticks and the separate US500 4-point move. -
HAAWKS — May 2026 monthly news trading analysis
Source for the four selected May releases and 146 cumulative ticks. -
HAAWKS — USDA Grain Stocks and Acreage analysis,
June 30, 2026
Source for the combined 116-tick reaction in corn, wheat and soybean futures. -
U.S. Energy Information Administration — Weekly Petroleum
Status Report
Official source for weekly U.S. petroleum inventory and supply data. -
U.S. Energy Information Administration — Weekly Natural Gas
Storage Report
Official source for weekly U.S. underground natural gas storage data. -
University of Michigan — Surveys of Consumers
Official source for consumer sentiment and inflation-expectation data. -
U.S. Bureau of Labor Statistics — Producer Price Index
Official source for U.S. producer inflation data. -
USDA National Agricultural Statistics Service — Current Reports
Official source for USDA Grain Stocks and Acreage reports.
Haawks G4A low latency machine-readable data offers one of the fastest machine-readable data feeds for US macro-economic and commodity data and macro-economic data from Norway, Sweden, Switzerland Turkey and ECB interest rates and statement.
Please let us know your feedback and check out our G4A low latency data feed.
All data is machine readable and available via API access in Chicago, New York and London. Free trials for qualified professionals.