
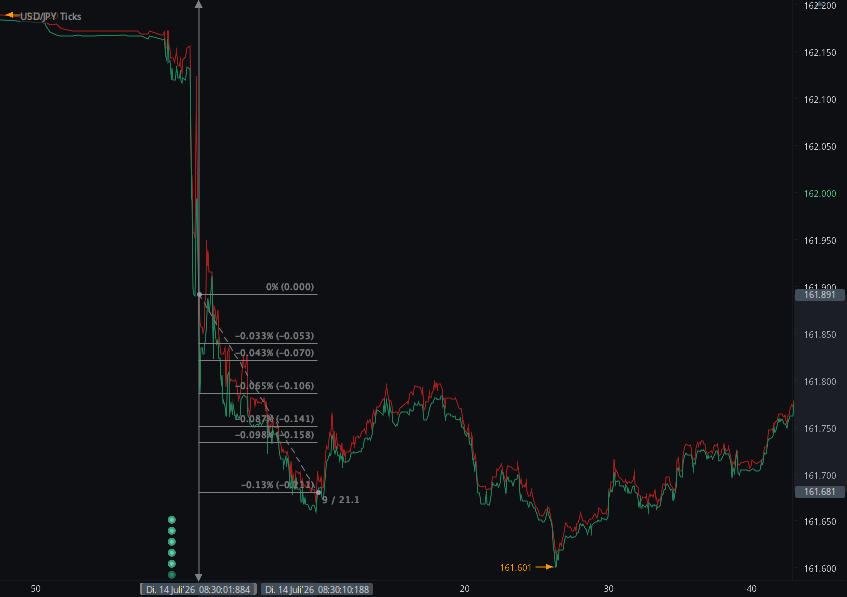
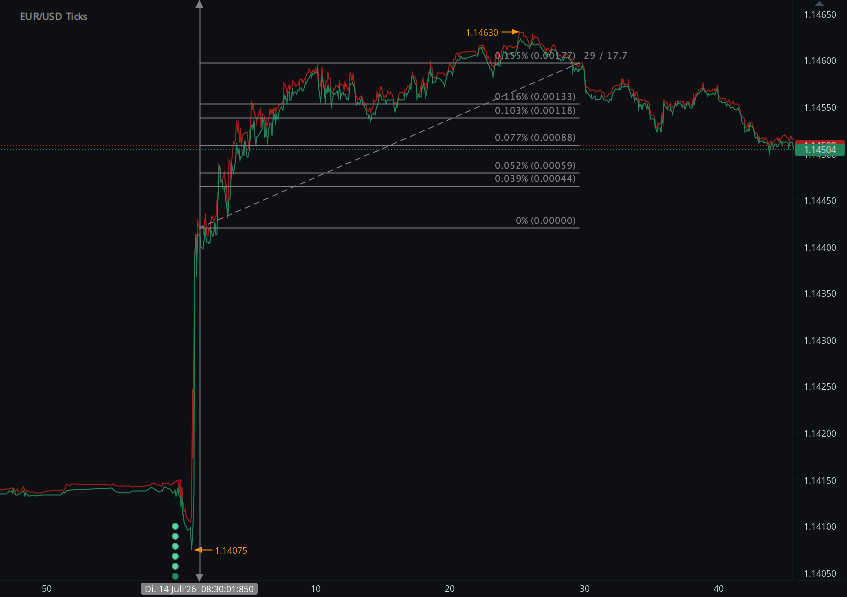
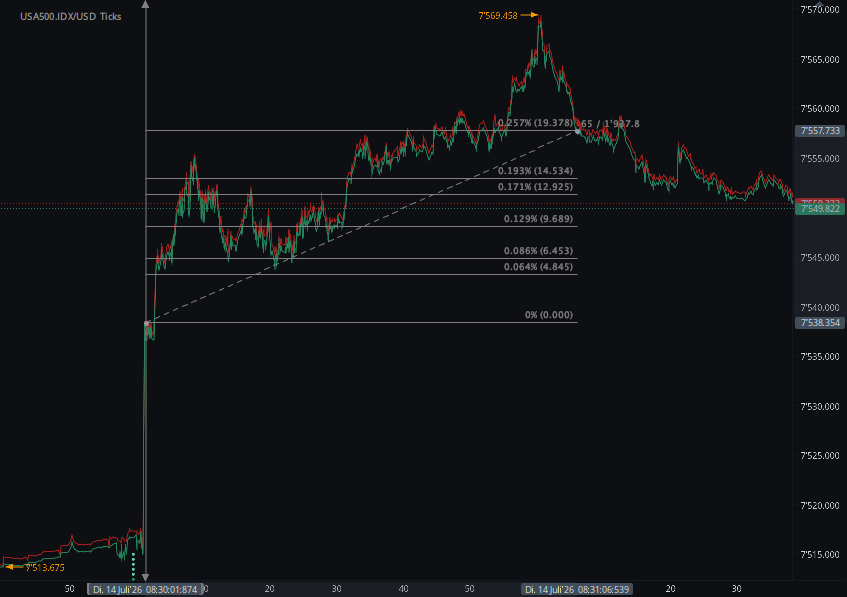
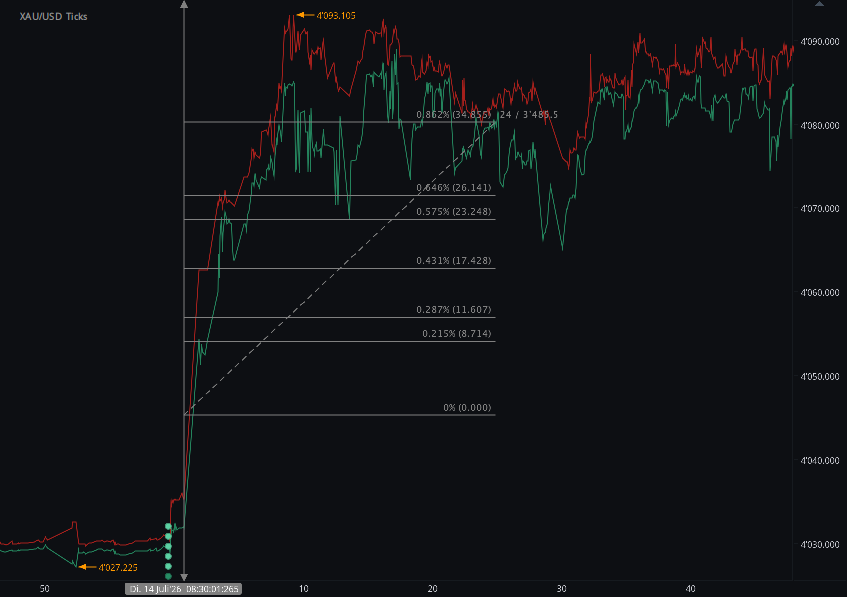
According to our analysis USDJPY moved 21 pips, EURUSD moved 17 pips, US500 moved 76 ticks and XAUUSD 34 points on US BLS Consumer Price Index (CPI) data on 14 July 2026.
USDJPY (21 pips)
EURUSD (17 pips)
US500 (76 ticks)
XAUUSD (34 points)
Charts are exported from JForex (Dukascopy).
June 2026 CPI: Inflation Cools Faster Than Expected
A sharp decline in energy prices and an unexpectedly soft core reading triggered immediate moves across currencies, gold and U.S. equities.
The June 2026 U.S. Consumer Price Index delivered a clear downside inflation surprise. Headline CPI declined 0.4% month over month, while annual inflation slowed to 3.5%. Core CPI, which excludes food and energy, was unchanged during the month and slowed to 2.6% year over year.
The report was softer than economists had expected at both the headline and core levels. Markets responded by selling the U.S. dollar and moving into rate-sensitive assets, including gold and U.S. equities.
CPI Estimates vs. Actual Release
| Inflation Indicator | Estimate | Actual | HAAWKS Read-through |
|---|---|---|---|
| Headline CPI MoM | −0.1% | −0.4% | A materially softer monthly reading, driven primarily by lower energy prices. |
| Headline CPI YoY | 3.8% | 3.5% | Annual inflation slowed more quickly than markets expected. |
| Core CPI MoM | +0.2% | 0.0% | The unchanged core index was an important downside surprise. |
| Core CPI YoY | 2.8% | 2.6% | Underlying annual inflation continued moving toward a more moderate pace. |
What Drove the Inflation Decline?
Energy was the largest contributor to the monthly decline. The energy index fell 5.7%, while gasoline prices dropped 9.7%. Those declines more than offset increases in food and shelter.
Food prices increased 0.2% during June, while shelter rose only 0.1%—its smallest monthly increase since January 2021. Motor vehicle insurance, communication, apparel, medical care and used vehicle prices also declined.
| CPI Component | Monthly Change | Annual Change | Interpretation |
|---|---|---|---|
| All Items | −0.4% | +3.5% | The largest monthly headline decline since April 2020. |
| Core CPI | 0.0% | +2.6% | Underlying price pressures were unchanged during the month. |
| Energy | −5.7% | +15.7% | The largest contributor to the monthly CPI decline. |
| Gasoline | −9.7% | +26.7% | A sharp monthly reversal, although prices remained elevated compared with a year earlier. |
| Shelter | +0.1% | +3.3% | The smallest monthly shelter increase since January 2021. |
| Food | +0.2% | +3.0% | Food inflation remained positive but relatively contained. |
Market Impact at a Glance
HAAWKS tick charts captured the initial release-window moves immediately following the 8:30 a.m. ET CPI announcement.
| Market | Measured Move | Initial Direction | HAAWKS Interpretation |
|---|---|---|---|
| USD/JPY | 21 pips | Lower | The dollar weakened against the yen as traders reduced the probability of near-term Federal Reserve tightening. |
| EUR/USD | 17 pips | Higher | The euro advanced as the softer inflation reading pressured the broader U.S. dollar. |
| US500 | 76 ticks | Higher | Equities rallied as the inflation surprise reduced immediate concerns about restrictive monetary policy. |
| XAU/USD | 34 points | Higher | Gold benefited from a weaker dollar and lower expectations for near-term interest-rate increases. |
Cross-Asset Market Reading
Foreign Exchange
The immediate FX response was a weaker U.S. dollar. USD/JPY moved lower, while EUR/USD moved higher. This was consistent with markets reducing expectations that the Federal Reserve would need to tighten policy in the immediate future.
Gold
Gold produced one of the strongest reactions. Softer inflation generally supports non-yielding assets when it lowers Treasury yields and weakens the dollar. The HAAWKS measurement recorded a 34-point release-window advance.
U.S. Equities
The US500 initially gained 76 ticks. The market interpreted the report as supportive for valuations because inflation cooled without the release itself presenting a direct signal of collapsing economic demand.
HAAWKS view: The release created a broadly dovish cross-asset response—USD lower, gold higher and equities higher. The core CPI miss strengthened the move because the moderation was not limited entirely to volatile energy prices.
What the CPI Report Means for the Fed
The June figures gave policymakers additional breathing room. Headline inflation remained above the Federal Reserve’s longer-term objective, but both headline and core CPI came in below expectations.
The report does not eliminate future inflation risk. Much of the headline decline reflected lower gasoline and energy prices, which can reverse quickly. Renewed pressure on oil markets could therefore make upcoming inflation reports less favorable.
For traders, the key question is whether the softer core readings continue. A sustained moderation in shelter and services inflation would provide a stronger signal than a single energy-driven monthly decline.
HAAWKS Conclusion
The June CPI release was decisively softer than expected. Headline prices fell 0.4%, core prices were unchanged and both annual measures undershot consensus forecasts.
Markets reacted in a clear and coordinated manner: the dollar weakened, gold advanced and the US500 rallied. The HAAWKS measurements recorded 21 pips in USD/JPY, 17 pips in EUR/USD, 76 ticks in the US500 and 34 points in XAU/USD.
The report offered short-term relief from inflation concerns, but it should not be viewed as an all-clear signal. Energy volatility remains a material risk, and annual headline inflation was still elevated.
The central message is therefore one of moderation rather than victory: inflation cooled faster than expected, underlying pressure eased and markets rapidly repriced the near-term policy outlook.
Trade smart. Stay informed. Stay ahead.
Sources
- U.S. Bureau of Labor Statistics — Consumer Price Index, June 2026 . Official CPI figures, component data and release details.
-
Reuters — U.S. consumer inflation preview and economist consensus
Used for the pre-release market estimates for headline and core consumer inflation. -
Reuters — Traders reduce expectations for a July Fed rate increase
Used for market-implied Federal Reserve policy expectations following the report. - HAAWKS internal tick-chart screenshots captured on July 14, 2026. Used for the measured release-window moves in USD/JPY, EUR/USD, US500 and XAU/USD.
Start futures forex fx news trading with Haawks G4A low latency machine-readable data, one of the fastest machine-readable news trading feed for US macro-economic and commodity data.
Please let us know your feedback. If you are interested in timestamps, please send us an email to sales@haawks.com.