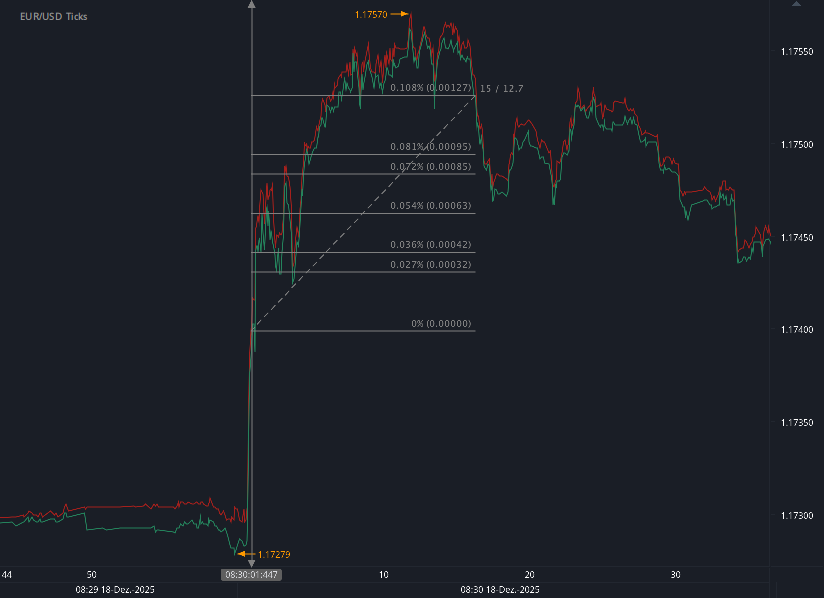
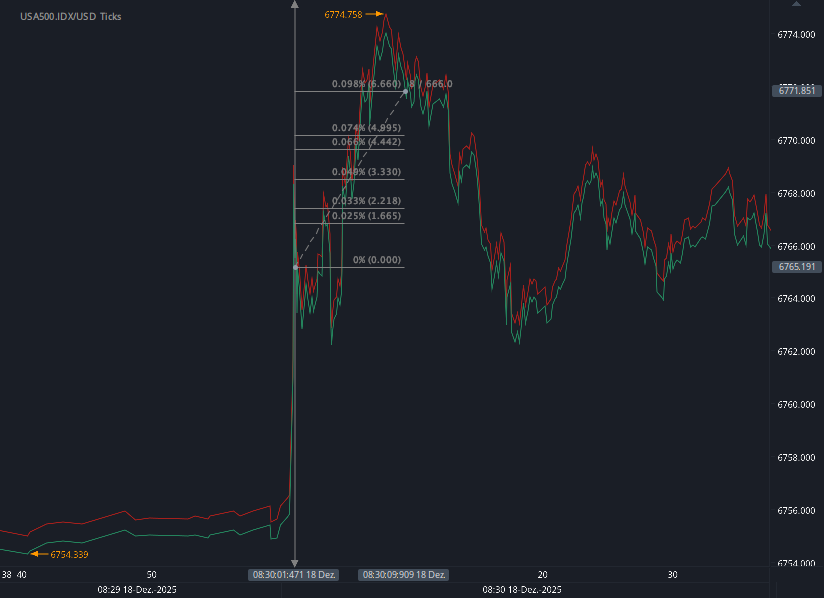
According to our analysis EURUSD moved 12 pips and US500 moved 6 points and BTC 678 points on US CPI and US Jobless Claims data on 18 December 2025.
EURUSD (12 points)
US500 (6 points)
BTC (678 points)
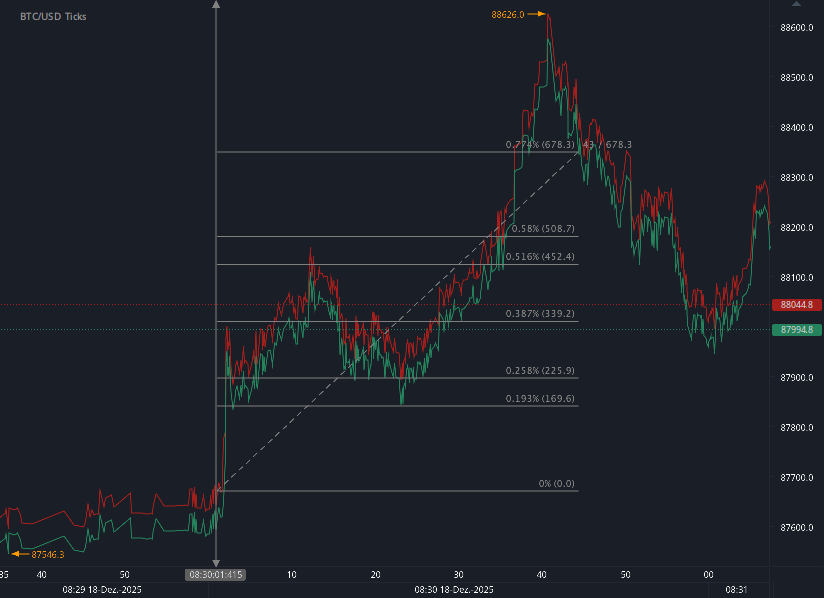
Charts are exported from JForex (Dukascopy).
Unemployment Claims, CPI, and the Macro Signal Going into 2026
A more technical read on the December 18, 2025 UI & CPI releases
The December 18, 2025 data dump gives us a fairly coherent macro picture:
Labor market: still tight by historical standards, with some sectoral and regional softening but no broad deterioration.
Inflation: headline and core running in the high-2% range, drifting down from 3%, with housing and services still doing most of the work on the “sticky” side.
Below is a more policy-wonk breakdown of what these releases are actually saying.
1. Labor Market: Claims Still at “Expansion” Levels
1.1 Initial claims: well within “normal” range
Initial claims (SA), week ending Dec 13:
224k (-13k w/w from a revised 237k).
4-week moving average: 217.5k (+0.5k).
In a labor force north of 165–170 million, claims in the low 200k range are typically associated with continuing expansion, not recession onset. This is consistent with past cycles where recessionary conditions usually show up with claims closer to 300k+ and/or a persistently rising 4-week average.
The November 29 print at 192k now looks like a bit of an outlier to the low side, and the December 6 spike to 237k looks like noise rather than the start of a trend.
1.2 Continued claims and IUR: mild firming, but no spike
Insured unemployment (SA), week ending Dec 6:
1.897 million (+67k w/w from a revised 1.83 million).
Insured unemployment rate (IUR): 1.2% (unchanged).
4-week average: 1.902 million (-14k).
Insured unemployment is oscillating in a pretty narrow band: 1.83–1.95 million over much of 2025. The fact that the IUR is flat at 1.2% while levels move around is a reminder that this is mostly noise around a tight steady state, not a structural shift.
You also see divergence between SA and NSA:
NSA insured unemployment: 1.88 million (week of Dec 6), down 75k w/w, rate down from 1.3% to 1.2%.
Seasonal factors had expected a larger decline, so relative to expectations, the labor market is slightly weaker than the NSA drop alone suggests—but not dramatically.
1.3 State-level patterns: sectoral and regional pockets
Highest insured unemployment rates (week ending Nov 29):
Washington 2.5%, New Jersey 2.4%, California 2.3%, Minnesota 2.2%, Massachusetts 2.1%, and Puerto Rico / Rhode Island 2.0%, with Alaska, Oregon 1.9% and Nevada, New York 1.8% close behind.
This is a familiar pattern: elevated IUR in states with:
Higher exposure to tech / services / high-wage sectors (CA, WA, MA).
Historically higher baseline UI recipiency rates and more generous programs (NJ, RI).
Structural or cyclical sectoral exposure (e.g., construction and logistics on the West Coast).
For the week ending Dec 6, the largest NSA increases in initial claims were:
CA +14,258
IL +11,074
NY +10,346
TX +8,206
GA +6,333
State comments attribute this largely to layoffs in construction, manufacturing, transportation/warehousing, and admin/support/waste management plus some health care and accommodation/food services.
Policy-relevant point: These look like sectoral adjustments, not broad-based, demand-driven layoffs. Construction and manufacturing are classic late-cycle cyclicals; seeing choppiness here doesn’t, on its own, scream “recession.”
1.4 Federal programs and total UI usage
On a not-seasonally adjusted basis:
Total continued weeks claimed in all programs, week ending Nov 29:
1,993,823 (up 262,500 w/w; versus 1,960,319 a year earlier).
Extended Benefits (EB) is basically inactive:
Only 9 continued weeks claimed, and no state is triggered “on” EB.
STC/workshare: ~22.7k continued weeks, slightly below the prior year’s 23.2k.
From a macro/financial-stability lens, the fact that EB is not triggered anywhere is a strong indicator that labor market weakness is not yet systemic.
2. Inflation: A Controlled Downshift toward 2–3%
2.1 Headline vs. core
For November 2025 (12-month changes):
All items CPI-U: +2.7% (down from +3.0% for 12 months ending September).
Core CPI (all items less food and energy): +2.6%.
From September to November (2-month SA changes, because October is missing):
Headline CPI: +0.2% total over 2 months.
Core CPI: +0.2% over the same period.
Shelter: +0.2% over 2 months.
Energy: +1.1%, food: +0.1% (both over 2 months).
If you roughly annualize that 2-month +0.2% move, you’re getting something in the ballpark of 1–2% annualized, i.e., softer than the 12-month headline figure. You don’t want to over-interpret two months (especially with a measurement gap), but the direction is clearly disinflationary.
2.2 Shutdown-related measurement caveat
BLS did not collect survey data for October 2025 due to a lapse in appropriations, and could only retroactively acquire most non-survey data.
Implications:
Standard month-over-month time-series analysis is noisier than usual.
The 2-month percent changes (September–November) are a workaround, not a model change.
12-month figures (e.g., +2.7% headline, +2.6% core) still serve as the main anchor for trend inflation.
For policy analysis, you basically discount very fine-grained inferences about October but still treat the broader trajectory as valid.
2.3 Decomposing headline inflation
Food (12-month changes):
Food overall: +2.6%
Food at home: +1.9%
Meats/poultry/fish/eggs: +4.7%
Nonalcoholic beverages: +4.3%
Cereals/bakery: +1.9%
Fruits/vegetables: +0.1%
Dairy and related products: -1.6%
Food away from home: +3.7%
Full-service meals: +4.3%
Limited service: +3.0%
Interpretation:
Grocery inflation is sub-3% and clustered mostly around protein and beverages.
Restaurant inflation remains notably hotter than food-at-home, reflecting labor and overhead costs—a classic “services stickiness” story.
Energy (12-month changes):
Energy overall: +4.2%
Gasoline: +0.9%
Fuel oil: +11.3%
Electricity: +6.9%
Utility (piped) gas: +9.1%
So energy is still a positive contributor, but the gasoline component is comparatively mild; the bigger story is household energy (utilities and fuel oil), both of which have direct cost-of-living and political salience.
Core components (12-month):
Core CPI: +2.6%
Shelter: +3.0%
Services less energy: +3.0%
Used cars and trucks: +3.6%
Household furnishings/operations: +4.6%
Medical care services: +3.3%
This is a services-heavy inflation profile with goods not doing much damage except in a handful of categories (used vehicles, furnishings). The shelter component is still running above 2%, but at levels much closer to pre-pandemic “normal high” than the 6–8% rates seen in the earlier inflation spike.
3. Policy Implications
3.1 Monetary policy: This is what “orderly disinflation” looks like
From a central bank perspective, this combination is about as close as you get to “soft landing” conditions:
Inflation has drifted down from 3.0% to 2.7%, with core at 2.6%, i.e., slightly above typical 2% targets but trending down.
Labor market is still tight: low initial claims, low insured unemployment, no EB triggers, and only modest increases in continued claims.
Key angles for policymakers:
Output gap / NAIRU context
Claims and IUR at these levels are not consistent with a large positive unemployment gap. Labor markets still appear close to or slightly above most estimates of NAIRU.
Yet, inflation is not accelerating; it’s easing, which reinforces the idea that the post-pandemic inflation burst may have been driven more by supply shocks and sectoral imbalances than by persistent overheating alone.
Wage-price dynamics
With services inflation still around 3% and restaurant prices up 3–4% YoY, underlying wage growth is likely still above 2–2.5%, but not clearly incompatible with a medium-term glide path to 2%.
The Fed will view the moderation in goods inflation and slowing shelter inflation as evidence that pass-through from earlier cost shocks is fading.
Risk balance for rate decisions
Data like this tends to lower the urgency of further tightening.
It does not yet justify aggressive easing, given that core is still above target and services/shelter remain sticky.
Translation: it’s the kind of setup that supports a “hold for longer, cut cautiously later” stance rather than “hike again” or “slash now.”
3.2 Fiscal & labor-market policy: No crisis, but some micro hot spots
From a fiscal / labor-programs lens:
No sign of a UI-driven emergency:
EB is off everywhere.
Total UI usage is up only modestly year-over-year.
Sectoral and regional shocks are present:
Concentrated in construction, manufacturing, transportation/warehousing, and some services.
These are classic cases where targeted adjustment assistance, retraining, or infrastructure/green capex could absorb displaced workers rather than broad UI expansions.
The high IUR in states like WA, CA, NJ, MA, and OR suggests watching:
Tech and high-skill services exposure.
Local housing and cost-of-living issues that interact with labor mobility.
But nothing in the data screams “we’re about to blow through automatic stabilizers and need emergency discretionary intervention.”
3.3 Distributional and political economy angles
Shelter and utilities are still rising faster than headline, which hits renters and lower-income households hardest.
Food-at-home inflation is manageable, but restaurant prices remain elevated—visible to households and politically salient.
The shutdown-driven data gaps will likely become part of the “governance risk” discussion: if recurring shutdowns degrade data quality, it complicates real-time macro management.
4. How to Read This Going Forward
If you’re thinking about these releases in a policy-wonk framework, a few takeaways:
Trend inflation: High-2% and drifting down, not stuck in a 4–5% range.
Labor market: Still tight, but with normal late-cycle churn concentrated in cyclical sectors.
Policy stance: Data-dependent central bank can credibly stay on hold, lean dovish later if this disinflation trend persists, without immediate pressure to either re-tighten or pivot hard.
Disclaimer: This blog post is for informational purposes only and should not be construed as financial advice. Always conduct thorough research and consider seeking advice from a financial professional before making any investment decisions.
Source: https://www.dol.gov/ui/data.pdf, https://www.bls.gov/news.release/cpi.nr0.htm
Please let us know your feedback. If you are interested in timestamps, please send us an email to sales@haawks.com.
Start futures forex fx news trading with Haawks G4A low latency machine-readable data today, one of the fastest news data feeds for US macro-economic and commodity data.