According to our analysis USDJPY and EURUSD moved 10 pips on US BLS Job Openings and Labor Turnover Survey (JOLTS) data on 3 June 2025.
USDJPY (6 pips)

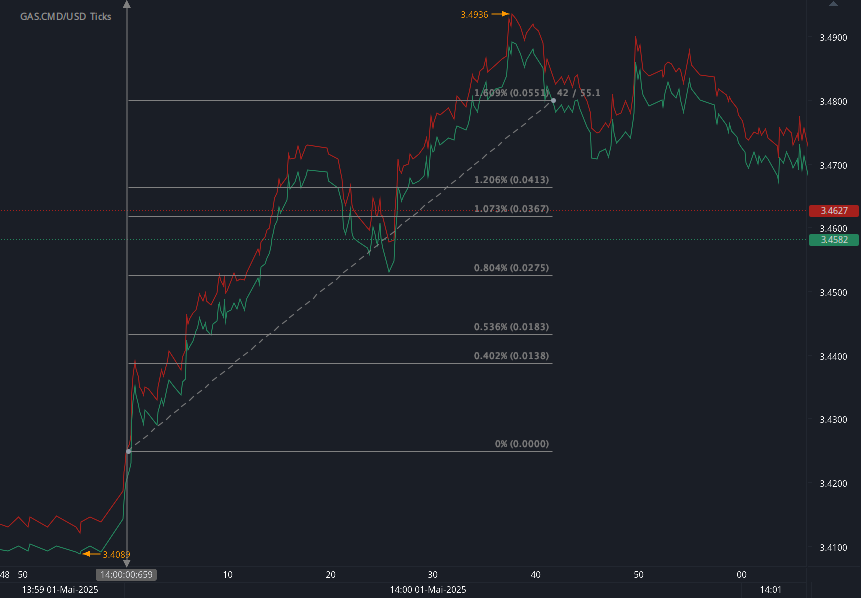
EURUSD (4 pips)

Charts are exported from JForex (Dukascopy).
U.S. Job Market Holds Steady in April 2025, Says BLS Report
The U.S. job market showed little movement in April 2025, according to the latest Job Openings and Labor Turnover Survey (JOLTS) released by the Bureau of Labor Statistics (BLS). Job openings remained steady at 7.4 million, while hires and separations also showed minimal changes, suggesting a stable yet cautiously progressing labor environment.
Key Highlights from the April 2025 JOLTS Report:
Job Openings:
The number of job openings stood at 7.4 million, with an unchanged rate of 4.4%. Notable industry shifts included:Decrease in Accommodation and Food Services (–135,000)
Decrease in State and Local Government, Education (–51,000)
Increase in Arts, Entertainment, and Recreation (+43,000)
Slight uptick in Mining and Logging (+10,000)
Hires:
Total hires remained relatively flat at 5.6 million, with a 3.5% hire rate. No significant changes were recorded across major industries.Separations:
Overall separations totaled 5.3 million with a rate of 3.3%, showing no major month-over-month movement. Breakdown includes:Quits: Held steady at 3.2 million (2.0% rate), though down 220,000 year-over-year.
Layoffs and Discharges: Steady at 1.8 million (1.1% rate). Notable changes:
Increase in Health Care and Social Assistance (+52,000)
Decrease in State and Local Government (excl. education) (–14,000)
Decrease in Federal Government (–4,000)
Other Separations: Flat at 308,000
By Establishment Size:
Both very small (1–9 employees) and very large (5,000+ employees) establishments reported little or no change across all labor movement categories.
Revisions for March 2025:
Job openings were revised up by 8,000 to 7.2 million
Hires were revised down by 7,000 to 5.4 million
Total separations were revised up by 46,000 to 5.2 million
Quits revised up by 12,000
Layoffs and Discharges revised up by 32,000
What This Means:
The April 2025 data suggests a labor market that’s holding steady but not showing strong momentum in either direction. Employers appear cautious, with few significant increases in hiring or layoffs, while worker confidence—measured by the quits rate—remains solid but slightly lower compared to last year.
As we look ahead to the next JOLTS update, scheduled for July 1, 2025, employers, job seekers, and policymakers alike will continue watching for signals of acceleration or slowdown in the broader U.S. economy.
Disclaimer: This blog post is for informational purposes only and should not be construed as financial advice. Always conduct thorough research and consider seeking advice from a financial professional before making any investment decisions.
Start futures #forex fx news #trading with Haawks G4A low latency machine-readable data today, one of the fastest news data feeds for US macro-economic and commodity data.
Please let us know your feedback. If you are interested in timestamps, please send us an email to sales@haawks.com.