USDA Crop Progress: Immediate and Next-Day Market Impact Across Futures, Ethanol, ETFs, and Ag Stocks
Every Monday during the U.S. growing season, the USDA Crop Progress Report gives agricultural markets a fresh read on planting, emergence, crop conditions, and harvest progress.
For traders and analysts, the report is more than an update on field activity. It is a weekly supply-side signal that can influence expectations for yield, production, input costs, and short-term price discovery across directly linked agricultural markets.
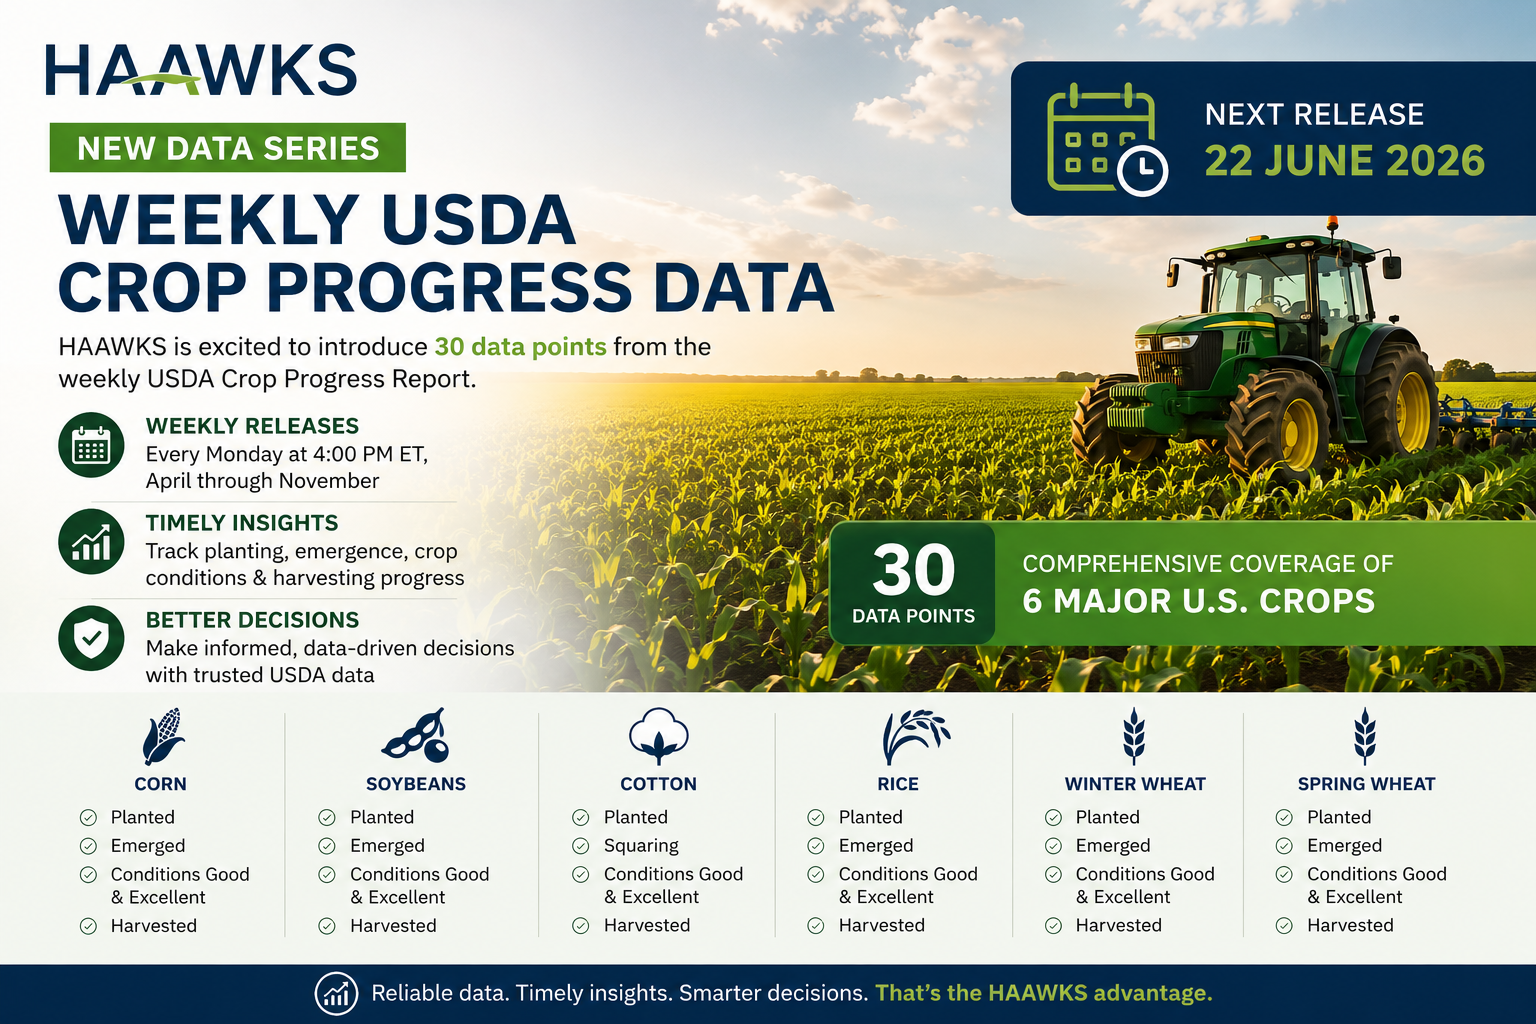
At HAAWKS, we are introducing structured weekly Crop Progress data points across major U.S. crops to help market participants analyze those signals faster and more consistently.
What HAAWKS will track
HAAWKS will disseminate 30 weekly data points from the USDA Crop Progress Report, covering six major U.S. crops:
Table 1: HAAWKS Crop Progress Data Coverage
| Crop | Data Points |
|---|---|
| Corn | Planted, emerged, good/excellent condition, harvested |
| Soybeans | Planted, emerged, good/excellent condition, harvested |
| Cotton | Planted, squaring, good/excellent condition, harvested |
| Rice | Planted, emerged, good/excellent condition, harvested |
| Winter wheat | Planted, emerged, good/excellent condition, harvested |
| Spring wheat | Planted, emerged, good/excellent condition, harvested |
These indicators provide a high-frequency view of crop development and crop health before final yield and production estimates are known.
Why Crop Progress can move markets
The market does not react simply because a Crop Progress number is high or low.
It reacts when the number is different from what traders expected.
A corn crop rated 67% good/excellent may be bullish if the market expected 70%. The same 67% rating may be bearish if the market expected 64%. The important variable is the surprise.
In practice, the reaction framework is straightforward:
Table 2: Crop Progress Surprise and Typical Market Interpretation
| Crop Progress Surprise | Typical Market Interpretation |
|---|---|
| Better-than-expected good/excellent ratings | Higher yield potential, usually bearish for futures |
| Worse-than-expected good/excellent ratings | Greater production risk, usually bullish for futures |
| Faster-than-expected planting | Lower acreage or timing risk, often bearish |
| Slower-than-expected planting | Higher acreage or yield risk, often bullish |
| Faster-than-expected harvest | More near-term supply availability, often bearish nearby futures |
| Slower-than-expected harvest | Delayed supply movement, often supportive nearby futures |
The strongest research evidence is in corn and soybeans, where academic work has found that USDA Crop Progress and condition information can affect futures price discovery around the report window. The effect is especially important during the most weather-sensitive periods of the growing season.
Immediate impact: the first tradable window
The USDA Crop Progress Report is released at 4:00 PM ET. That timing matters.
Most directly linked U.S. agricultural futures markets are already closed when the report is published. As a result, the first clean futures reaction usually happens when markets reopen in the evening session.
Table 3: First Direct Reaction Window by Market
| Market | First Direct Reaction Window |
|---|---|
| Corn futures | Monday evening reopen, around 8:00 PM ET |
| Soybean futures | Monday evening reopen, around 8:00 PM ET |
| Wheat futures | Monday evening reopen, around 8:00 PM ET |
| Rough rice futures | Monday evening reopen, around 8:00 PM ET |
| Cotton No. 2 futures | Monday evening reopen, around 9:00 PM ET |
| Ethanol futures | Potentially same day, because ethanol futures are generally still open at the 4:00 PM ET release time |
This means Crop Progress data is often digested before the evening futures reopen. Traders have time to compare the USDA figures against estimates, prior-week levels, five-year averages, weather forecasts, and crop-stage sensitivity.
Next-day impact
For many users, the most practical impact window is the next trading day.
Tuesday’s session reflects a more complete market response, including overnight futures trading, new analyst commentary, updated weather models, and broader liquidity from U.S. equity and ETF markets.
Useful next-day measures include:
Table 4: Next-Day Market Impact Measures
| Metric | What It Captures |
|---|---|
| Monday settlement to evening reopen | First futures repricing opportunity |
| First 30–60 minutes after reopen | Immediate futures price discovery |
| Monday settlement to Tuesday settlement | Full next-day futures impact |
| Tuesday ETF open vs. prior close | Equity-market translation of the futures move |
| Tuesday stock open vs. prior close | Operational exposure repricing |
This distinction is important for ETFs and stocks. U.S. equities close at 4:00 PM ET, the same time the USDA report is released. While after-hours trading may exist, the cleaner and more liquid equity-market reaction usually occurs the next regular trading day.
Directly linked futures markets
Crop Progress data is most directly relevant for futures tied to the underlying crops.
Table 5: Directly Linked Futures Markets
| Crop Progress Data | Direct Futures Market |
|---|---|
| Corn | CBOT corn futures and options |
| Soybeans | CBOT soybean futures and options |
| Winter wheat | CBOT wheat and KC hard red winter wheat futures and options |
| Spring wheat | Minneapolis hard red spring wheat futures and options |
| Cotton | ICE Cotton No. 2 futures and options |
| Rice | CBOT rough rice futures and options |
| Corn supply outlook | CME denatured fuel ethanol futures |
The futures impact is usually clearest in corn and soybeans because these markets are highly liquid and because Crop Progress data directly informs expectations around planting success, crop health, yield potential, and harvest timing.
The corn–ethanol connection
Ethanol belongs in the Crop Progress discussion because corn is the primary feedstock for U.S. ethanol production.
A stronger-than-expected corn crop can reduce concern about corn availability and input costs for ethanol producers. A weaker-than-expected corn crop can raise concern about feedstock costs and pressure ethanol margins.
The connection is not always one-directional. Ethanol prices also depend on gasoline blending economics, energy prices, Renewable Identification Numbers, export demand, operating rates, inventories, and policy. Still, Crop Progress data can directly affect the corn-cost side of the ethanol margin equation.
A simplified framework:
Table 6: Corn Crop Progress and Ethanol Market Relevance
| Crop Progress Signal | Corn Market Effect | Possible Ethanol-Market Relevance |
|---|---|---|
| Better corn condition than expected | Bearish corn input-cost signal | May support ethanol margins if ethanol prices hold |
| Worse corn condition than expected | Bullish corn input-cost signal | May pressure ethanol margins |
| Faster harvest than expected | More near-term corn availability | Can ease feedstock availability concerns |
| Slower harvest than expected | Delayed corn movement | Can tighten local supply and basis conditions |
For this reason, ethanol futures and ethanol-exposed companies are directly linked to corn Crop Progress data, even if the reaction is filtered through margins rather than through crop price alone.
Directly linked ETFs
For equity-market participants, the cleanest ETF links are futures-based agriculture funds.
Table 7: Directly Linked ETFs
| ETF | Direct Link |
|---|---|
| CORN | Corn futures exposure |
| SOYB | Soybean futures exposure |
| WEAT | Wheat futures exposure |
| DBA | Broad agriculture futures basket |
| TILL | Futures exposure to corn, wheat, soybeans, and sugar |
These ETFs are not Crop Progress instruments themselves. Their link comes from the futures they hold or reference. If Crop Progress creates a meaningful move in corn, soybean, or wheat futures, the effect may be reflected in the relevant futures-based ETF during the next ETF trading session.
Directly linked stocks
Stocks are less pure than futures or futures-based ETFs, but several companies have direct operational exposure to corn, ethanol, grain merchandising, or oilseed processing.
Table 8: Directly Linked Stocks
| Stock | Crop Progress Link |
|---|---|
| Green Plains | Corn feedstock costs and ethanol crush margins |
| Alto Ingredients | Renewable fuels, specialty alcohols, and ethanol-market exposure |
| The Andersons | Grain merchandising and ethanol/renewables exposure |
| Archer-Daniels-Midland | Corn processing, ethanol, oilseeds, and grain merchandising |
| Bunge Global | Oilseed processing, grain origination, and merchandising |
| Valero Energy | Ethanol segment exposure, though diluted by larger refining operations |
For stocks, the Crop Progress signal is usually indirect at the share-price level. A corn condition surprise may affect ethanol margins or merchandising opportunities, but company-specific news, energy prices, crush margins, balance-sheet factors, and broader equity-market conditions can dominate.
The cleanest stock impact is usually in companies with meaningful ethanol or grain-processing exposure, particularly when the Crop Progress surprise is large enough to change expectations for corn costs, soybean supply, or harvest timing.
Public sources for pre-release estimates
Because markets react to surprises, estimates matter.
The most useful comparison is:
Actual USDA value minus pre-release consensus estimate.
Publicly available estimate sources may include:
Table 9: Public Sources for Pre-Release Estimates
| Source Type | Use |
|---|---|
| Reuters analyst polls, often republished by agricultural media | Consensus expectations for planting, harvest, or condition ratings |
| Pro Farmer | Pre-report estimate summaries and market commentary |
| Agriculture.com / Successful Farming | Reuters-based Crop Progress estimates and report coverage |
| Farm Progress / Farm Futures | Analyst expectations and post-report comparisons |
| Barchart / Brugler commentary | Estimate references, crop-rating commentary, and condition-index interpretation |
| DTN / Progressive Farmer | USDA Crop Progress summaries and analyst context |
| USDA NASS prior week and five-year average | Historical baseline, not a consensus estimate |
Prior-week values and five-year averages are important context, but they are not the same as market expectations. A number can be above the five-year average and still disappoint traders if expectations were even higher.
How HAAWKS helps
The value of Crop Progress data is highest when it can be used immediately.
HAAWKS structures the weekly USDA Crop Progress release into clean, real-time data points so users can compare the latest report against the previous week, historical benchmarks, and market estimates.
This helps traders, analysts, and agricultural market participants answer the key questions quickly:
Did the USDA number beat or miss expectations?
Was the surprise large enough to matter?
Which futures markets are directly linked?
Could the reaction carry into ethanol, ETFs, or directly exposed ag stocks the next day?
Conclusion
USDA Crop Progress data is one of the most important weekly inputs for U.S. agricultural market analysis during the growing season.
The strongest immediate and next-day impact is typically seen in directly linked futures markets, especially corn and soybeans. The data can also influence ethanol through the corn feedstock channel and may carry into futures-based agriculture ETFs and directly exposed ag stocks during the next equity-market session.
For market participants, the key is not the absolute number. It is the surprise versus expectations, the seasonal timing of the report, and the market’s ability to translate crop progress into supply, yield, and margin expectations.
By delivering structured Crop Progress data, HAAWKS helps users move from raw USDA figures to market-relevant analysis faster.
Disclaimer: This blog post is for informational purposes only and should not be construed as financial advice. Always conduct thorough research and consider seeking advice from a financial professional before making any investment decisions.
Sources
USDA National Agricultural Statistics Service — Crop Progress
Source for the Crop Progress report description, coverage, and weekly release schedule.
https://esmis.nal.usda.gov/publication/crop-progressCME Group — Corn Futures Contract Specifications
Source for CME grain futures trading hours, including the evening reopen schedule relevant to corn, soybeans, wheat, and rough rice.
https://www.cmegroup.com/markets/agriculture/grains/corn.htmlICE — Cotton No. 2 Futures
Source for ICE Cotton No. 2 trading hours.
https://www.ice.com/products/254/Cotton-No-2-FuturesCME Group — Denatured Fuel Ethanol Futures FAQ
Source for ethanol futures trading hours and the daily maintenance window.
https://www.cmegroup.com/articles/faqs/faq-denatured-fuel-ethanol.htmlCME Group — Are Corn and Ethanol Markets Correlated?
Source for the corn–ethanol market connection, including corn as the primary U.S. ethanol input and ethanol’s share of domestic corn disappearance.
https://www.cmegroup.com/openmarkets/energy/2024/Are-Corn-and-Ethanol-Markets-Correlated.htmlUSDA Economic Research Service — Global Demand for Fuel Ethanol Through 2030
Source for the statement that ethanol manufacturers use about 40% of the U.S. corn crop for ethanol and related co-products.
https://www.ers.usda.gov/publications/pub-details?pubid=105761Lehecka, G. V. — The Value of USDA Crop Progress and Condition Information: Reactions of Corn and Soybean Futures Markets
Academic source supporting the market impact of USDA Crop Progress and condition information on corn and soybean futures.
https://ideas.repec.org/a/ags/jlaare/168261.htmlBethlem et al. — The Impact of the USDA Soybean Crop Condition Reports on Soybean Futures Prices
Academic source supporting next-day soybean futures price reaction to changes in good/excellent soybean crop ratings.
https://www.scielo.br/j/resr/a/vcxYjcBRQYWDd6HL6Vq85WF/?lang=enBain and Fortenbery — Impact of Crop Condition Reports on National and Local Wheat Markets
Academic source showing weaker or mixed evidence for wheat crop condition reports compared with corn and soybeans.
https://www.cambridge.org/core/journals/journal-of-agricultural-and-applied-economics/article/impact-of-crop-condition-reports-on-national-and-local-wheat-markets/F0BC21D69B41FEE1FF420ADD6FC65431Teucrium — CORN Fund
Source for futures-based ETF exposure to corn.
https://teucrium.com/cornTeucrium — SOYB Fund
Source for futures-based ETF exposure to soybeans.
https://teucrium.com/soybeansTeucrium — WEAT Fund
Source for futures-based ETF exposure to wheat.
https://teucrium.com/weatTeucrium — TILL Fund
Source for broader futures-based agricultural exposure.
https://teucrium.com/tillInvesco — DB Agriculture Fund (DBA)
Source for DBA’s exposure to a rules-based index of agricultural commodity futures.
https://www.invesco.com/us/en/financial-products/etfs/invesco-db-agriculture-fund.htmlGreen Plains Annual Report
Source for Green Plains’ corn feedstock exposure in dry-mill ethanol production.
https://gpreinc.com/wp-content/uploads/2024/03/Green-Plains-2023-Annual-Report_Web.pdfADM — Industrial Ethanol Products
Source for ADM ethanol production from corn feedstock.
https://www.adm.com/en-us/products-services/industrial-biosolutions/products/ethanol/