Viewing entries tagged
GBPUSD

Comment

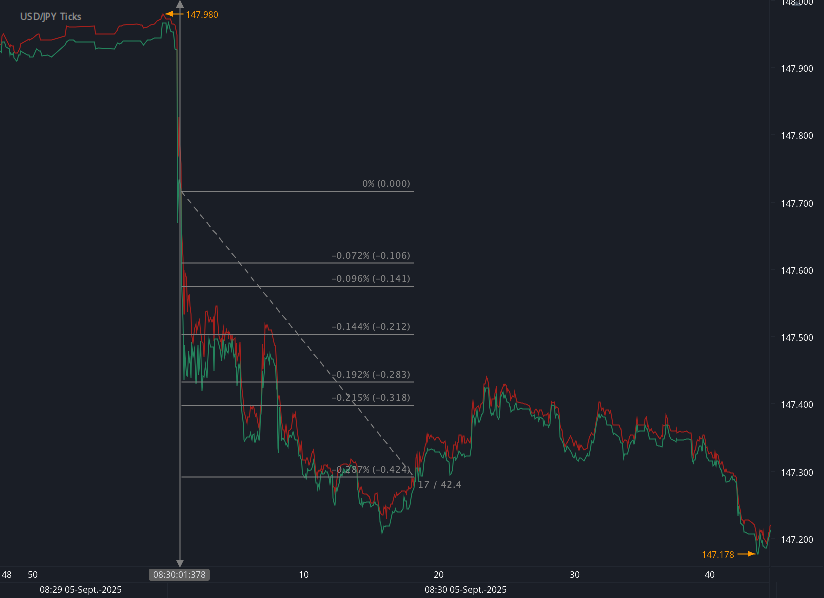
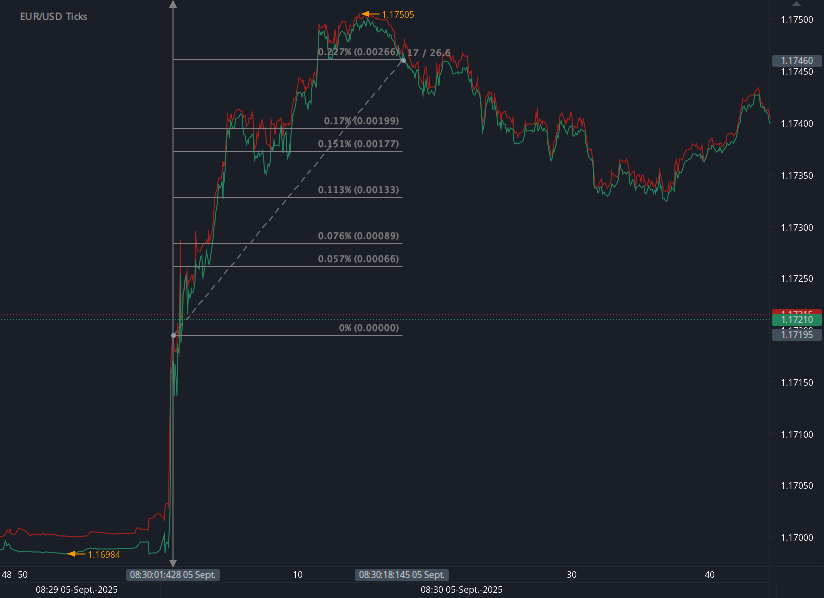
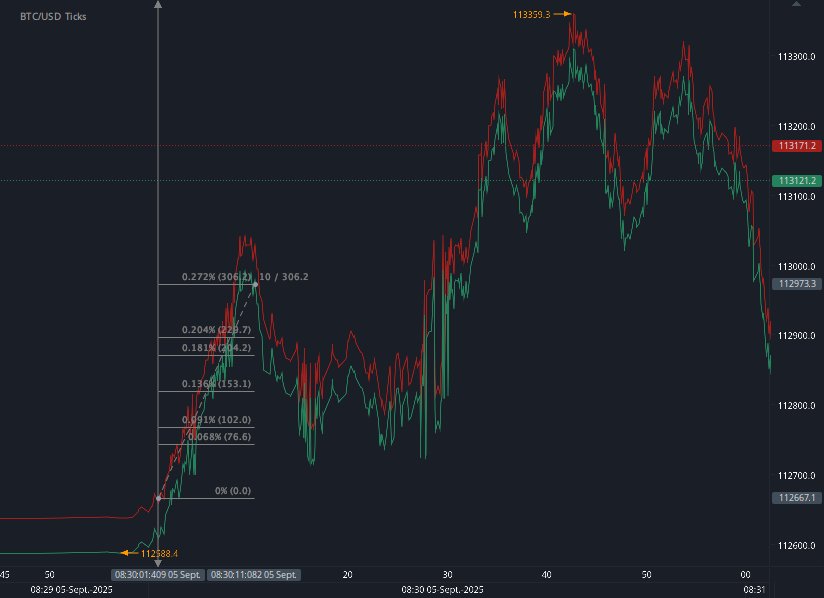
68 pips and BTC 306 points potential profit in 17 seconds on 5 September 2025, analysis on forex fx futures news trading USDJPY, EURUSD and BTC on US Employment Situation (NFP)

According to our analysis USDJPY and EURUSD moved 68 pips and BTC moved 306 points on US Employment Situation (Non-farm payrolls / NFP) data on 5 September 2025.

USDJPY (42 pips)

EURUSD (26 pips)

BTC (306 points)

Charts are exported from JForex (Dukascopy).


U.S. Jobs Report: August 2025 Employment Situation

The U.S. labor market showed little momentum in August 2025, according to the latest report from the Bureau of Labor Statistics (BLS). Nonfarm payroll employment edged up by just 22,000 jobs, while the unemployment rate held steady at 4.3%. Since April, overall job growth has been subdued, with gains in health care tempered by losses in government and energy-related industries.

Key Highlights from the Household Survey

  • Unemployment rate: 4.3%, essentially unchanged for the month.

  • Number of unemployed people: 7.4 million.

  • Long-term unemployment: 1.9 million, accounting for 25.7% of all unemployed, and up 385,000 over the past year.

  • Labor force participation: 62.3%, down 0.4 percentage point over the year.

  • Employment-population ratio: 59.6%, unchanged from July but also down over the year.

  • Part-time for economic reasons: 4.7 million, little changed in August.

  • Not in the labor force but want a job: 6.4 million, up 722,000 compared to last year.

Unemployment rates across major demographic groups—adult men (4.1%), adult women (3.8%), teenagers (13.9%), Whites (3.7%), Blacks (7.5%), Asians (3.6%), and Hispanics (5.3%)—showed little or no movement.

Key Highlights from the Establishment Survey

  • Total payroll employment: +22,000 jobs in August.

  • Health care: +31,000 jobs, led by gains in ambulatory services, hospitals, and nursing/residential care.

  • Social assistance: +16,000 jobs, mainly in individual and family services.

  • Federal government: -15,000 jobs, continuing a steady decline since January (down 97,000 total).

  • Mining, quarrying, and oil & gas extraction: -6,000 jobs, the sharpest monthly drop in over a year.

  • Wholesale trade: -12,000 jobs, down 32,000 since May.

  • Manufacturing: -12,000 jobs, with a notable -15,000 decline in transportation equipment manufacturing, partly due to strike activity.

Other major sectors—including construction, retail trade, financial activities, leisure and hospitality—showed little change in August.

Wages and Work Hours

  • Average hourly earnings: $36.53, up 10 cents (0.3%) in August. Over the past year, wages increased by 3.7%.

  • Production and nonsupervisory employees: $31.46 per hour, up 12 cents (0.4%).

  • Average workweek: 34.2 hours for all employees, unchanged for the third straight month.

  • Manufacturing workweek: slipped slightly to 40.0 hours, with overtime steady at 2.9 hours.

Revisions to Prior Months

  • June 2025 revised down to -13,000 (from +14,000).

  • July 2025 revised up to +79,000 (from +73,000).

  • Combined revisions: net 21,000 fewer jobs than previously reported.

What’s Next?

The September Employment Situation Report will be released on Friday, October 3, 2025. In addition, the BLS will issue its 2025 preliminary benchmark revision to payroll data on September 9, 2025, aligning survey estimates with unemployment insurance records.

Takeaway

The August report underscores a cooling labor market: job gains remain concentrated in health and social services, while government, manufacturing, and energy sectors shed jobs. Wage growth continues at a moderate pace, but labor force participation remains historically low. With revisions showing weaker summer job growth than initially reported, policymakers and businesses alike may be watching closely for signs of whether this slowdown persists into the fall.

Disclaimer: This blog post is for informational purposes only and should not be construed as financial advice. Always conduct thorough research and consider seeking advice from a financial professional before making any investment decisions.

Source: https://www.bls.gov/news.release/empsit.nr0.htm


Start forex fx futures news trading with Haawks G4A low latency machine-readable data today, one of the fastest news data feeds for US macro-economic and commodity data.

Please let us know your feedback. If you are interested in timestamps, please send us an email to sales@haawks.com.

Comment

Comment

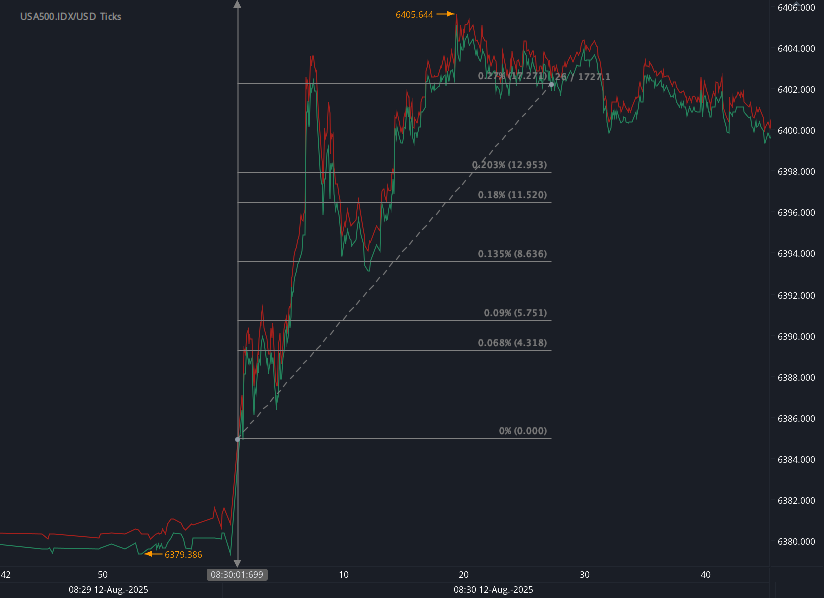
59 pips, US500 17 points, BTC 461 points potential profit in 72 seconds on 12 August 2025, analysis on futures forex fx low latency news trading EURUSD, USDJPY, US500, BTC on US CPI

According to our analysis USDJPY and EURUSD moved 59 pips, US500 moved 17 points and BTC moved 461 points on US BLS Consumer Price Index (CPI) data on 12 August 2025.

USDJPY (35 pip)

EURUSD (24 pips)

US500 (17 points)

BTC (461 points)

Charts are exported from JForex (Dukascopy).


July 2025 Consumer Price Index (CPI) Update: What You Need to Know

The U.S. Bureau of Labor Statistics (BLS) released its Consumer Price Index (CPI) data for July 2025, offering important insights into inflation and price changes affecting everyday Americans. Here’s a breakdown of the key takeaways from the latest report:

Modest Monthly Increase in Overall Prices

The CPI for All Urban Consumers (CPI-U) rose by 0.2% in July on a seasonally adjusted basis, a slight slowdown from June’s 0.3% increase. Over the past year, prices have increased by 2.7%, showing steady but moderate inflation.

What’s Driving the July Increase?

  • Shelter Costs: The main contributor to the monthly rise was shelter, which increased by 0.2%. Rent and owners' equivalent rent both edged up, indicating that housing costs continue to be a significant factor in inflation.

  • Food Prices: The overall food index remained flat in July. However, food away from home (restaurants, takeout) saw a small 0.3% rise, while food at home (groceries) actually decreased slightly by 0.1%. Within groceries, dairy products and meats experienced price gains, but other categories like cereals and bakery products fell.

  • Energy Prices: Energy costs declined by 1.1%, largely due to a 2.2% drop in gasoline prices. Electricity and natural gas prices also edged lower, easing some pressure on household energy bills.

Core Inflation (Excluding Food and Energy)

Prices for all items excluding food and energy rose 0.3% in July, following a 0.2% increase in June. This category includes:

  • Medical Care: Increased notably, with dental services up 2.6% and hospital services also rising.

  • Transportation Services: Airline fares jumped 4.0%, reversing a previous decline.

  • Recreation, Household Furnishings, and Used Vehicles: All saw moderate price increases.

Conversely, lodging away from home and communication services saw price declines.

Year-Over-Year Inflation Trends

  • The all items index rose 2.7% over the past 12 months.

  • Core inflation (less food and energy) increased by 3.1%, reflecting ongoing upward pressure on many services and goods.

  • Energy prices dropped 1.6% year-over-year, driven largely by lower gasoline costs.

  • Food prices climbed 2.9%, with food away from home rising faster (3.9%) than food at home (2.2%).

Noteworthy Changes and Methodology Updates

  • The BLS has updated how it measures wireless telephone services prices by using alternative data sources and methods, aiming for more accurate inflation tracking in this sector.

  • Starting with October 2025 data, long-term care insurance will be removed from the health insurance index due to changes in that market.

What Does This Mean for You?

The July CPI data suggests that while inflation remains moderate, housing and medical care costs continue to be significant contributors to rising prices. Consumers may see some relief from falling energy prices, but dining out and healthcare expenses are becoming more costly.

Looking Ahead

The next CPI report is scheduled for release on September 11, 2025.

Disclaimer: This blog post is for informational purposes only and should not be construed as financial advice. Always conduct thorough research and consider seeking advice from a financial professional before making any investment decisions.

Source: https://www.bls.gov/news.release/cpi.nr0.htm


Start futures forex fx news trading with Haawks G4A low latency machine-readable data, one of the fastest machine-readable news trading feed for US macro-economic and commodity data.

Please let us know your feedback. If you are interested in timestamps, please send us an email to sales@haawks.com.
Comment

Comment

157 pips and BTC 158 points potential profit in 305 seconds on 1 August 2025, analysis on forex fx futures news trading USDJPY, EURUSD and BTC on US Employment Situation (NFP)

According to our analysis USDJPY and EURUSD moved 157 pips and BTC moved 158 points on US Employment Situation (Non-farm payrolls / NFP) data on 1 August 2025.

USDJPY (76 pips)

EURUSD (81 pips)

BTC (158 points)

Charts are exported from JForex (Dukascopy).


July 2025 Jobs Report: U.S. Labor Market Shows Minimal Growth Amid Mixed Signals

The U.S. Bureau of Labor Statistics (BLS) released its July 2025 Employment Situation report, and the labor market continues to show signs of a cooling trend. With just 73,000 jobs added, the monthly job growth has remained tepid since April. The unemployment rate was unchanged at 4.2%, signaling a labor market in a holding pattern as economic uncertainty lingers.

Key Takeaways from July 2025:

Sluggish Job Growth

  • Nonfarm payroll employment rose by only 73,000, well below the average gains seen earlier in the year.

  • Revisions to previous months were significant: May was revised down by 125,000 jobs and June by 133,000, meaning a combined loss of 258,000 jobs from earlier estimates.

Unemployment Rate Holds Steady

  • The unemployment rate remained at 4.2%, largely unchanged since May 2024.

  • The number of unemployed people stood at 7.2 million.

Employment Trends by Sector:

Gains

  • Health care added 55,000 jobs, continuing a strong upward trend. Key contributors were:

    • Ambulatory health care services: +34,000

    • Hospitals: +16,000

  • Social assistance rose by 18,000, mainly driven by:

    • Individual and family services: +21,000

Losses

  • Federal government employment dropped by 12,000 in July and has declined by 84,000 since January.

No Significant Change

  • Industries such as manufacturing, construction, retail, professional services, and leisure and hospitality saw little to no movement.

Worker Demographics and Labor Force Participation:

  • Labor force participation rate: 62.2% (unchanged for the month, down 0.5 percentage points over the year)

  • Employment-population ratio: 59.6% (also little changed)

  • Long-term unemployed (27 weeks or more): Up 179,000 to 1.8 million, making up 24.9% of total unemployed

  • New entrants to the labor force (seeking their first job): Up 275,000 to 985,000

  • Discouraged workers: Decreased by 212,000 to 425,000, following an increase in the prior month

Wages and Work Hours:

  • Average hourly earnings for private nonfarm employees increased by $0.12 (0.3%) to $36.44

  • Over the past 12 months, wages rose by 3.9%

  • Average workweek: Increased slightly by 0.1 hour to 34.3 hours

Looking Ahead

While health care and social services continue to show resilience, the broader employment landscape is stagnating. Job creation has softened significantly, revisions to past reports indicate weaker momentum than previously thought, and long-term unemployment is creeping up.

The next jobs report—covering August—will be released on Friday, September 5, 2025. Additionally, the preliminary 2025 benchmark revision to employment data will be released on September 9, 2025, offering a deeper look into the actual state of the labor market using QCEW data.

Bottom Line: The July 2025 labor market report points to a slow summer for job growth. While wage gains and stable unemployment offer some reassurance, shrinking revisions and rising long-term unemployment suggest that the labor market is cooling more quickly than previously thought.

Disclaimer: This blog post is for informational purposes only and should not be construed as financial advice. Always conduct thorough research and consider seeking advice from a financial professional before making any investment decisions.

Source: https://www.bls.gov/news.release/empsit.nr0.htm


Start forex fx futures news trading with Haawks G4A low latency machine-readable data today, one of the fastest news data feeds for US macro-economic and commodity data.

Please let us know your feedback. If you are interested in timestamps, please send us an email to sales@haawks.com.
Comment

Comment

61 pips potential profit in 26 seconds on 3 July 2025, analysis on forex fx futures news trading USDJPY and EURUSD on US Employment Situation (NFP)

According to our analysis USDJPY and EURUSD moved 61 pips on US Employment Situation (Non-farm payrolls / NFP) data on 3 July 2025.

USDJPY (40 pips)

EURUSD (21 pips)

Charts are exported from JForex (Dukascopy).


July 2025 U.S. Jobs Report: Modest Gains Fuel Cautious Market Response

The U.S. Bureau of Labor Statistics released its June 2025 Employment Situation Report on July 3, revealing moderate but steady growth in the labor market. Nonfarm payrolls rose by 147,000, aligning closely with the 12-month average gain of 146,000. The unemployment rate held steady at 4.1%, showing little change from previous months and continuing the trend of a relatively tight labor market.

Key Highlights from the Report:

  • State Government and Health Care led job creation, adding 47,000 and 39,000 jobs respectively.

  • Federal Government employment declined by 7,000, bringing the total loss since January to 69,000.

  • Average hourly earnings increased by 0.2% to $36.30, while wages for production and nonsupervisory workers climbed 0.3% to $31.24.

  • Long-term unemployment rose by 190,000 to 1.6 million, now accounting for 23.3% of the total unemployed.

  • The labor force participation rate remained unchanged at 62.3%.

Market Reaction: USDJPY and EURUSD Move Modestly

Despite the data being mostly in line with expectations, forex markets saw mild volatility in response to the release:

  • USDJPY rose by 40 pips, signaling modest dollar strength likely tied to steady wage growth and job gains.

  • EURUSD slipped by 21 pips, a subdued reaction reflecting limited surprises in the report.

Overall, the total move across USDJPY and EURUSD was 61 pips, indicating a muted but focused market response, particularly ahead of the long U.S. holiday weekend.

What It Means for Traders

The June report did little to shake market sentiment but reaffirmed the narrative of gradual economic cooling without triggering recession fears. Wage growth remains solid, and job creation—though slower than earlier in the recovery—is still healthy. With the Fed watching inflation and labor market metrics closely, this report may not alter near-term rate expectations significantly but reinforces a “wait-and-see” stance.

Looking ahead, the next Employment Situation Report is scheduled for Friday, August 1, 2025, which could play a more pivotal role in shaping monetary policy expectations as more data accumulate.

Disclaimer: This blog post is for informational purposes only and should not be construed as financial advice. Always conduct thorough research and consider seeking advice from a financial professional before making any investment decisions.

Source: https://www.bls.gov/news.release/empsit.nr0.htm


Start forex fx futures news trading with Haawks G4A low latency machine-readable data today, one of the fastest news data feeds for US macro-economic and commodity data.

Please let us know your feedback. If you are interested in timestamps, please send us an email to sales@haawks.com.

Comment

Comment

3 pips and BTC 222 points potential profit in 23 seconds on 11 June 2025, analysis on futures forex fx low latency news trading EURUSD, USDJPY and BTC on US Consumer Price Index (CPI)

According to our analysis USDJPY and EURUSD moved 3 pips and BTC moved 222 points on US BLS Consumer Price Index (CPI) data on 11 June 2025.

USDJPY (1 pip)

EURUSD (2 pips)

BTC (222 points)

Charts are exported from JForex (Dukascopy).


May 2025 CPI Report: Inflation Holds Steady, Energy Prices Drag Down Headline Numbers

June 12, 2025

The U.S. Bureau of Labor Statistics (BLS) released its Consumer Price Index (CPI) report for May 2025, and the data shows a continued cooling in inflation, with a slight 0.1% increase in consumer prices on a seasonally adjusted basis. This marks a slowdown from April’s 0.2% increase and offers further evidence that inflationary pressures are moderating—albeit unevenly across categories.

Headline Figures at a Glance

  • Monthly CPI (seasonally adjusted): +0.1% in May

  • 12-month CPI (unadjusted): +2.4%

  • Core CPI (excluding food and energy): +0.1% for the month; +2.8% year-over-year

  • Energy index: -1.0% for the month; -3.5% year-over-year

  • Food index: +0.3% for the month; +2.9% year-over-year

What’s Driving the Numbers?

Shelter Continues to Lead

Shelter prices rose 0.3% in May, maintaining a steady upward climb that has been a consistent inflation driver over the past year. Over the last 12 months, shelter prices are up 3.9%, making it the single largest contributor to the overall price increase.

Food Prices Edge Up

Food prices increased 0.3% in May, reversing April’s slight decline. The increase was spread across both food at home (+0.3%) and food away from home (+0.3%). Notably:

  • Cereals and bakery products rose 1.1%

  • Egg prices dropped 2.7%, though they’re still up 41.5% year-over-year

  • Fruits and vegetables nudged up 0.3%, but are down 0.5% over the year

Energy Prices Plunge

Energy was the biggest drag on the overall index. The energy index dropped 1.0%, led by a 2.6% decline in gasoline prices. Over the last 12 months:

  • Gasoline is down 12.0%

  • Fuel oil is down 8.6%

  • Electricity, however, is up 4.5%

  • Natural gas soared 15.3%

Core Services Show Mild Growth

Excluding food and energy, prices rose only 0.1% in May. Increases were noted in:

  • Medical care services (+0.2%)

  • Motor vehicle insurance (+0.7%)

  • Education (+0.3%)

At the same time, several consumer items saw declines, including:

  • Used cars and trucks (-0.5%)

  • New vehicles (-0.3%)

  • Apparel (-0.4%)

  • Airline fares (-2.7%)

What Does This Mean?

The May CPI report underscores a key theme: inflation is slowing but not uniformly. Core inflation remains sticky, especially in services like shelter and insurance, while energy and some goods prices continue to drop, giving the Federal Reserve more breathing room as it weighs future interest rate decisions.

A 2.4% annual inflation rate is close to the Fed’s 2% target, but the 2.8% core inflation figure suggests more progress is needed before declaring full victory over inflation.

What to Watch Next

Looking ahead, two major changes are coming:

  • Rebasing of CPI series starting in July 2025 will align selected indexes to a new reference base of December 2024 = 100.

  • Changes to wireless services CPI methodology beginning with July data will use alternative data sources and methods to reflect real-time pricing trends more accurately.

The June CPI report is scheduled for release on July 15, 2025.

Disclaimer: This blog post is for informational purposes only and should not be construed as financial advice. Always conduct thorough research and consider seeking advice from a financial professional before making any investment decisions.

Source: https://www.bls.gov/news.release/cpi.nr0.htm


Start futures forex fx news trading with Haawks G4A low latency machine-readable data, one of the fastest machine-readable news trading feed for US macro-economic and commodity data.

Please let us know your feedback. If you are interested in timestamps, please send us an email to sales@haawks.com.

Comment

Comment

37 pips, US500 11 points and BTC 209 points potential profit in 18 seconds on 6 June 2025, analysis on forex fx futures news trading USDJPY, EURUSD, US500 and BTC on US Employment Situation (NFP) data

According to our analysis USDJPY and EURUSD moved 37 pips, US500 moved 11 points and BTC moved 209 points on US Employment Situation (Non-farm payrolls / NFP) data on 6 June 2025.

USDJPY (24 pips)

EURUSD (13 pips)

US500 (11 points)

BTC (209 points)

Charts are exported from JForex (Dukascopy).


U.S. Job Market Update: May 2025 Shows Steady Growth but Signs of Cooling

The U.S. labor market maintained moderate momentum in May 2025, according to the latest report from the Bureau of Labor Statistics (BLS), with total nonfarm payroll employment rising by 139,000 jobs. The unemployment rate held steady at 4.2%, continuing a 12-month trend of hovering between 4.0% and 4.2%.

Key Highlights

  • Job Growth by Sector:

    • Health Care led the way with +62,000 jobs, particularly in hospitals and ambulatory services.

    • Leisure and Hospitality added +48,000 jobs, mostly in food services and bars.

    • Social Assistance grew by +16,000 jobs, continuing its steady upward trend.

    • Federal Government employment continued to decline, down 22,000 jobs in May and 59,000 since January.

  • Wages and Hours:

    • Average hourly earnings rose by $0.15 to $36.24, a 0.4% monthly increase, and 3.9% over the past year.

    • The average workweek held steady at 34.3 hours.

  • Labor Force Metrics:

    • The employment-population ratio slipped to 59.7%, and labor force participation decreased to 62.4%.

    • Long-term unemployment dropped by 218,000 to 1.5 million, making up 20.4% of total unemployment.

    • Those jobless for less than 5 weeks rose by 264,000 to 2.5 million.

Revisions & Notes

  • March and April job gains were revised downward by a combined 95,000 jobs, suggesting the labor market may be slightly weaker than previously believed.

  • A minor correction was made to April’s household survey data due to the rollout of a redesigned sample.

  • A shift in classification of certain New York state workers impacted industry employment counts, transferring jobs from health care to social assistance.

Takeaway

The May report signals a job market that remains resilient but cautious. While job growth continues, it’s slower than the pace seen earlier in the recovery. Wage growth is steady, but softening participation and revisions to previous months hint at underlying labor market fragility. All eyes will be on the June report, due July 3, for confirmation of any emerging trends.

Disclaimer: This blog post is for informational purposes only and should not be construed as financial advice. Always conduct thorough research and consider seeking advice from a financial professional before making any investment decisions.

Source: https://www.bls.gov/news.release/empsit.nr0.htm


Start forex fx futures news trading with Haawks G4A low latency machine-readable data today, one of the fastest news data feeds for US macro-economic and commodity data.

Please let us know your feedback. If you are interested in timestamps, please send us an email to sales@haawks.com.
Comment

Comment

3 pips and US500 14 points potential profit in 23 seconds on 13 May 2025, analysis on futures forex fx low latency news trading USDJPY and US500 on US Consumer Price Index (CPI)

According to our analysis USDJPY moved 3 pips and US500 moved 14 points on US BLS Consumer Price Index (CPI) data on 13 May 2025.

USDJPY (3 pips)

US500 (14 points)

Charts are exported from JForex (Dukascopy).


April 2025 CPI Report: Inflation Slows, Shelter and Energy Drive Modest Gains

The U.S. Bureau of Labor Statistics (BLS) released the Consumer Price Index (CPI) data for April 2025, offering a mixed picture of inflation trends across the economy. Overall, consumer prices rose 0.2% in April on a seasonally adjusted basis after a slight decline in March. Year-over-year, prices are up 2.3% before seasonal adjustment, marking the smallest annual increase since February 2021.

Key Highlights:

  • Overall Inflation: +0.2% month-over-month in April; +2.3% year-over-year.

  • Core Inflation (excluding food and energy): +0.2% in April; +2.8% over the past 12 months.

  • Food Prices: Declined by 0.1% in April, driven by a sharp 0.4% drop in the food at home index.

  • Energy Prices: Rose 0.7% in April but are still down 3.7% compared to a year ago.

Shelter Continues to Lead

The shelter index increased by 0.3% in April, accounting for more than half of the overall rise in CPI. On an annual basis, shelter costs have risen 4.0%, making it a significant contributor to persistent core inflation. Rents and owners' equivalent rent both increased 0.3% and 0.4% respectively in April.

Energy Prices Rebound Slightly

While energy prices rose in April, the rebound was modest. Natural gas saw a notable 3.7% increase, and electricity rose 0.8%. However, gasoline prices dipped slightly by 0.1% (though they rose 2.9% before seasonal adjustment). Over the last 12 months, gasoline prices have dropped 11.8%, and fuel oil is down 9.6%.

Food Prices Show Mixed Trends

Food at home prices dropped 0.4%, the largest monthly decline since September 2020. The sharpest decline was seen in eggs, down 12.7% in April. Most major grocery categories posted declines, while nonalcoholic beverages were up 0.7%. In contrast, the food away from home index rose 0.4%, driven by increases in full-service (+0.6%) and limited-service meals (+0.3%).

Over the past year, food prices have risen 2.8%, with food away from home up 3.9% and food at home up 2.0%. Notably, egg prices have surged 49.3% year-over-year despite the April drop.

Core Categories Show Mixed Movement

Beyond food and energy, prices for household furnishings and operations increased 1.0%, and motor vehicle insurance rose 0.6%. Medical care rose 0.5%, with increases in hospital services (+0.6%) and prescription drugs (+0.4%).

Some categories saw declines, including airline fares (-2.8%), used cars and trucks (-0.5%), communication, and apparel (-0.2%). New vehicle prices remained unchanged.

A Shift in Methodology

April 2025 also marked a methodological update for the CPI. The BLS has transitioned to using transaction data purchased from a vendor to calculate the leased cars and trucks index, aiming to improve accuracy.

Looking Ahead

The next CPI release, covering May 2025, is scheduled for Wednesday, June 11, 2025. It will offer further insights into whether inflation continues to moderate and how evolving economic conditions impact consumer prices.

Disclaimer: This blog post is for informational purposes only and should not be construed as financial advice. Always conduct thorough research and consider seeking advice from a financial professional before making any investment decisions.

Source: https://www.bls.gov/news.release/cpi.nr0.htm


Start futures forex fx news trading with Haawks G4A low latency machine-readable data, one of the fastest machine-readable news trading feed for US macro-economic and commodity data.

Please let us know your feedback. If you are interested in timestamps, please send us an email to sales@haawks.com.

Comment

Comment

19 pips, US500 19 points and BTC 192 points potential profit in 92 seconds on 2 May 2025, analysis on forex fx futures news trading USDJPY, US500 and BTC on US Employment Situation (NFP) data

According to our analysis USDJPY, US500 and BTC moved 19 pips, 19 points and 192 points on US Employment Situation (Non-farm payrolls / NFP) data on 2 May 2025.

USDJPY (19 pips)

US500 (19 points)

BTC (192 points)

Charts are exported from JForex (Dukascopy).


April 2025 Jobs Report: Steady Growth with a Few Soft Spots

The U.S. labor market continued its slow but steady climb in April 2025, according to the latest data from the Bureau of Labor Statistics (BLS). Nonfarm payrolls increased by 177,000, a solid gain that’s slightly above the average monthly increase of 152,000 over the past year. Meanwhile, the unemployment rate held steady at 4.2%, continuing a nearly year-long trend of relative stability in joblessness.

Key Takeaways:

Job Growth Driven by Health Care and Transportation

  • Health care led the way with 51,000 new jobs, continuing its strong performance from previous months. Hospitals and ambulatory health care services were major contributors.

  • Transportation and warehousing added 29,000 jobs, with gains in warehousing and storage (+10,000), couriers and messengers (+8,000), and air transportation (+3,000).

Other Industries on the Rise

  • Financial activities added 14,000 jobs, bringing total gains since April 2024 to over 100,000.

  • Social assistance employment rose by 8,000, though at a slower pace than usual.

Federal Government Job Cuts

  • Federal employment fell by 9,000 jobs in April and is down 26,000 since January. This marks a continued contraction in the public sector.

Other Notable Stats:

  • The number of unemployed people remained at 7.2 million.

  • Long-term unemployment rose to 1.7 million, making up 23.5% of all unemployed persons.

  • The labor force participation rate stayed flat at 62.6%, and the employment-population ratio held at 60.0%.

  • Wages continue to grow modestly:

    • Average hourly earnings rose by 6 cents to $36.06, up 3.8% year-over-year.

    • Nonsupervisory workers saw a 10-cent gain to $31.06.

Revisions & Trends

The jobs numbers from February and March were revised down by a total of 58,000 jobs, tempering earlier optimism. While these revisions don't indicate a major downturn, they reflect the continued balancing act of a cooling economy with pockets of resilience.

Bottom Line:

April’s jobs report reflects a labor market that’s stable, but not booming. Most of the gains are concentrated in a few key sectors, while other areas — including government — are shedding jobs. Wage growth is modest, and the overall unemployment rate remains within a narrow range.

With the next employment report due June 6, attention will remain focused on whether this steady trajectory can be maintained amid ongoing economic uncertainties.

Disclaimer: This blog post is for informational purposes only and should not be construed as financial advice. Always conduct thorough research and consider seeking advice from a financial professional before making any investment decisions.

Source: https://www.bls.gov/news.release/empsit.nr0.htm


Start forex fx futures news trading with Haawks G4A low latency machine-readable data today, one of the fastest news data feeds for US macro-economic and commodity data.

Please let us know your feedback. If you are interested in timestamps, please send us an email to sales@haawks.com.

Comment

Comment

23 pips, US30 147 points and BTC 1279 points potential profit in 32 seconds on 12 February 2025, analysis on futures forex fx low latency news trading USDJPY on US Consumer Price Index (CPI)

According to our analysis USDJPY moved 23 pips, US30 moved 147 points and Bitcoin (BTC) moved 1279 points on US BLS Consumer Price Index (CPI) data on 12 February 2025.

USDJPY (23 pips)

US30 (147 points)

Bitcoin BTC (1279 points)

Charts are exported from JForex (Dukascopy).


CPI Report Shakes Markets: USD/JPY Gains, US30 Drops, BTC Dips

The January 2025 Consumer Price Index (CPI) report released by the Bureau of Labor Statistics showed a higher-than-expected inflation increase of 0.5% month-over-month, bringing the annual CPI to 3.0%. This data immediately sent ripples through the financial markets, impacting major asset classes, including forex, equities, and crypto.

Key CPI Highlights:

  • Headline CPI: +0.5% (MoM), +3.0% (YoY)

  • Core CPI (Ex-Food & Energy): +0.4% (MoM), +3.3% (YoY)

  • Shelter Costs: +0.4% MoM, a major driver of inflation

  • Energy Index: +1.1% MoM, fueled by a 1.8% increase in gasoline prices

  • Food Index: +0.4% MoM, with food-at-home prices up 0.5%

Market Reaction:

Forex – USD/JPY Rises 23 Pips

The U.S. dollar strengthened against the Japanese yen, with USD/JPY climbing 23 pips post-release. This move reflects increased expectations that the Federal Reserve may need to maintain higher interest rates for longer to combat inflation. The resilience of core CPI above 3.0% further solidifies the Fed’s hawkish stance, making USD more attractive compared to JPY, which remains under the Bank of Japan’s ultra-loose policy.

Equities – US30 Drops 147 Points

Wall Street reacted negatively to the inflation data, with the Dow Jones Industrial Average (US30) falling 147 points. Investors are concerned that persistent inflation may delay any potential Fed rate cuts, dampening risk appetite. Additionally, rising costs for shelter and transportation services indicate that consumer spending power could take a hit, affecting corporate earnings.

Crypto – Bitcoin Drops 1,279 Points

Bitcoin (BTC) saw a sharp decline of 1,279 points following the CPI release, reflecting a risk-off sentiment in the broader market. Higher-than-expected inflation led to speculation that Fed policy will remain tight, reducing liquidity for riskier assets like crypto. BTC’s drop also aligns with a broader sell-off in tech and growth stocks, which tend to be more sensitive to interest rate outlooks.

Final Thoughts

Traders should brace for continued volatility as inflation concerns linger. The next major catalyst will be the Fed’s response in upcoming meetings and market reactions to any further economic data releases. Stay alert to potential breakout moves in USD/JPY, US30, and BTC as inflation trends develop.

Disclaimer: This blog post is for informational purposes only and should not be construed as financial advice. Always conduct thorough research and consider seeking advice from a financial professional before making any investment decisions.

Source: https://www.bls.gov/news.release/cpi.nr0.htm


Start futures forex fx news trading with Haawks G4A low latency machine-readable data, one of the fastest machine-readable news trading feed for US macro-economic and commodity data.

Please let us know your feedback. If you are interested in timestamps, please send us an email to sales@haawks.com.

Comment

Comment

25 pips, US30 90 points and BTC 1018 points potential profit in 40 seconds on 15 January 2025, analysis on futures forex fx low latency news trading USDJPY, EURUSD on US Consumer Price Index (CPI)

According to our analysis USDJPY and EURUSD moved 54 pips, US30 moved 90 points and Bitcoin (BTC) moved 1018 points on US BLS Consumer Price Index (CPI) data on 15 January 2025.

USDJPY (18 pips)

EURUSD (7 pips)

US30 (90 points)

Bitcoin BTC (1018 points)

Charts are exported from JForex (Dukascopy).


December 2024 CPI Report: Core Inflation Falls Short of Expectations – What It Means for Markets

The U.S. Bureau of Labor Statistics released the Consumer Price Index (CPI) for December 2024 on January 15, 2025. While headline inflation was in line with expectations, core inflation (excluding food and energy) came in slightly cooler than anticipated. The headline CPI rose 0.4% month-over-month and 2.9% year-over-year, meeting forecasts. However, core CPI increased by 0.2% month-over-month (vs. 0.3% expected) and 3.2% year-over-year (vs. 3.3% expected). Here’s a breakdown of the report and its implications for traders.

Headline Takeaways

  1. Headline Inflation: The all-items index rose 0.4% month-over-month and 2.9% year-over-year, reflecting steady inflationary pressures in energy and food prices.

  2. Core Inflation Misses: Core CPI rose 0.2% month-over-month, below the forecasted 0.3%. Year-over-year, core inflation moderated to 3.2%, also below the expected 3.3%.

  3. Energy Drives the Headline: Energy prices surged 2.6% month-over-month, with gasoline prices jumping 4.4%, making energy a key driver of the overall CPI increase.

  4. Food Inflation Holds Steady: Food prices rose 0.3% month-over-month, with both food at home and food away from home contributing equally to the increase.

Market Implications of Core CPI Miss

Cooling Core Inflation Trends

  • The 0.2% month-over-month rise in core CPI marked a modest cooling from the expected 0.3%. Year-over-year, the 3.2% core inflation rate signals gradual easing in underlying price pressures.

  • Market Impact: A softer-than-expected core reading could prompt markets to reassess the Federal Reserve’s policy stance, increasing the likelihood of a pause or easing cycle sooner than previously anticipated.

Energy Price Surge Shifts Focus

  • Energy prices rose significantly, with a 4.4% increase in gasoline prices dominating the report. However, on a year-over-year basis, energy remains a deflationary factor, down 0.5%.

  • Market Impact: Energy-driven headline inflation may not alter the Fed’s trajectory if core inflation continues to cool, but it could buoy commodity markets and inflation-sensitive sectors.

Sector Breakdown

Shelter Remains Elevated

  • Shelter costs rose 0.3% month-over-month and 4.6% year-over-year. Shelter remains the largest contributor to core inflation but showed signs of stabilization.

  • Implications for Traders: Persistent shelter inflation could limit the Fed’s flexibility, supporting higher-for-longer interest rate expectations.

Food Prices Steady but Mixed

  • Food at home (+0.3%) and food away from home (+0.3%) rose in tandem. Cereals and bakery products saw a sharp rise (+1.2%), while nonalcoholic beverages (-0.4%) and fruits and vegetables (-0.1%) declined.

  • Market Impact: Stable food inflation supports consumer purchasing power, benefiting consumer discretionary stocks.

Transportation and Autos Drive Core

  • Used cars and trucks rebounded with a 1.2% increase, while new vehicles rose 0.5%. Airline fares surged 3.9%.

  • Implications for Traders: Rising auto and transportation costs could impact consumer sentiment and provide short-term tailwinds to related industries.

Fed Policy Implications

With core CPI coming in below expectations, markets may interpret the data as a sign that inflation is moderating toward the Federal Reserve’s target. While headline inflation remains steady, the softer core reading could shift the Fed’s tone toward a more dovish stance, especially if cooling trends persist.

Trading Opportunities

  1. Equities: Growth stocks and rate-sensitive sectors may gain on expectations of a dovish Fed. Defensive sectors may face headwinds if inflation pressures ease.

  2. Bonds: Treasury yields could decline, particularly on the shorter end of the curve, as markets price in reduced rate hike probabilities.

  3. Commodities: Energy markets may rally due to the sharp increase in gasoline and natural gas prices. Gold could see gains if inflation expectations moderate.

  4. Forex: The U.S. Dollar Index (DXY) might weaken if traders anticipate a softer Fed policy path.

Disclaimer: This blog post is for informational purposes only and should not be construed as financial advice. Always conduct thorough research and consider seeking advice from a financial professional before making any investment decisions.

Source: https://www.bls.gov/news.release/cpi.nr0.htm


Start futures forex fx news trading with Haawks G4A low latency machine-readable data, one of the fastest machine-readable news trading feed for US macro-economic and commodity data.

Please let us know your feedback. If you are interested in timestamps, please send us an email to sales@haawks.com.

Comment