According to our analysis USDJPY moved 37 pips, EURUSD moved 25 pips, XAUUSD (spot gold) moved 43 points and US500 moved 56 ticks (118 ticks total) on US Employment Situation (Non-farm payrolls / NFP) data on 2 July 2026.
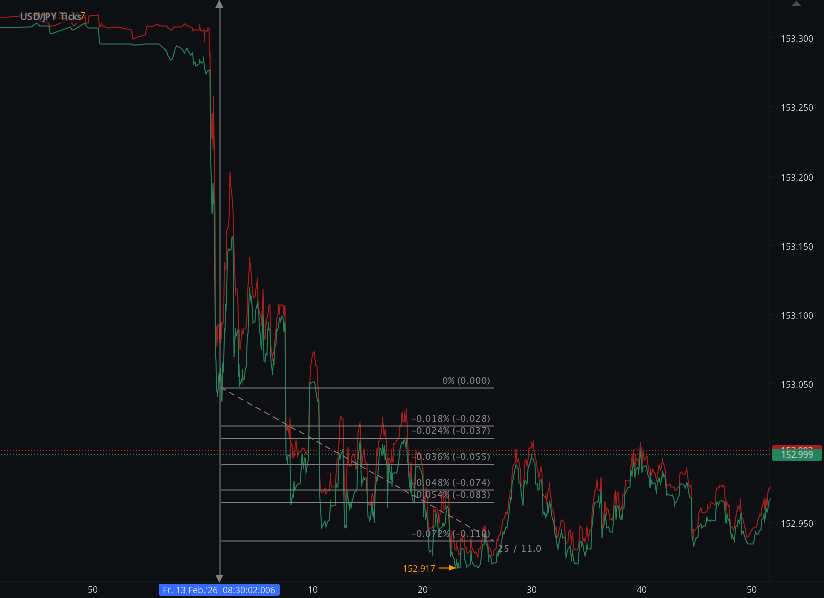
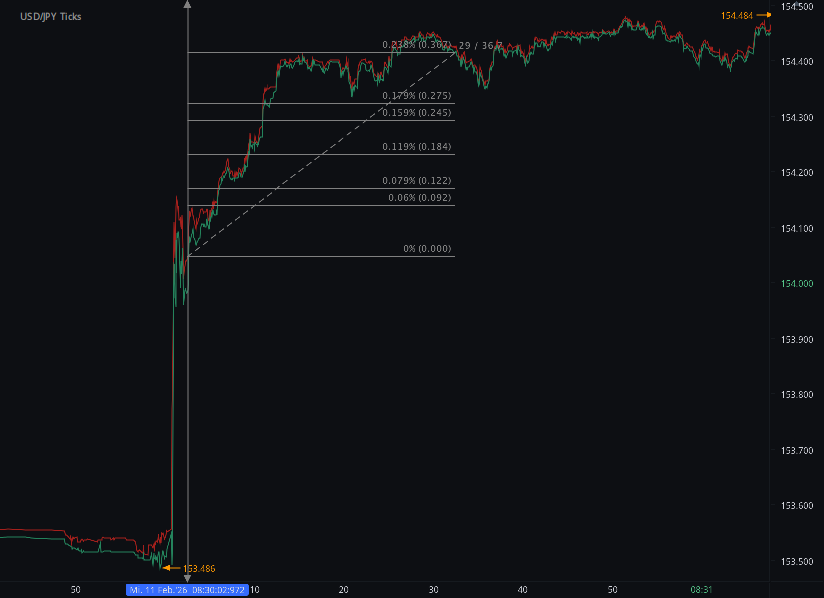
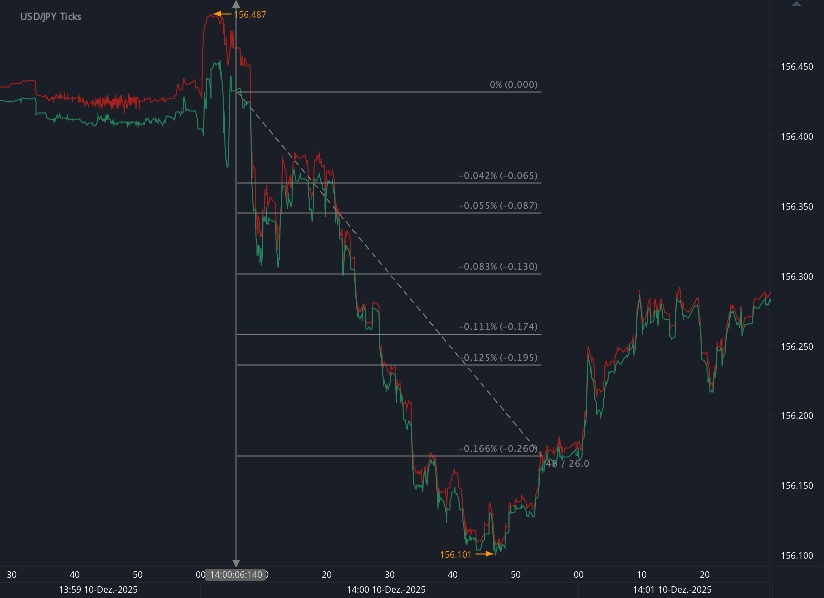
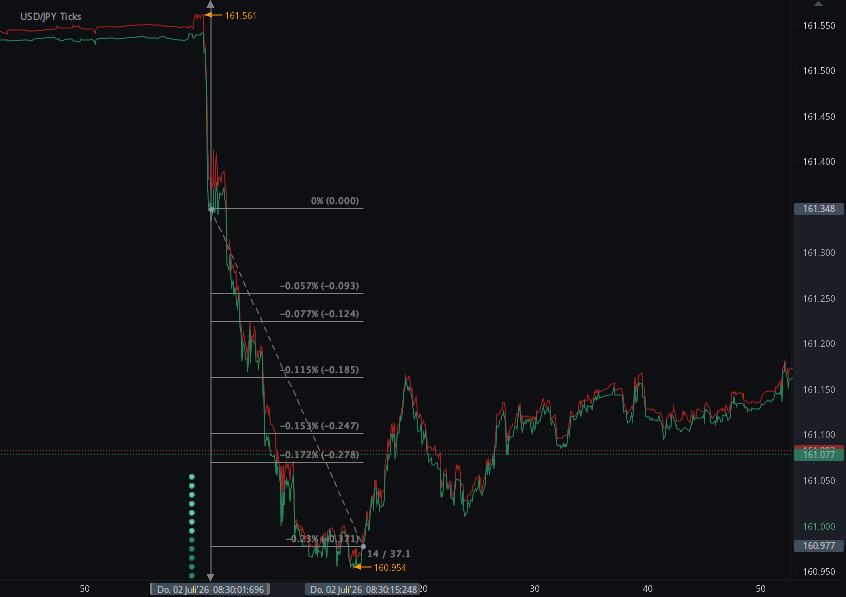
USDJPY (37 pips)
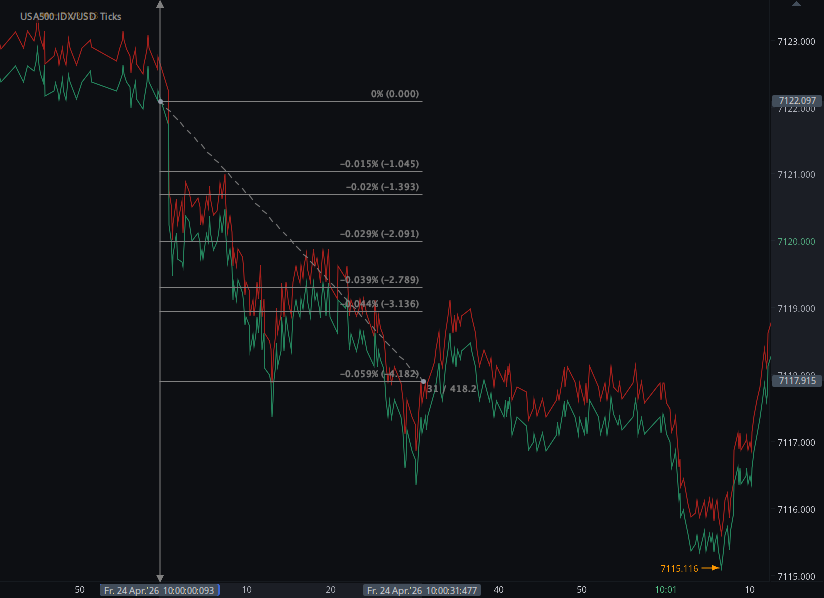
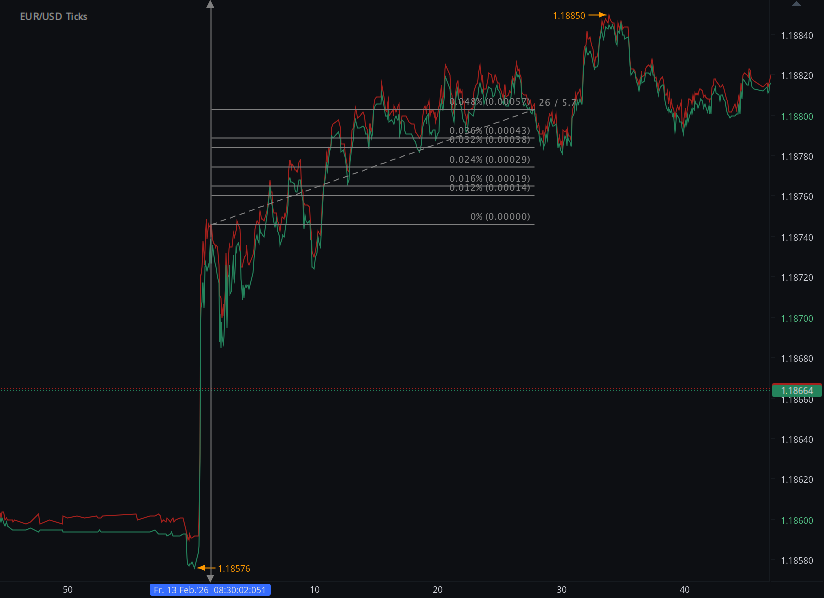
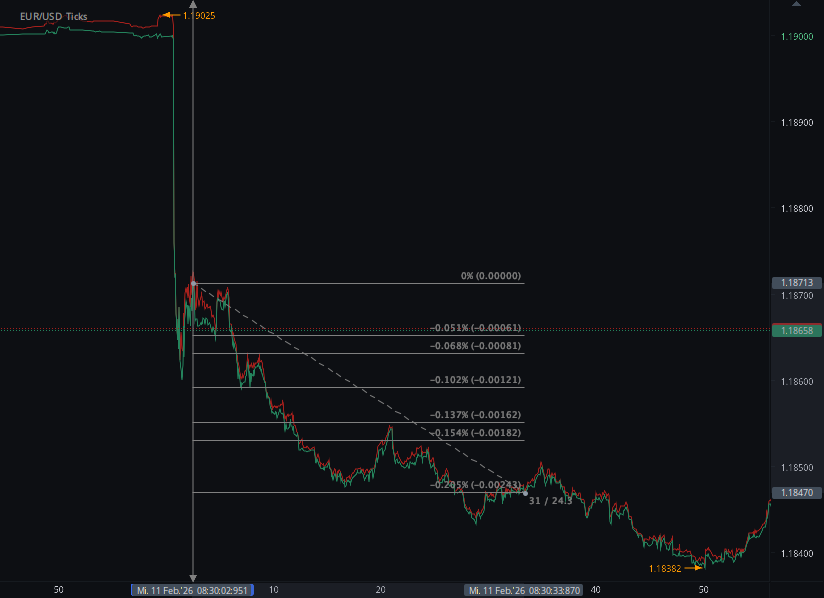
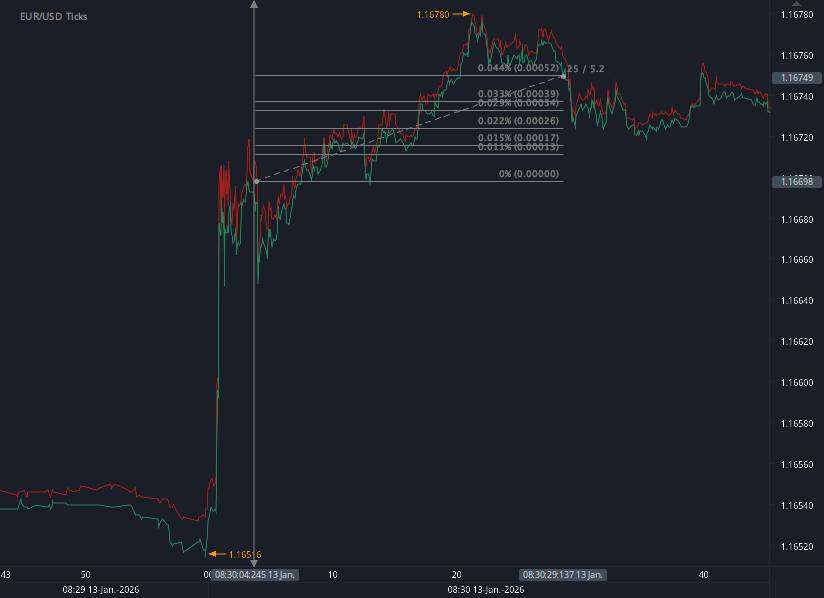
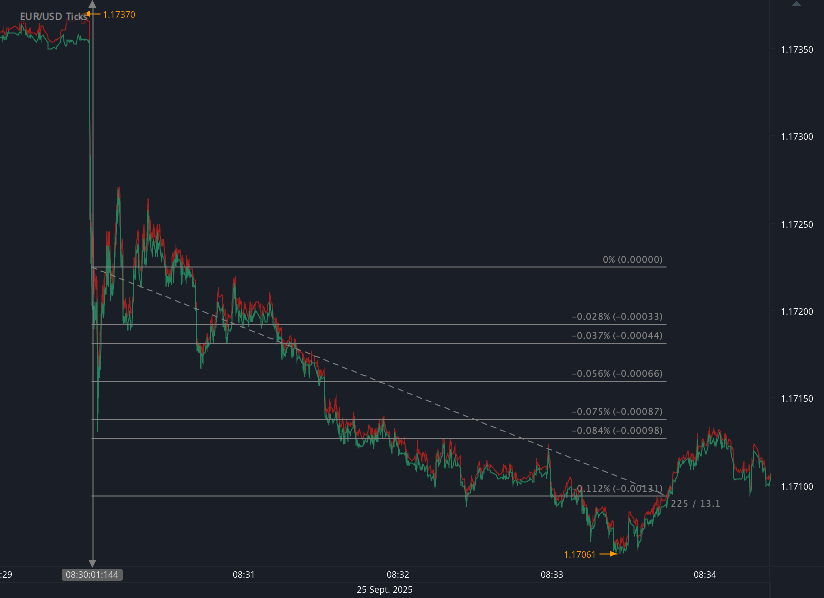
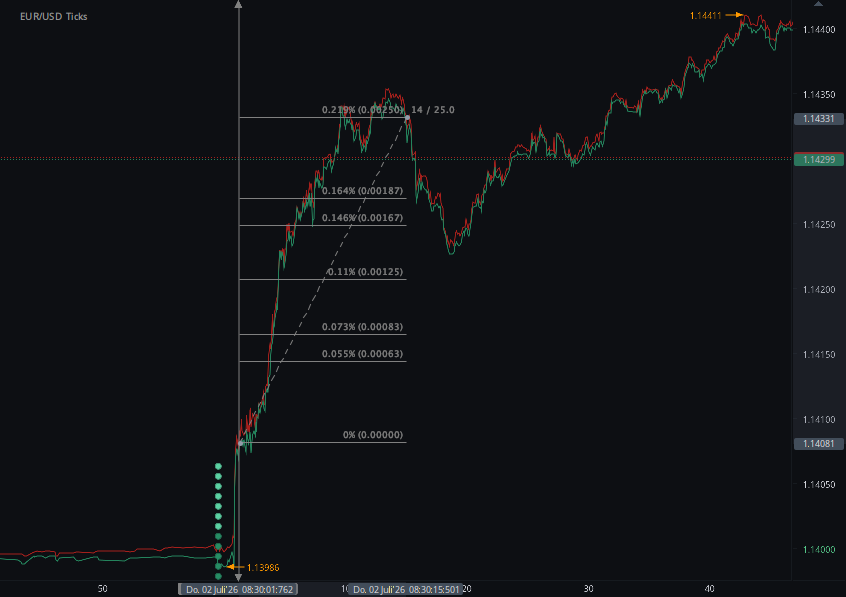
EURUSD (25 pips)
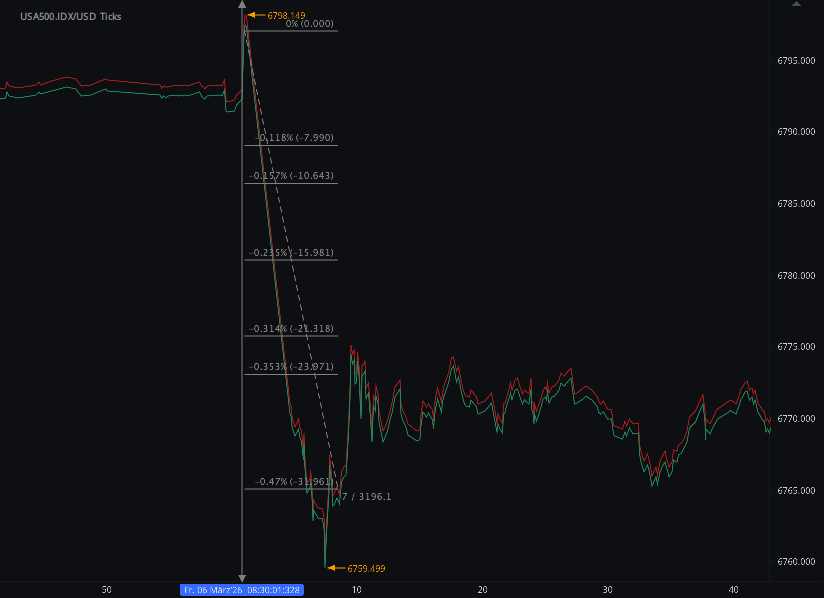
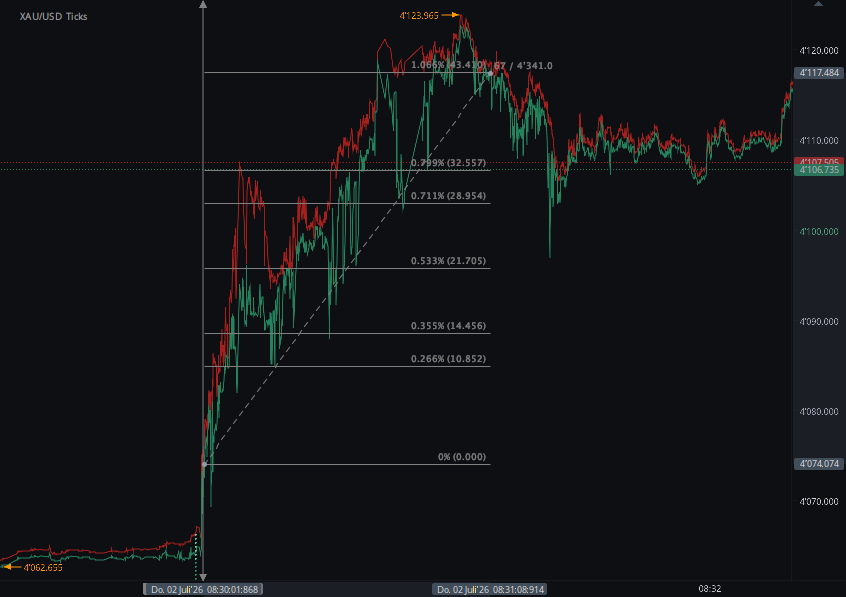
XAUUSD (43 points)
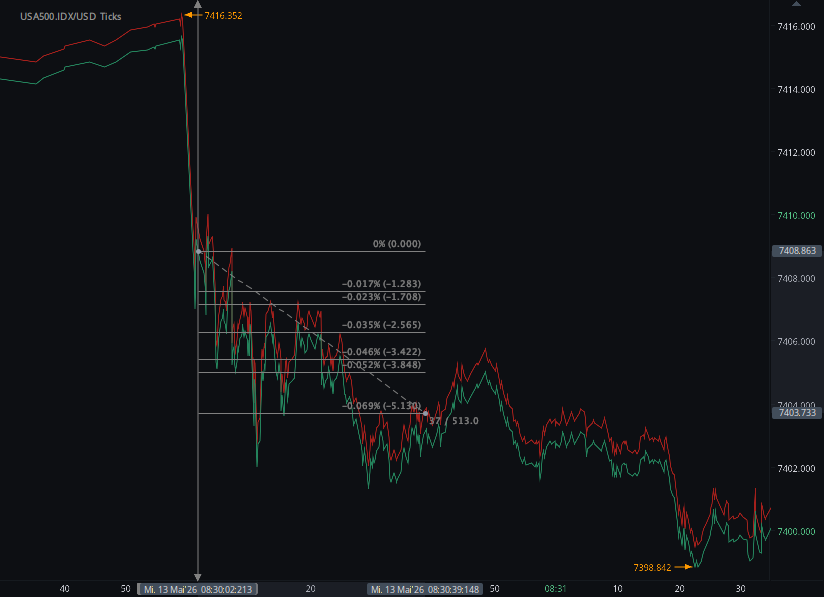
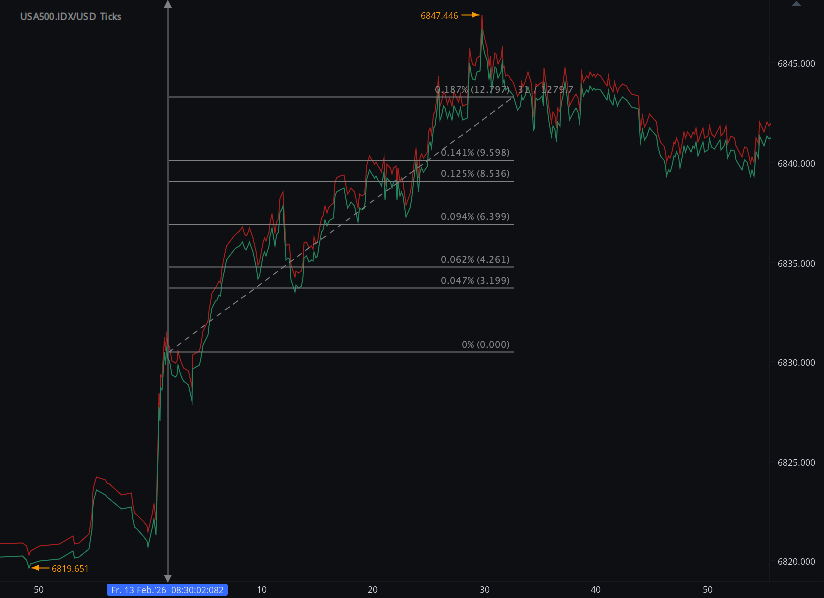
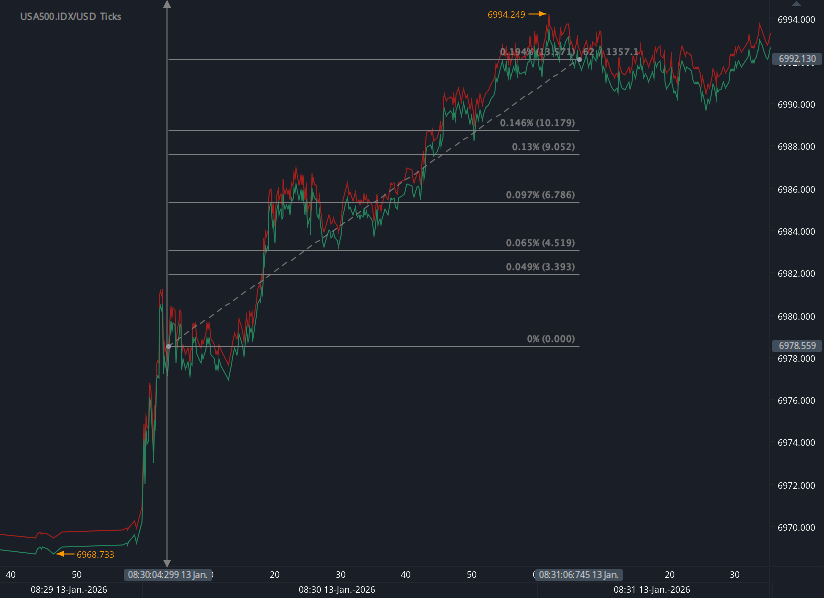
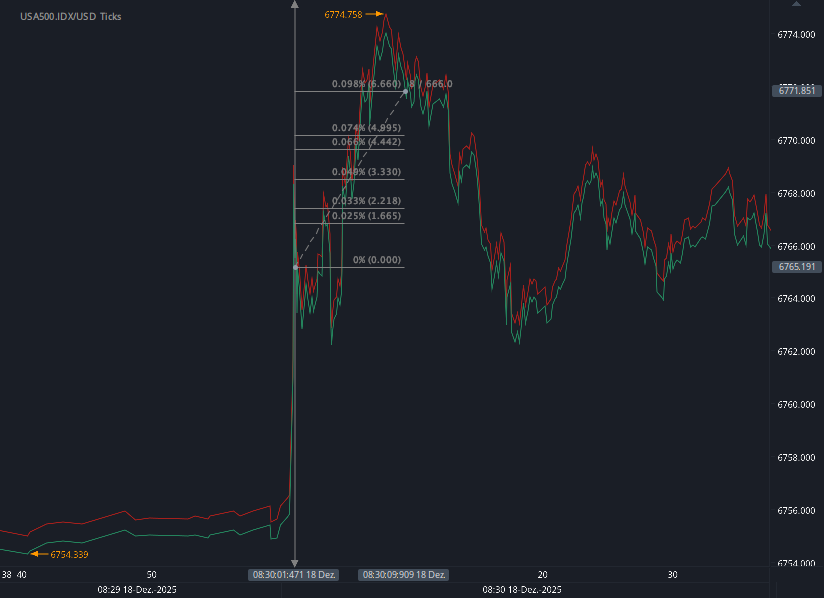
US500 (56 ticks)
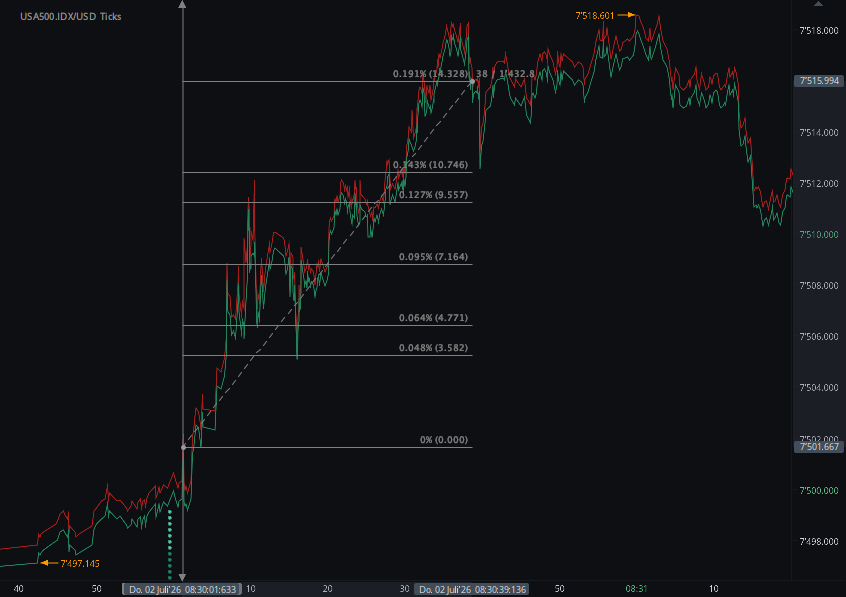
Charts are exported from JForex (Dukascopy).
June 2026 NFP: Softer Jobs, Stable Wages, Sharp Market Reaction
HAAWKS Research | July 2, 2026
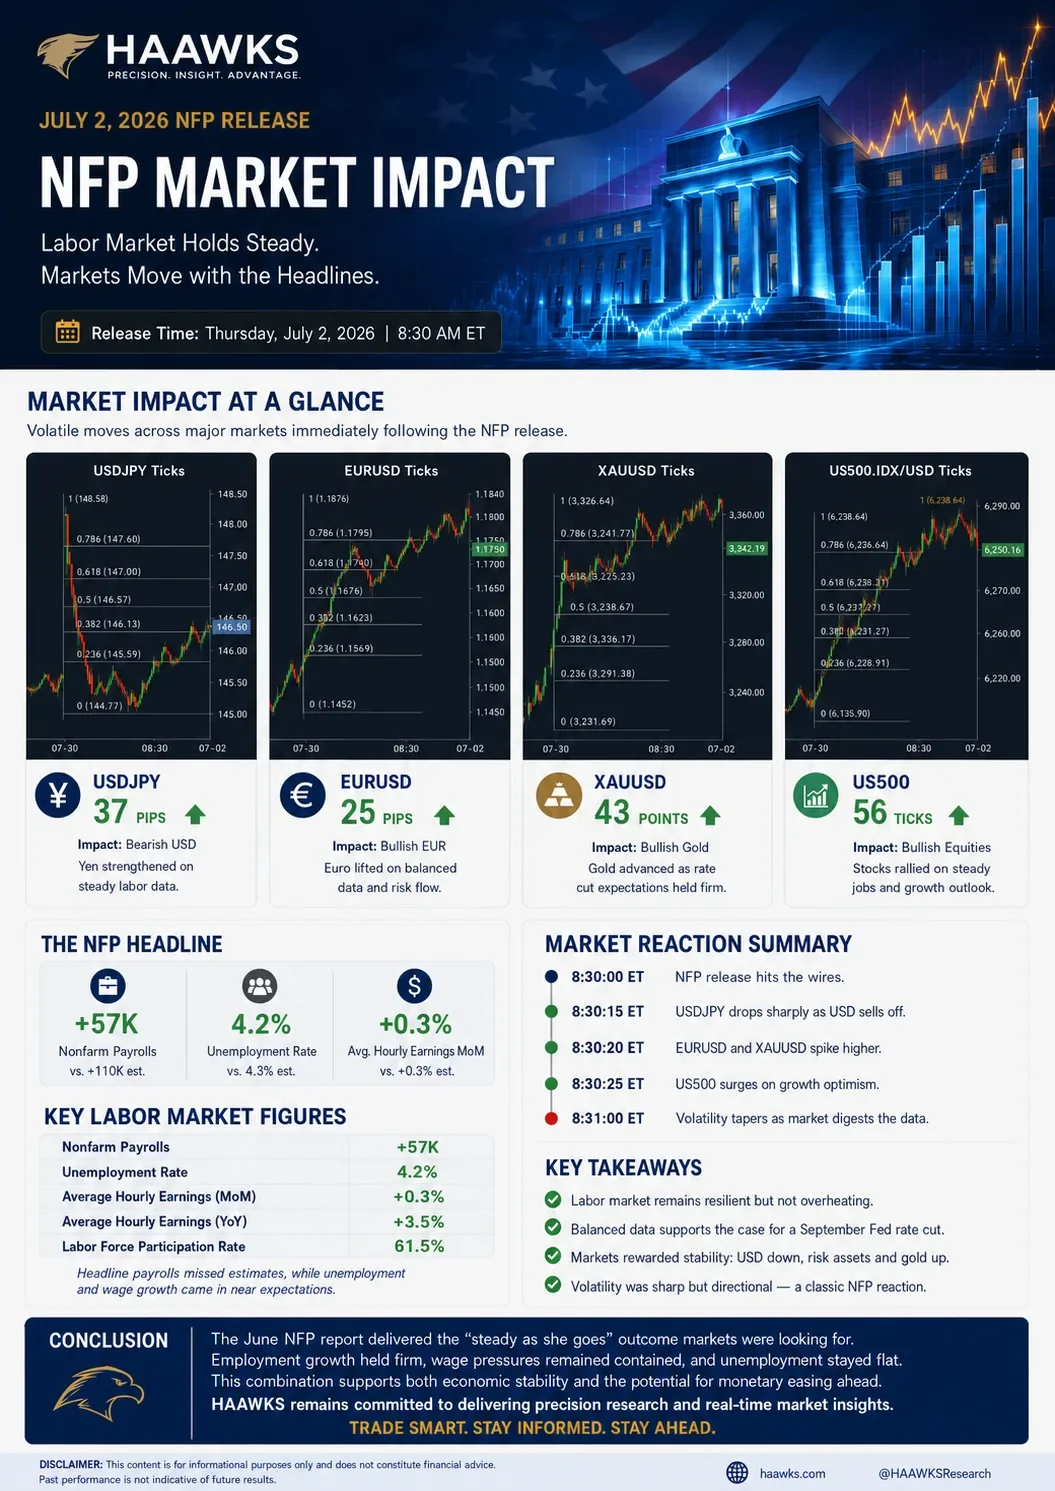
The June 2026 U.S. Nonfarm Payrolls release delivered a classic “soft but not broken” labor-market signal. Payroll growth slowed materially, but unemployment remained low and wage growth stayed contained. For markets, that combination was enough to trigger immediate volatility across FX, gold, and equity index futures.
The Bureau of Labor Statistics reported that total nonfarm payroll employment rose by 57,000 in June, while the unemployment rate stood at 4.2%. Average hourly earnings increased 0.3% month over month and 3.5% year over year. The prior two months were also revised lower by a combined 74,000 jobs, with April revised to +148,000 and May revised to +129,000.
Research Estimates vs. Actual Release
Ahead of the release, market expectations were for a stronger labor print. Consensus estimates pointed to nonfarm payrolls rising by roughly 110,000, unemployment near 4.3%, and average hourly earnings increasing 0.3% month over month.
The actual release came in softer on headline job creation, but broadly stable on unemployment and wages.
| Indicator | Estimate | Actual | HAAWKS Read-through |
|---|---|---|---|
| Nonfarm Payrolls | +110K | +57K | Clear downside miss. Headline job creation came in softer than expected. |
| Unemployment Rate | 4.3% | 4.2% | Better than expected, though the participation-rate decline softened the signal. |
| Average Hourly Earnings MoM | +0.3% | +0.3% | In line. Wage growth remained contained. |
| Average Hourly Earnings YoY | +3.5% | +3.5% | In line. No upside wage shock. |
| Prior-Month Revisions | — | -74K | April and May were revised lower, pointing to softer labor momentum than previously reported. |
The headline payroll miss was the main surprise. However, wage growth did not accelerate, unemployment remained low, and the report avoided the kind of broad deterioration that would suggest an immediate labor-market break.
Market Impact: HAAWKS Tick-Chart Reaction
The HAAWKS market-impact screenshots captured the immediate release-window volatility:
| Market | Measured Impact | Direction | HAAWKS Interpretation |
|---|---|---|---|
| USD/JPY | 37 pips | Lower | The U.S. dollar sold off sharply against the yen after the softer payroll print. |
| EUR/USD | 25 pips | Higher | The euro rallied as dollar weakness spread across major FX pairs. |
| XAU/USD | 43 points | Higher | Gold rallied as traders repriced rate expectations following the weaker jobs number. |
| US500 | 56 ticks | Higher | Equities initially caught a bid as slower job growth supported the soft-landing narrative. |
The market reaction was consistent with a softer-than-expected labor report. The U.S. dollar weakened, gold rallied, and equities reacted positively to the possibility that slower job growth could reduce pressure on the Federal Reserve to keep policy restrictive for longer.
Sector Detail: Slower Hiring, Not a Full Breakdown
The report showed continued job gains in professional and business services, social assistance, and health care, while leisure and hospitality lost 61,000 jobs. That divergence matters. It suggests the labor market is not uniformly weak, but momentum is becoming narrower.
The downward revisions were also important. A one-month payroll miss can be dismissed as noise; a miss combined with negative revisions tells a more cautious story. The labor market still appears functional, but the pace of hiring is clearly cooling.
HAAWKS Conclusion
The June NFP release was not a recession signal, but it was a warning that the labor market is losing speed.
For traders, the key takeaway was not simply that payrolls missed. It was the combination of:
Soft job creation, stable wages, lower unemployment, and negative revisions.
That mix created a “Goldilocks” reaction in markets: weak enough to pressure the dollar and support rate-sensitive assets, but not weak enough to trigger immediate risk-off panic.
| Asset Class | Reaction | Why It Moved | Trading Takeaway |
|---|---|---|---|
| FX | Dollar weaker | The headline payroll miss reduced near-term support for the U.S. dollar. | USD vulnerability remained the cleanest immediate signal. |
| Gold | Gold stronger | Softer labor data supported lower-rate sensitivity and demand for precious metals. | XAU/USD remained supported while rate-cut expectations held firm. |
| Equities | Risk initially bid | Stable wages and softer hiring helped support the soft-landing view. | US500 strength reflected relief rather than a broad growth acceleration signal. |
| Rates Narrative | Dovish lean | The report was soft enough to support easing expectations, but not weak enough to trigger panic. | The market reaction fit a classic “Goldilocks” setup. |
The HAAWKS read:
USD vulnerability remains the cleanest short-term signal, while gold and equity indices may continue to benefit if incoming data supports the view that inflation pressure is easing without a sharp employment shock.
Final Takeaway
The June 2026 NFP report reinforced a market theme that traders cannot ignore:
Labor momentum is cooling, wage pressure is stable, and markets are increasingly sensitive to every data point that affects the Fed path.
For HAAWKS traders, the opportunity is not just in the headline number. It is in understanding how that number moves liquidity, volatility, and cross-asset positioning in real time.
Trade smart. Stay informed. Stay ahead.
Disclaimer: This blog post is for informational purposes only and should not be construed as financial advice. Always conduct thorough research and consider seeking advice from a financial professional before making any investment decisions.
Sources
-
U.S. Bureau of Labor Statistics — Employment Situation Summary, June 2026
Used for the official NFP release figures, including +57K nonfarm payrolls, 4.2% unemployment, +0.3% monthly wage growth, +3.5% annual wage growth, labor-force participation, sector detail, and prior-month revisions. -
Reuters — U.S. job growth likely cooled in June after recent string of big gains
Used for pre-release market expectations, including the +110K nonfarm payroll estimate and 4.3% unemployment forecast. -
Reuters — Nasdaq, S&P 500 decline with tech; investors assess softer jobs data
Used for equity-market context following the softer-than-expected jobs report. -
Reuters — Dollar slides after soft jobs report, yen surges
Used for U.S. dollar and yen market reaction after the NFP release. -
Reuters — Gold gains after weak U.S. payrolls report
Used for gold-market reaction and rate-expectation context after the payroll miss. -
HAAWKS internal tick-chart screenshots, captured July 2, 2026.
Used for measured release-window market impact: USD/JPY 37 pips, EUR/USD 25 pips, XAU/USD 43 points, and US500 56 ticks.
Start forex fx futures news trading with Haawks G4A low latency machine-readable data today, one of the fastest news data feeds for US macro-economic and commodity data.
Please let us know your feedback. If you are interested in timestamps, please send us an email to sales@haawks.com.