
According to our analysis, the 15 October 2026 DOE Weekly Natural Gas Storage Report (WNGSR) generated an immediate 37-tick move in natural gas.
Natural gas (37 ticks)
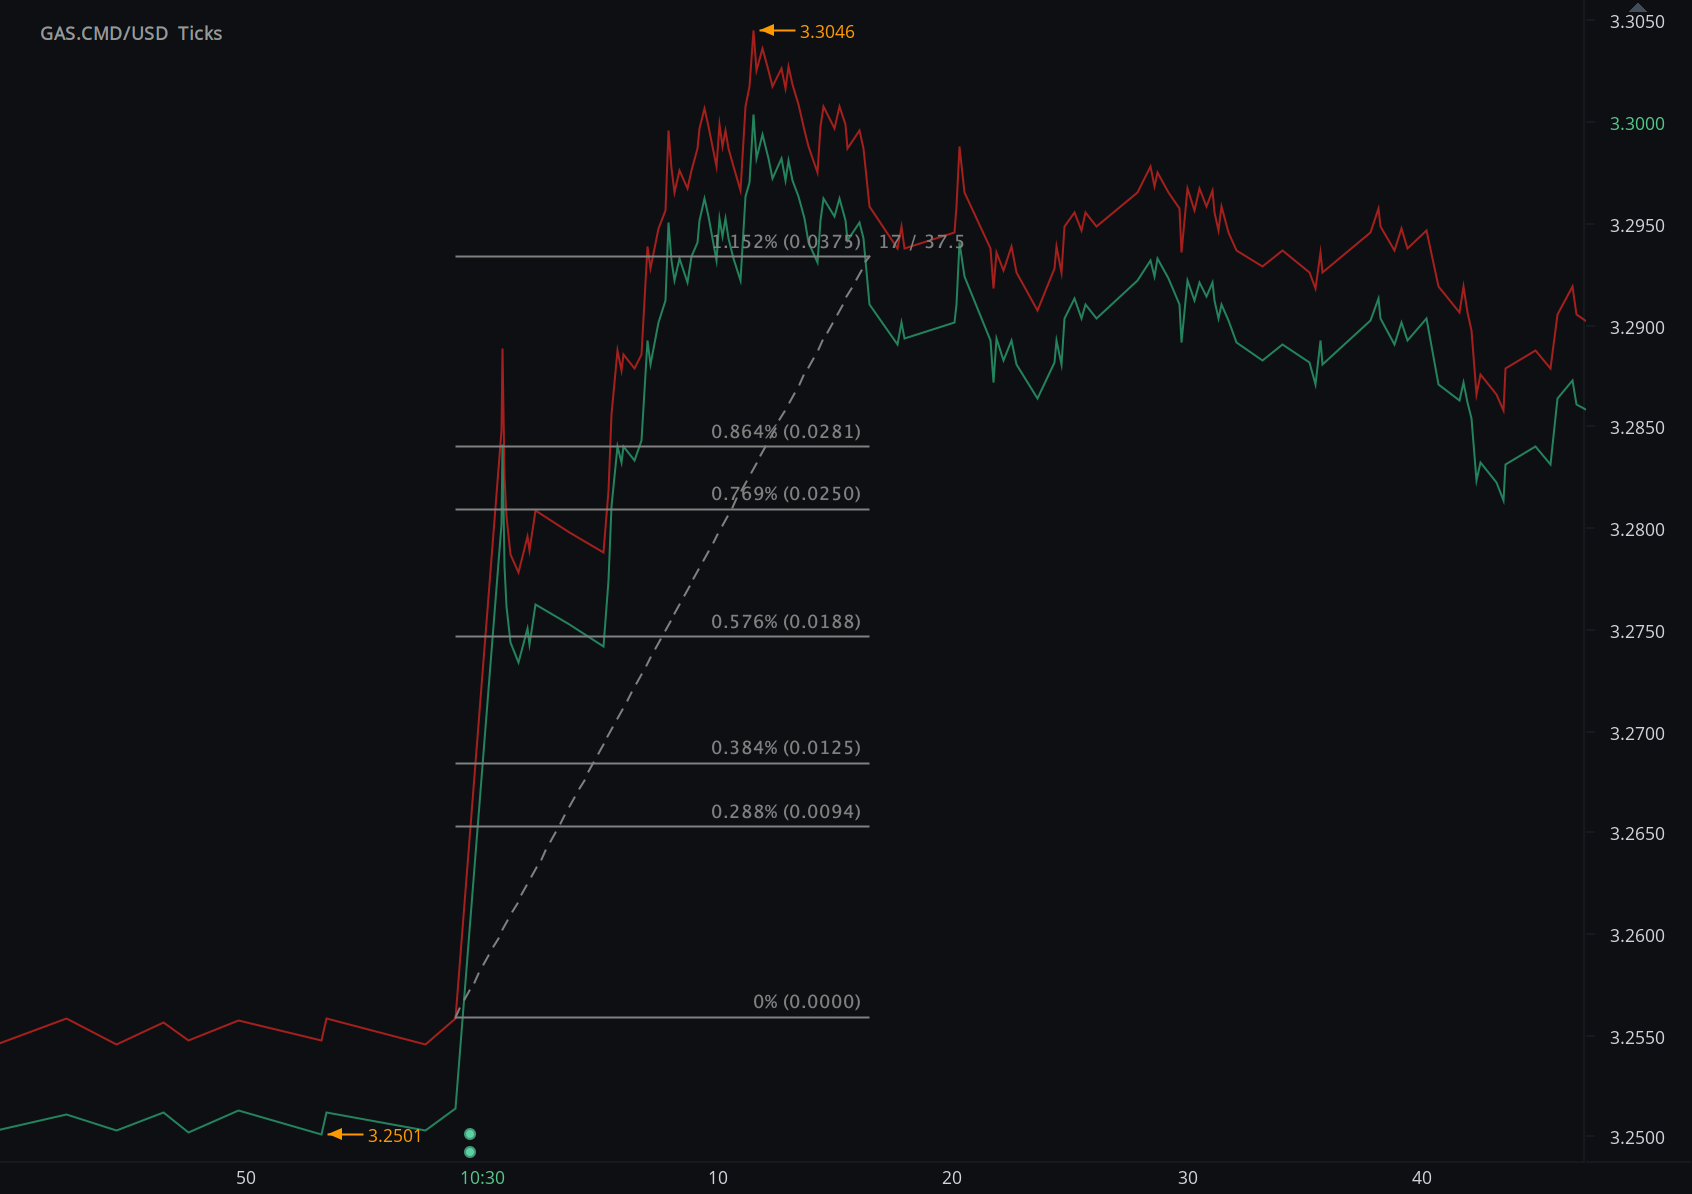
Charts are exported from JForex (Dukascopy).
EIA Natural Gas Storage: Prices Jump 37 Ticks on Smaller-Than-Expected 67 Bcf Build
U.S. working natural-gas inventories increased less than expected in the week ending October 9, narrowing the storage surplus to the five-year average and triggering an immediate upward repricing.
The U.S. Energy Information Administration reported a 67 billion cubic foot injection into underground natural-gas storage for the week ending October 9, 2026.
The increase was materially smaller than pre-release expectations. A Wall Street Journal survey placed the analyst average at approximately 75 Bcf, while AEGIS reported a median estimate of 74 Bcf.
The smaller-than-expected build reduced the cushion between current inventories and the five-year seasonal average, providing a tighter storage signal as the market approached the end of the traditional injection season.
October 15 Storage Report at a Glance
Immediate Natural-Gas Market Response
Release-Window Movement
+37 TicksHAAWKS measured a rapid upward repricing in natural gas following the 10:30 a.m. ET publication.
The direction of the move was consistent with a storage injection that came in below market expectations and below the normal seasonal build.
The attached HAAWKS tick-level chart shows the repricing beginning immediately after publication, with prices accelerating higher as the market incorporated the smaller inventory build.
The distinction between the immediate release response and the broader trading session is important. The HAAWKS measurement isolates the first market adjustment around publication rather than the full day's change.
Actual vs. Expectations
| Measure | Reference | October 15 Result | Interpretation |
|---|---|---|---|
| Weekly Storage Change | WSJ survey: +75 Bcf | +67 Bcf | Approximately 8 Bcf below the cited survey average |
| AEGIS Median | +74 Bcf | +67 Bcf | 7 Bcf below the reported median |
| Previous Week | +85 Bcf | +67 Bcf | Weekly injection slowed by 18 Bcf |
| Five-Year Weekly Average | Approximately +90 Bcf | +67 Bcf | Injection was materially below seasonal norms |
HAAWKS view: the principal information surprise was not that inventories increased, but that they increased considerably less than anticipated. For storage-sensitive markets, the relevant signal is the deviation from expectations and seasonal norms rather than the sign of the weekly change alone.
Storage Surplus Narrows Further
Total Lower 48 working gas reached 3,567 Bcf, up from 3,500 Bcf one week earlier.
Despite the weekly injection, inventories remained 143 Bcf below the year-earlier level of 3,710 Bcf, equivalent to a year-on-year deficit of approximately 3.9%.
Relative to the five-year average, storage remained modestly elevated. The EIA reported a five-year average of 3,522 Bcf, leaving current inventories 45 Bcf, or 1.3%, above normal.
That surplus had been 68 Bcf one week earlier. The October 15 report therefore continued the recent erosion of the storage cushion.
Regional Storage Flows
The national 67 Bcf injection was not evenly distributed across storage regions.
| Region | October 9 Stocks | Weekly Change | vs. Five-Year Average |
|---|---|---|---|
| East | 884 Bcf | +22 Bcf | +3.3% |
| Midwest | 1,037 Bcf | +27 Bcf | +2.0% |
| Mountain | 255 Bcf | +2 Bcf | +5.4% |
| Pacific | 294 Bcf | −5 Bcf | +6.5% |
| South Central | 1,097 Bcf | +21 Bcf | −3.1% |
Within the South Central region, salt facilities added 9 Bcf while nonsalt facilities added 12 Bcf.
South Central stocks remained below their five-year average, while the East, Midwest, Mountain and Pacific regions remained above their respective seasonal norms.
Why a 67 Bcf Injection Was Supportive
Weekly natural-gas storage data are inherently relative. An injection increases inventories in absolute terms, but that does not automatically make the release bearish.
Expectation Gap
The 67 Bcf build was roughly 7–8 Bcf below the principal consensus measures reviewed by HAAWKS.
Seasonal Comparison
The build was also considerably smaller than the approximately 90 Bcf five-year average for the corresponding week.
Shrinking Surplus
The inventory surplus to the five-year average declined to only 45 Bcf as the market moved closer to winter.
Year-on-Year Deficit
Inventories remained 143 Bcf below the corresponding year-earlier level despite continued injections.
Implications for Real-Time Market Intelligence
The Actual Number Is Only the First Field
A machine-readable feed that distributes only the 67 Bcf headline does not capture the complete information set.
Real-time interpretation also benefits from the consensus estimate, previous week's change, regional composition, five-year comparison and year-on-year storage position.
Consensus Sources Can Differ
The Wall Street Journal survey indicated approximately 75 Bcf, while AEGIS reported a 74 Bcf median. Other market calendars cited figures around 76 Bcf.
For systematic research, the specific consensus source should therefore be preserved alongside the official release rather than treated as a universal value.
Seasonality Is Part of the Signal
Storage data require comparison with normal seasonal behavior. A 67 Bcf injection in October carries different information content from the same injection during another part of the refill season.
Regional Composition Matters
Aggregate Lower 48 inventories can conceal materially different regional conditions. The South Central region remained below its five-year average even while national stocks remained modestly above normal.
Precise Release Timing Matters
The report was published at 10:30 a.m. ET. The HAAWKS analysis focuses on the immediate market response around that scheduled publication timestamp.
Release-Window Analysis
HAAWKS measured approximately 37 ticks of upward natural-gas movement following the storage report.
The price response was consistent with a tighter-than-expected storage outcome, but the measurement should be distinguished from a claim that the report alone explains every subsequent market move.
After the initial repricing, natural-gas prices can respond to production, weather forecasts, LNG feedgas demand, pipeline flows, broader energy-market conditions, positioning and liquidity.
Market-intelligence takeaway: the October 15 release demonstrates why storage data are best processed as a multidimensional information set. The actual injection, consensus deviation, seasonal benchmark, regional composition and inventory trajectory all contribute to the information absorbed during the first seconds after publication.
HAAWKS Conclusion
The October 15 EIA Weekly Natural Gas Storage Report showed a 67 Bcf injection for the week ending October 9.
The result was below the approximately 74–75 Bcf consensus measures reviewed by HAAWKS and materially below the seasonal five-year average build.
Total working gas increased to 3,567 Bcf. Stocks remained 45 Bcf above the five-year average but were 143 Bcf below the corresponding level one year earlier.
HAAWKS measured natural gas approximately 37 ticks higher in the immediate release window.
The event reinforces the importance of combining low-latency official data with consensus expectations, historical comparisons and field-level storage detail when evaluating scheduled energy-market releases in real time.
Real-Time Data. Structured Intelligence. Professional Markets.
Low-Latency Energy and Macroeconomic Data
HAAWKS G4A delivers low-latency, machine-readable macroeconomic and commodity data covering the United States, Canada and Europe.
The feed supports systematic strategies, professional trading desks and latency-sensitive applications requiring field-level data as official releases become public.
API infrastructure is available in Chicago, New York and London. Free trials are available for qualified financial institutions.
Explore HAAWKS G4ASources
-
U.S. Energy Information Administration —
Weekly Natural Gas Storage Report
Official source for the October 15, 2026 storage report, Lower 48 inventories, regional flows and historical comparisons. -
The Wall Street Journal — U.S. Natural Gas Futures and
Storage Expectations
Source for the approximately 75 Bcf analyst survey and seasonal weekly comparison. -
AEGIS Market Insights — Weekly Gas Statistics,
October 15, 2026
Source for the 74 Bcf median estimate and cited analyst range. -
HAAWKS internal tick-level market analysis —
October 15, 2026
Source for the measured immediate natural-gas +37 tick release-window movement.
Built for speed-sensitive market participants. HAAWKS G4A delivers low-latency, machine-readable macroeconomic and commodity data through API infrastructure in Chicago, New York and London. Explore the feed, share your feedback, or contact us to request a free trial for qualified financial institutions.
