According to our analysis natural gas moved 23 ticks on DOE Natural Gas Storage Report data on 9 May 2024.
Natural gas (23 ticks)
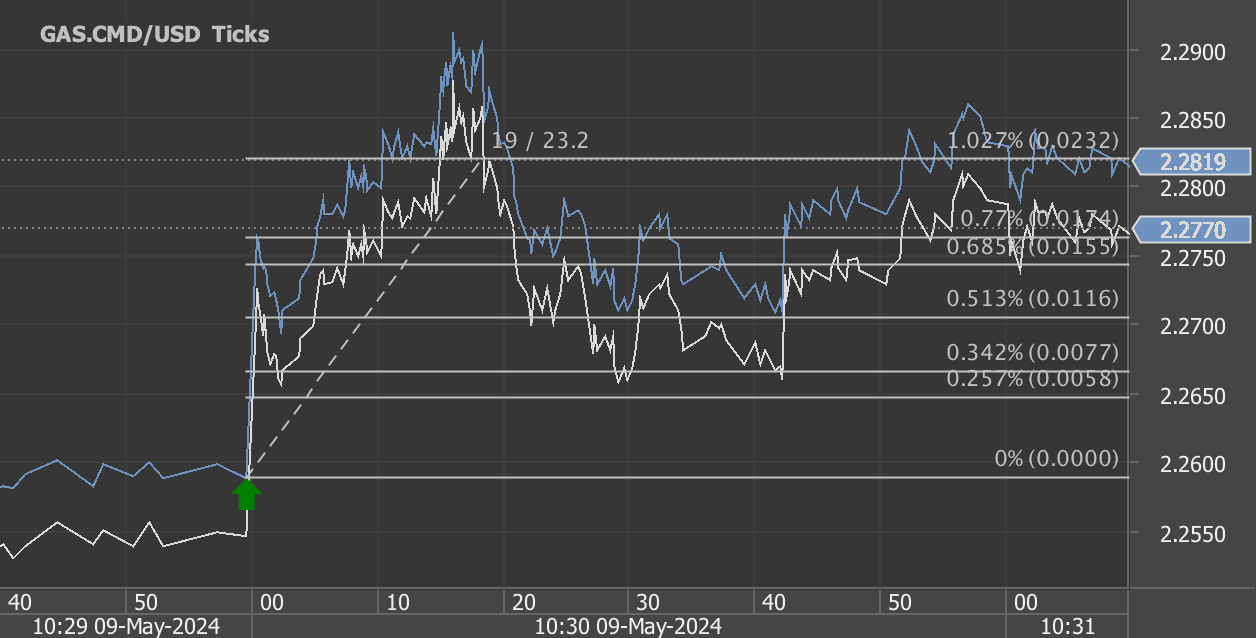
Charts are exported from JForex (Dukascopy).
U.S. Natural Gas Storage Update: Significant Stock Increases
As of May 3, 2024, the United States has seen a notable increase in its natural gas storage, according to the latest Weekly Natural Gas Storage Report released by the Energy Information Administration (EIA). The report, which provides an insightful snapshot into the nation's energy reserves, highlights a substantial storage volume of 2,563 billion cubic feet (Bcf). This represents a significant weekly increase of 79 Bcf, underscoring a robust addition to the nation's energy reserves.
Regional Breakdown and Historical Comparisons
The storage levels vary significantly across different regions:
East: The Eastern region now holds 454 Bcf, marking a substantial weekly increase of 29 Bcf. This volume is notably higher than the previous year's 419 Bcf and surpasses the five-year average of 351 Bcf by a remarkable 29.3%.
Midwest: This region shows a robust increase, with current stocks at 584 Bcf compared to 492 Bcf a year ago—an 18.7% increase. The figure also exceeds the five-year average by 37.7%.
Mountain: Here, the stocks stand at 191 Bcf, up from 101 Bcf last year, showcasing a dramatic year-over-year rise of 89.1%. The volume is also well above the five-year average by 85.4%.
Pacific: Stocks have reached 246 Bcf, up from last year’s 110 Bcf, marking a striking increase of 123.6% above the prior year and 35.2% over the five-year average.
South Central: Totaling 1,087 Bcf, this region's stocks have risen by 14 Bcf over the week, with a notable 9.2% increase over the previous year and a 26.1% rise above the five-year average.
Specifically, within the South Central region, the nonsalt facilities saw a noteworthy increase, reflecting a broader trend of robust inventory building across various storage types.
Implications for Energy Markets
The current levels of working gas in underground storage are substantially above both last year’s figures and the five-year average. This increased stock could suggest a more secure energy landscape in the U.S. for the short term, potentially stabilizing natural gas prices and offering some buffer against supply disruptions.
Moreover, the high storage levels are likely to play a crucial role in managing seasonal demand fluctuations, especially as the country approaches the high-demand summer months. Utilities and energy providers may find some relief in these figures, as ample storage typically translates into more manageable costs for end consumers.
Looking Ahead
With the next update scheduled for May 16, 2024, market participants and analysts will be keenly watching for signs of continued stock building or any adjustments in the flow dynamics. The detailed regional data will also help in assessing the local impacts on energy markets, crucial for local distributors and consumers alike.
In conclusion, the EIA’s latest report not only reflects a positive trend in natural gas availability but also underscores the resilience and strategic management of energy resources within the U.S. As stakeholders continue to navigate through the complexities of energy supply and demand, these storage figures provide a critical data point in the broader energy discourse.
Source: https://ir.eia.gov/ngs/ngs.html
Start futures forex fx commodity news trading with Haawks G4A low latency machine-readable data, one of the fastest data feeds for DOE data.
Please let us know your feedback. If you are interested in timestamps, please send us an email to sales@haawks.com.