According to our analysis US500 moved 21 points and BTC moved 305 points on US Gross Domestic Product (GDP) data on 30 April 2025.
US500 (21 points)

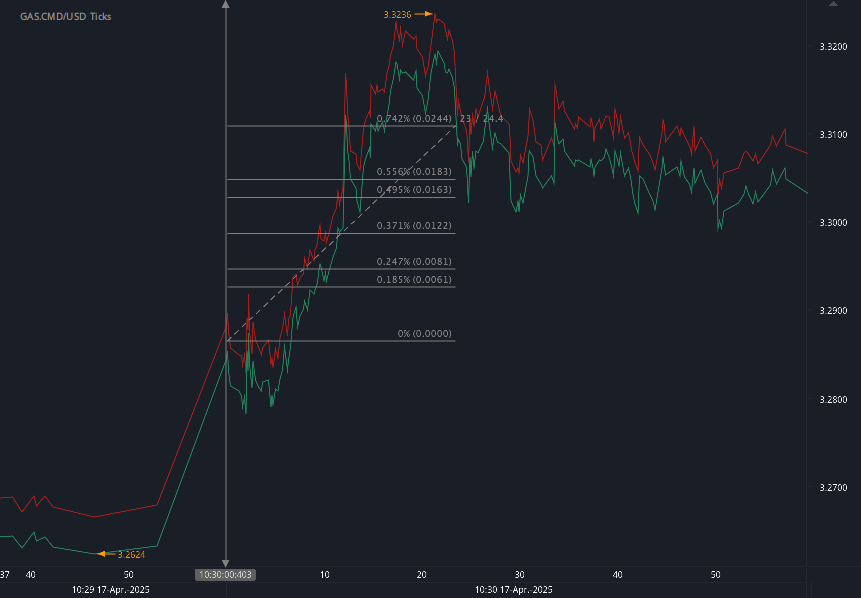
BTC (305 points)

Charts are exported from JForex (Dukascopy).
U.S. Economy Contracts Slightly in Q1 2025 Amid Rising Imports and Government Spending Cuts
Posted April 30, 2025
The U.S. economy experienced a mild contraction in the first quarter of 2025, according to the advance estimate released today by the Bureau of Economic Analysis (BEA). Real Gross Domestic Product (GDP) decreased at an annual rate of 0.3 percent from January through March, a sharp reversal from the 2.4 percent growth posted in the final quarter of 2024.
This downturn was driven primarily by a surge in imports—especially in consumer goods such as pharmaceuticals and capital goods like computer hardware—and a decline in federal government spending, notably on defense. These negative contributions were only partly offset by gains in investment, consumer spending, and exports.
A Deeper Look at the Components
Consumer Spending:
Consumer activity remained a bright spot in the economy, increasing during the quarter. Services led the charge, particularly in health care and housing-related expenditures. On the goods side, spending on nondurable goods rose, though this was partially offset by a dip in durable goods purchases.
Investment:
Private inventory investment saw notable growth, largely due to increased inventory in wholesale trade—especially drugs and sundries. This uptick played a major role in mitigating the overall GDP decline.
Imports and Exports:
The increase in imports significantly outpaced export growth, dragging down GDP. While exports did rise, they were not enough to offset the negative impact of higher imports. Notably, the BEA made an adjustment to remove a spike in silver bar imports from investment calculations, as such metals are considered valuables rather than productive assets under GDP accounting rules.
Government Spending:
Federal government expenditures decreased sharply, led by cuts in defense spending. This was partially balanced by a rise in compensation at the state and local government level, but overall, public sector spending contributed negatively to GDP.
Inflation Pressures Mount
Inflation picked up across key indicators. The gross domestic purchases price index rose 3.4 percent in Q1, compared to 2.2 percent in Q4 2024. The Personal Consumption Expenditures (PCE) price index increased 3.6 percent, with the core PCE index—excluding food and energy—rising 3.5 percent. These figures point to growing inflationary pressure, potentially shaping future monetary policy decisions.
Underlying Strength in Private Demand
Despite the headline GDP contraction, underlying private demand remained strong. Real final sales to private domestic purchasers—which combines consumer spending and fixed investment—grew by 3.0 percent, slightly higher than the 2.9 percent gain in Q4. This suggests the domestic private sector remains resilient.
The Wildfire Factor
Economic disruptions from January’s wildfires in Southern California, primarily in Los Angeles County, were embedded within the broader data but not isolated in the GDP estimate. Preliminary BEA figures estimate that these fires caused $34.0 billion in damage to privately owned fixed assets and $11.0 billion in losses to state and local government infrastructure. While such destruction does not directly affect GDP, it represents a significant loss of wealth.
Looking Ahead
Today’s report is an advance estimate and subject to revision. The second estimate, which will incorporate more complete data, is scheduled for release on May 29, 2025. This will also include preliminary figures on corporate profits, offering additional insight into the underlying economic conditions as the U.S. navigates a complex mix of inflation, investment shifts, and climate-related disruptions.
Disclaimer: This blog post is for informational purposes only and should not be construed as financial advice. Always conduct thorough research and consider seeking advice from a financial professional before making any investment decisions.
Source: https://www.bea.gov/news/2025/gross-domestic-product-1st-quarter-2025-advance-estimate
Start futures forex fx news trading with Haawks G4A low latency machine-readable data, one of the fastest machine-readable news trading feeds for macro-economic and commodity data from the US and Europe.
Please let us know your feedback. If you are interested in timestamps, please send us an email to sales@haawks.com.