
Viewing entries tagged
new coverage

HAAWKS G4A Adds CES Benchmark Revision Data: What News Traders Need to Know

Comment

HAAWKS G4A Adds CES Benchmark Revision Data: What News Traders Need to Know

HAAWKS G4A Adds CES Benchmark Revision Data: What News Traders Need to Know

HAAWKS is introducing seven new machine-readable CES benchmark revision data points as research shows U.S. payroll benchmark revisions have become materially larger in recent years.
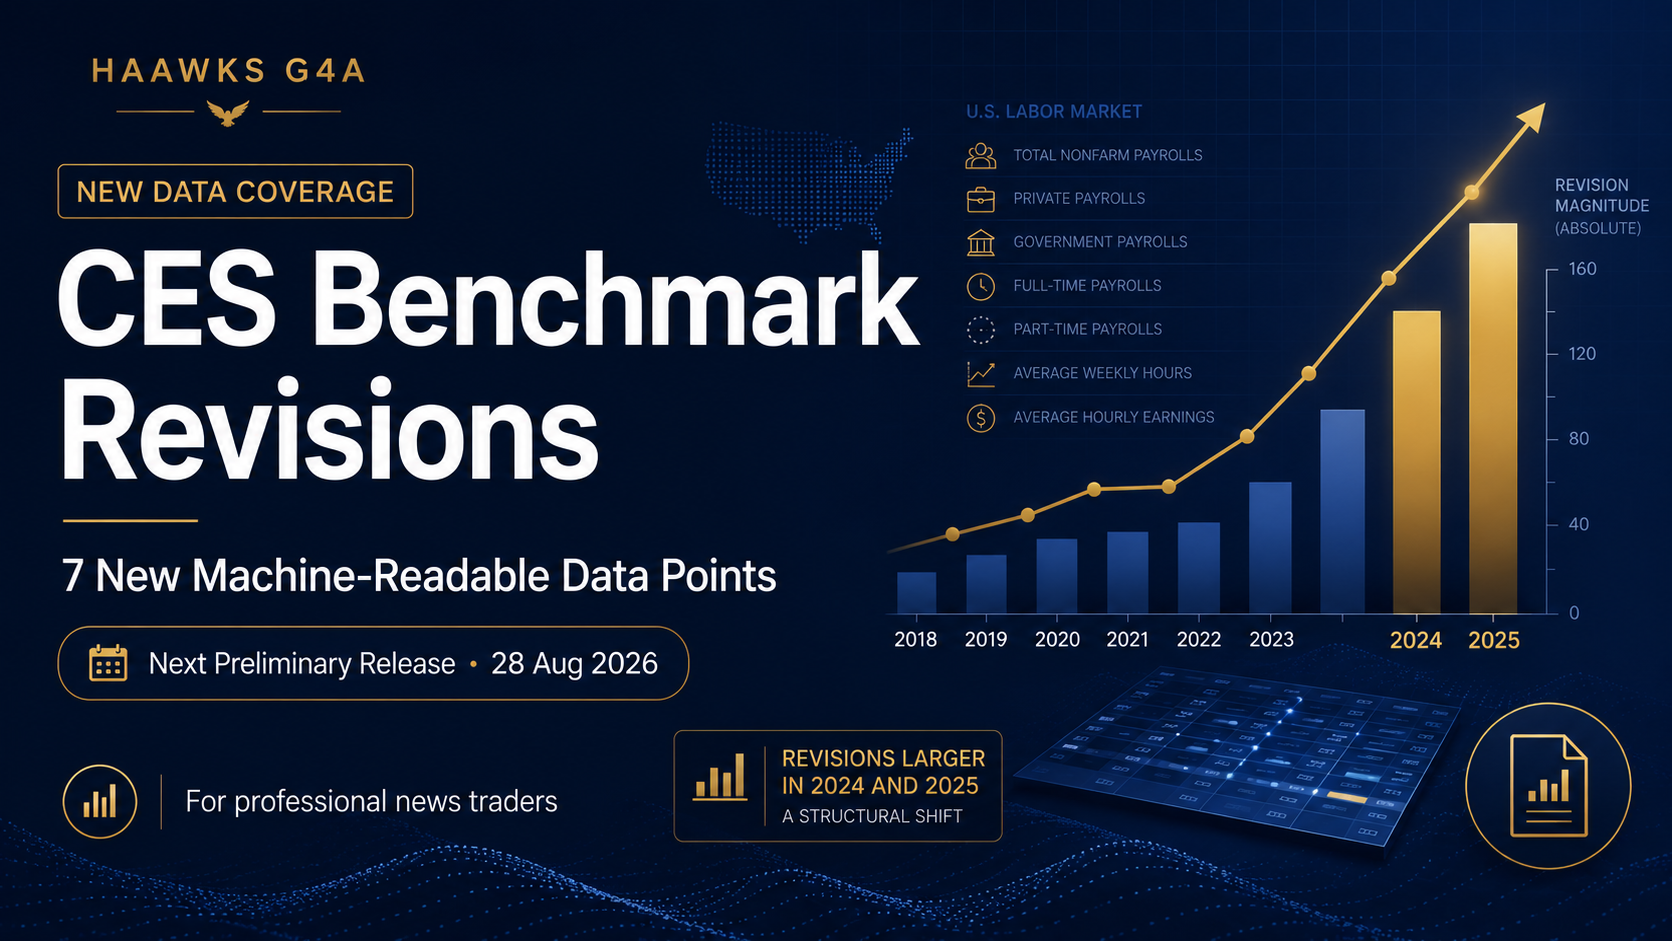
HAAWKS G4A CES benchmark revisions research showing seven new machine-readable data points and larger U.S. payroll revisions in 2024 and 2025
HAAWKS Research
New G4A Data Points

HAAWKS G4A Adds CES Benchmark Revision Data: Why Payroll Benchmark Revisions Matter to News Traders

Ahead of the August 28, 2026 preliminary CES benchmark release, HAAWKS is expanding its low-latency machine-readable U.S. labor-market coverage with seven new benchmark-revision data points.

August 2026 7 new machine-readable data points CES Benchmark Revisions

HAAWKS G4A will introduce machine-readable coverage of the Current Employment Statistics Preliminary Benchmark Revision and the subsequent CES Annual Benchmark Revision, giving professional news traders direct access to some of the most important annual revisions to U.S. payroll employment data.

Most news traders know the monthly Nonfarm Payrolls release. Fewer focus on the annual benchmark process that determines how closely the sample-based Current Employment Statistics estimates match more comprehensive employment counts.

That benchmark process has become increasingly relevant. HAAWKS research covering the 2016–2025 preliminary benchmark revisions shows that the magnitude of the revisions has increased materially in recent years, particularly in 2024 and 2025.

Next release: BLS is scheduled to publish the March 2026 CES Preliminary Benchmark Revision on Friday, August 28, 2026 at 10:00 a.m. ET. The preliminary announcement does not immediately revise the official monthly CES employment series.

Seven New HAAWKS G4A Data Points

HAAWKS will initially disseminate two machine-readable fields from the preliminary benchmark release and five fields from the annual benchmark revision.

CES Preliminary Benchmark Revision Next release: August 28, 2026 — 10:00 a.m. ET
2 New Data Points
  • Total nonfarm employment benchmark revision, March of the current year, not seasonally adjusted, thousands.
  • Total private employment benchmark revision, March of the current year, not seasonally adjusted, thousands.
CES Annual Benchmark Revision Next release: February 2027 — exact BLS date pending
5 New Data Points
  • Total nonfarm employment benchmark revision, March of the prior year, not seasonally adjusted, thousands.
  • Total private employment benchmark revision, March of the prior year, not seasonally adjusted, thousands.
  • Total nonfarm employment annual revision, March of the prior year, seasonally adjusted, thousands.
  • Total private employment annual revision, March of the prior year, seasonally adjusted, thousands.
  • Total nonfarm employment annual revision, December of the prior year, seasonally adjusted, thousands, observation status preliminary.

BLS has confirmed that the final March 2026 benchmark revision will be incorporated with the January 2027 Employment Situation release in February 2027. The exact release date has not yet been published on the official BLS calendar.

What Is a CES Benchmark Revision?

The monthly Current Employment Statistics survey estimates payroll employment from a sample of businesses and government agencies. Each year, those estimates are benchmarked against more comprehensive employment counts from the Quarterly Census of Employment and Wages, or QCEW.

QCEW counts are derived primarily from state unemployment-insurance tax records that nearly all employers are required to file. BLS defines the benchmark revision as the difference between the March universe count and the corresponding sample-based CES employment estimate, after accounting for changes in employment scope.

Important for news traders: a preliminary benchmark revision is not the same thing as a monthly NFP revision and it is not a direct estimate of how many jobs were created during the year. It is a revision to the estimated March employment level.

Preliminary Does Not Mean the Monthly Series Changes Immediately

The August preliminary release provides an early estimate of the benchmark difference, but BLS does not immediately rewrite the official CES monthly employment series using that number.

The benchmark is incorporated later as part of the annual benchmark process. This distinction is particularly important for automated news trading systems: the preliminary benchmark is new information about the estimated employment level, while the later annual release actually incorporates benchmark and seasonal-adjustment changes into the historical CES series.

The 2025 benchmark provides a useful example. In September 2025, BLS estimated a preliminary total nonfarm revision of −911,000 jobs, or −0.6%, for March 2025. When the annual benchmark was incorporated in February 2026, the final not-seasonally-adjusted March revision was −862,000, or −0.5%. The seasonally adjusted March employment level was revised by −898,000.

In other words, the preliminary release can provide a powerful signal, but news traders also need to distinguish it from the later official benchmarked series.

HAAWKS Research: Preliminary Revisions 2016–2025

HAAWKS reviewed 10 years of national preliminary CES benchmark revisions. Negative figures indicate that the previously published CES employment level was above the preliminary benchmark estimate.

Benchmark Year Total Nonfarm Revision Total Nonfarm % Total Private Revision Total Private %
2016 −150K −0.1% −224K −0.2%
2017 +95K +0.1% +98K +0.1%
2018 +43K <+0.05% −17K <−0.05%
2019 −501K −0.3% −514K −0.4%
2020 −173K −0.1% −229K −0.2%
2021 −166K −0.1% −421K −0.3%
2022 +462K +0.3% +571K +0.4%
2023 −306K −0.2% −358K −0.3%
2024 −818K −0.5% −819K −0.6%
2025 −911K −0.6% −880K −0.7%

The two largest preliminary revisions in the 10-year sample occurred in 2024 and 2025 for both total nonfarm and total private employment.

Revision Magnitudes Have Increased Recently

Nonfarm Mean Absolute Revision 2016–2020 0.12% First five-year window
Nonfarm Mean Absolute Revision 2021–2025 0.34% 2.83× the prior window
Private Mean Absolute Revision 2016–2020 0.18% First five-year window
Private Mean Absolute Revision 2021–2025 0.46% 2.56× the prior window
Statistic, 2016–2025 Total Nonfarm Total Private
Mean Signed Revision −0.15% −0.22%
Mean Absolute Revision 0.23% 0.32%
Median Absolute Revision 0.15% 0.30%
Sample Standard Deviation 0.27 percentage points 0.33 percentage points
Mean Absolute Revision, 2016–2020 0.12% 0.18%
Mean Absolute Revision, 2021–2025 0.34% 0.46%
Increase Between Five-Year Windows 2.83× 2.56×
Largest Absolute Revision 0.6% — 2025 0.7% — 2025
Second Largest 0.5% — 2024 0.6% — 2024

Is the Increase Statistically Significant?

HAAWKS also tested whether the absolute size of preliminary revisions has been trending upward over the full 2016–2025 period.

Simple Linear Trend Total Nonfarm Total Private
Increase Per Year +0.050 percentage points +0.058 percentage points
0.61 0.67
p-value 0.007 0.004
95% Confidence Interval +0.018 to +0.083 points/year +0.025 to +0.091 points/year

On the complete 10-year sample, the upward trend in absolute revision size is statistically detectable.

However, there is an important qualification: the result is heavily influenced by the exceptionally large revisions in 2024 and 2025. Removing those two years causes the trend to lose conventional statistical significance.

Excluding 2024 and 2025: the trend-test p-value rises to 0.217 for total nonfarm and 0.115 for total private. The evidence therefore supports a recent increase in revision magnitude rather than a smooth, firmly established long-term trend.

Direction of the Revisions

Total Nonfarm

Seven of the 10 preliminary benchmark years were negative, two were positive and one was effectively near zero in percentage terms. The last three observations — 2023, 2024 and 2025 — were all negative.

Total Private

Eight of the 10 revisions were negative, including the very small −17,000 revision in 2018, while only 2017 and 2022 were positive. The largest negative percentage revision was −0.7% in 2025.

Why Benchmark Revisions Matter to News Traders

They Can Change the Employment Narrative

A large negative benchmark estimate can indicate that previously published payroll employment levels overstated the underlying employment count, potentially changing how traders assess labor market momentum.

They Can Affect Fed Expectations

Labor-market strength is a major input into monetary-policy expectations. A materially different benchmark can therefore affect the market's interpretation of the employment outlook and the expected path of interest rates.

The Preliminary Release Is a Separate Event

The August preliminary benchmark is released independently from the normal 8:30 a.m. monthly NFP release. For 2026, the national preliminary benchmark is scheduled for 10:00 a.m. ET on August 28.

The Annual Release Arrives With NFP

The final annual benchmark is incorporated with the January Employment Situation in February. News-trading systems therefore need to distinguish current-month payroll data from benchmark and historical-revision fields arriving in the same release.

HAAWKS view: benchmark data deserve their own structured fields. A large benchmark revision can change the historical employment picture even when the current monthly NFP headline receives most of the attention. For low-latency news traders, identifying the exact field, observation period, seasonal-adjustment status and preliminary or final status is essential.

Preliminary vs. Annual Benchmark: What Traders Need to Distinguish

Feature Preliminary Benchmark Annual / Final Benchmark
Typical Timing Late August / early September February with January Employment Situation
Key Reference Month March March, plus revised historical monthly series
Preliminary Release Updates Official CES Series? No Yes
HAAWKS Initial Coverage 2 machine-readable fields 5 machine-readable fields
News-Trading Focus Size and direction of the preliminary benchmark difference Final benchmark plus revised seasonally adjusted employment levels

HAAWKS Conclusion

HAAWKS is adding seven machine-readable CES benchmark-revision data points to expand G4A coverage of the U.S. labor market beyond the standard monthly Nonfarm Payrolls release.

Two fields will cover the annual CES Preliminary Benchmark Revision, beginning with the March 2026 benchmark scheduled for August 28, 2026 at 10:00 a.m. ET.

Five additional fields will cover the subsequent CES Annual Benchmark Revision, including March benchmark revisions and seasonally adjusted March and December employment revisions.

The historical evidence explains why these numbers deserve attention. From 2016–2020, the average absolute preliminary total-nonfarm revision was only 0.12%. In 2021–2025, it increased to 0.34%. For total private employment, the corresponding increase was from 0.18% to 0.46%.

The 2024 and 2025 revisions were unusually large, so the evidence should not be interpreted as proof that revisions will continue increasing each year. It does, however, demonstrate that benchmark releases can contain economically significant information and should not be overlooked by professional news traders.

For latency-sensitive strategies, the challenge is not merely receiving the release quickly. It is receiving each data point with the correct reference period, seasonal-adjustment status, units and observation status in a structured format that can be processed immediately.

Trade smart. Stay informed. Stay ahead.

New CES Benchmark Data Coming to HAAWKS G4A

HAAWKS G4A delivers low-latency machine-readable macroeconomic and commodity data for professional news traders. The new CES benchmark fields expand our coverage of U.S. labor-market releases and will be available through the same machine-readable API infrastructure.

HAAWKS G4A data is available via API access in Chicago, New York and London. Free trials are available for qualified professionals.

Explore HAAWKS G4A Low-Latency Data

Sources & Methodology

  1. U.S. Bureau of Labor Statistics — Current Employment Statistics
    Official CES program page and current release schedule.
  2. U.S. Bureau of Labor Statistics — 2026 Release Calendar
    Confirms the March 2026 national preliminary CES benchmark release for August 28, 2026 at 10:00 a.m. ET.
  3. U.S. Bureau of Labor Statistics — Current Employment Statistics Preliminary Benchmark
    Official preliminary benchmark release, methodology and benchmark revision tables.
  4. U.S. Bureau of Labor Statistics — Technical Notes for the CES National Benchmark
    Used for benchmark definitions, historical benchmark information and methodology.
  5. U.S. Bureau of Labor Statistics — January 2026 Employment Situation
    Used for the final March 2025 benchmark revision and the annual incorporation of benchmarked CES data.
  6. U.S. Bureau of Labor Statistics — Current Employment Situation
    Confirms that the final March 2026 benchmark revision will be issued with the January 2027 Employment Situation in February 2027.
  7. HAAWKS Research — CES Preliminary Benchmark Revisions, 2016–2025
    Historical preliminary benchmark figures compiled from BLS preliminary benchmark announcements and contemporaneous archived releases. Statistical calculations use the preliminary March not-seasonally-adjusted percentage revisions. Revisions reported by BLS as less than 0.05% in absolute magnitude for 2018 were encoded as 0.0% for percentage-based statistical calculations.
Research note: CES preliminary benchmark percentages refer to revisions to the estimated March employment level and should not be interpreted as direct revisions to the number of jobs created during a calendar year. The statistical analysis is descriptive and based on a small 10-year sample. The apparent trend is heavily influenced by the 2024 and 2025 observations.

Disclaimer: This material is provided for informational and educational purposes only. It does not constitute financial advice, investment advice or a recommendation to buy or sell any financial instrument. Economic releases may cause significant volatility, wider spreads, reduced liquidity and slippage. Past market behavior is not indicative of future results.

Comment

HAAWKS Launches 40 Weekly USDA Export Sales Data Points for Agricultural Markets

Comment

HAAWKS Launches 40 Weekly USDA Export Sales Data Points for Agricultural Markets

HAAWKS Launches 40 Weekly USDA Export Sales Data Points

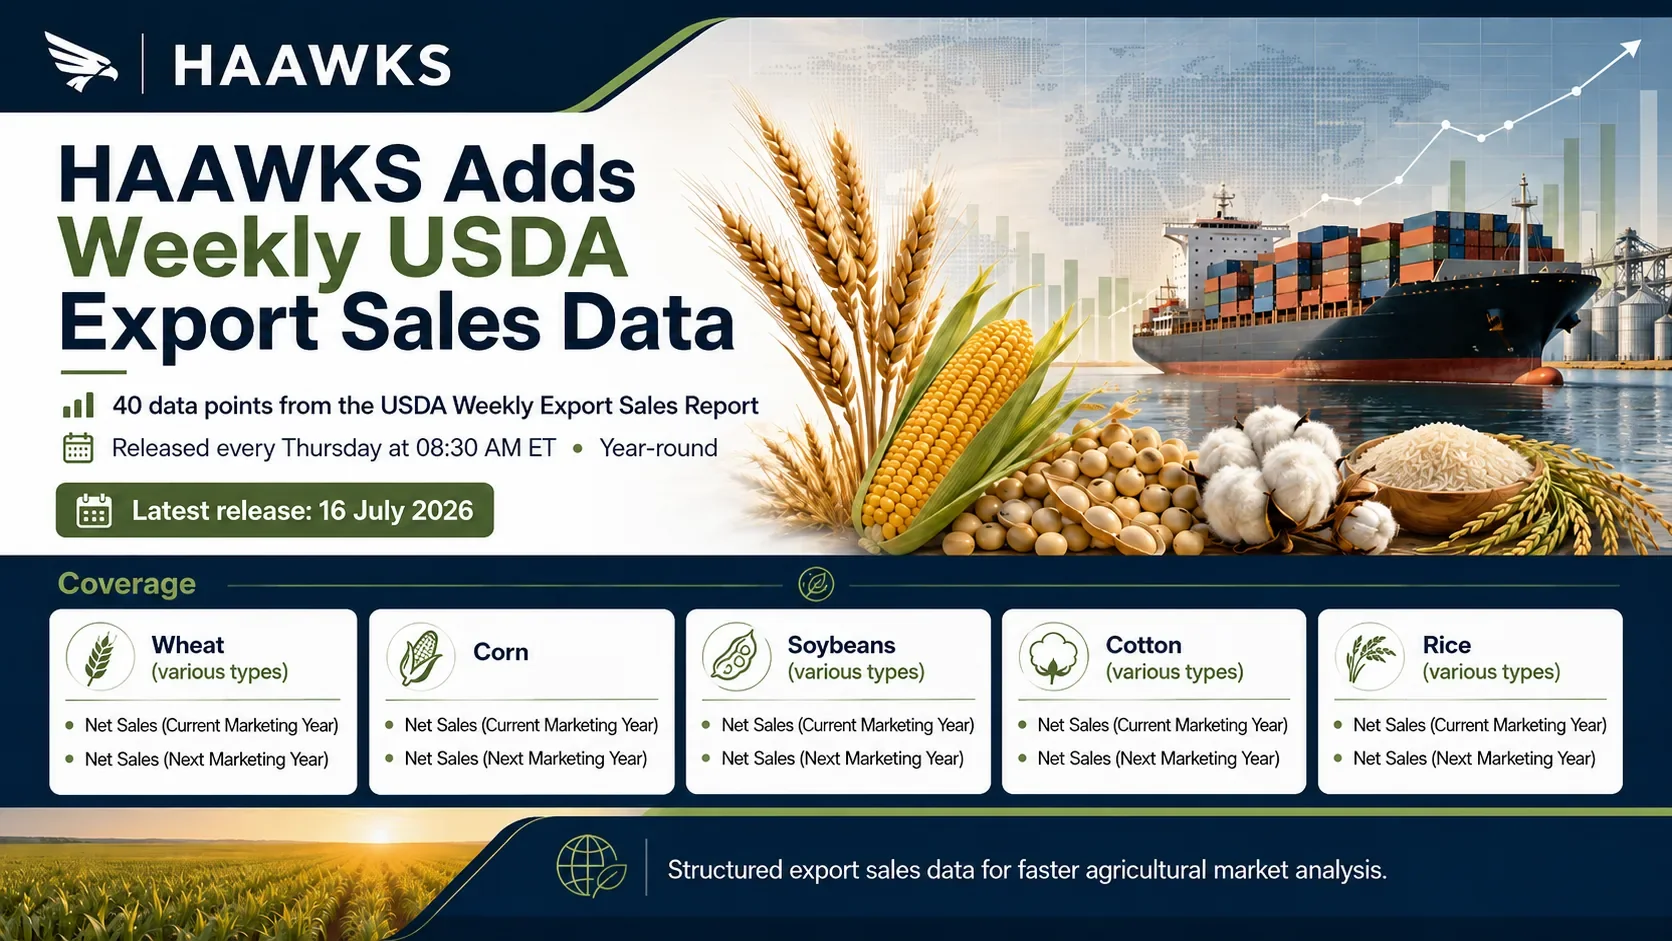
HAAWKS announcement for 40 weekly USDA Export Sales data points covering wheat, corn, soybeans, cotton, and rice.

On Thursday, July 16, 2026, HAAWKS expanded its agricultural market coverage with the launch of 40 structured data points from the USDA Weekly Export Sales Report.

Published every Thursday at 8:30 AM ET throughout the year, the report provides one of the most timely official indicators of international demand for U.S. agricultural commodities.

The new HAAWKS dataset covers weekly net export sales for wheat, corn, soybeans, cotton, and rice, with separate values for the current and next marketing years.

Unlike reports released after agricultural markets have closed, the Weekly Export Sales Report is published while the principal futures contracts are actively trading. This makes speed, accurate normalization, and machine-readable delivery especially important for algorithmic and event-driven market participants.

What HAAWKS Delivers

HAAWKS will disseminate 40 data points covering five major commodity groups and their relevant product classifications.

Commodity Data Coverage
Wheat
Various types and classes
Net sales for the current marketing year and next marketing year
Corn Net sales for the current marketing year and next marketing year
Soybeans
Various types
Net sales for the current marketing year and next marketing year
Cotton
Various types
Net sales for the current marketing year and next marketing year
Rice
Various types
Net sales for the current marketing year and next marketing year

The individual product and commodity classifications provide more detailed information than a single headline export-sales figure. This allows users to identify differences in demand across crop types, qualities, and delivery periods.

Why Weekly Export Sales Matter

The USDA Weekly Export Sales Report provides a current view of overseas demand for U.S. agricultural products.

Strong net sales may indicate improving international demand, increased forward purchasing, or progress toward USDA full-year export projections. Weak sales, cancellations, or net reductions may point to softer demand, changing destination activity, or stronger competition from other exporting countries.

However, the market does not react only to whether sales appear high or low.

The most important signal is frequently the difference between the reported value and what market participants expected before the release.

A weekly corn export-sales figure may be supportive if it exceeds expectations, but the same figure may be disappointing if traders anticipated an even larger result.

For systematic analysis, the core event signal can be expressed as:

Export-sales surprise = reported net sales − expected net sales

The size and direction of that surprise can then be assessed alongside:

  • The previous reporting week

  • Recent weekly averages

  • Seasonal export patterns

  • Outstanding export commitments

  • Reported cancellations

  • Major destination activity

  • Progress toward USDA export projections

  • Current and next marketing year allocations

Current and Next Marketing Year Sales

HAAWKS provides separate data points for the current marketing year and the next marketing year.

Current marketing year net sales represent new commitments, adjustments, and cancellations for delivery during the active marketing year. These figures are particularly relevant to near-term demand and the pace required to meet annual export forecasts.

Next marketing year net sales represent forward commitments for delivery after the current marketing year ends. They can provide an early indication of demand for the upcoming crop cycle and may become increasingly important as the current marketing year approaches its conclusion.

Separating the two periods helps traders and analysts distinguish immediate demand from longer-term purchasing activity.

It also prevents a large next-year sale from being interpreted as an equally strong signal for nearby supply and demand conditions.

What Are Net Export Sales?

Net export sales represent newly reported sales after accounting for cancellations, reductions, destination changes, and other adjustments.

A positive number generally indicates that new sales exceeded cancellations and reductions during the reporting period.

A negative number can occur when cancellations or downward adjustments are larger than newly reported sales.

Net sales are therefore not the same as physical exports or shipments. A sale represents a commitment, while an export represents the physical movement of the commodity.

For a complete demand assessment, traders may compare net sales with:

  • Physical exports

  • Outstanding sales

  • Accumulated exports

  • Destination-level activity

  • Historical seasonal patterns

  • USDA annual export forecasts

Released During Active Futures Trading

The report is published every Thursday at 8:30 AM ET while major agricultural futures markets are open.

CME grain and oilseed futures, including corn, soybeans, and wheat, continue trading until 8:45 AM ET during the overnight session. Trading then pauses before the main daytime session begins at 9:30 AM ET.

ICE Cotton No. 2 futures are also actively trading at 8:30 AM ET.

This creates two important reaction windows.

Time Market Event Relevance
8:30 AM ET USDA Weekly Export Sales Report released Immediate data ingestion and event detection
8:30–8:45 AM ET CME grain and oilseed futures remain open Initial algorithmic price discovery
8:45–9:30 AM ET CME grain and oilseed trading pause Further analysis and order preparation
9:30 AM ET CME daytime session begins Broader liquidity and potential follow-through
9:30 AM ET Regular U.S. stock and ETF trading begins Potential reaction in related listed instruments

The 15-minute period between the report release and the end of the overnight CME session is especially relevant for automated traders.

During this window, systems can ingest the new figures, compare them with expectations, identify material surprises, apply risk controls, and generate trading signals while the underlying futures remain tradable.

Directly Relevant Markets

The data is most directly relevant to futures and options linked to the commodities included in the report:

  • CBOT corn futures and options

  • CBOT soybean futures and options

  • CBOT wheat futures and options

  • KC hard red winter wheat futures and options

  • Minneapolis hard red spring wheat futures and options

  • ICE Cotton No. 2 futures and options

  • CBOT rough rice futures and options

The report may also be relevant to related commodity spreads and processing relationships, including soybean crush components and differences among wheat classes.

The strength of the market reaction depends on more than the headline figure. It can also be affected by the reporting period, destination, size of revisions or cancellations, seasonal demand, existing positioning, liquidity, and whether the result was already anticipated.

Designed for Algorithmic Trading Workflows

Many HAAWKS clients consume market news through automated or algorithmic systems rather than by manually reading and interpreting reports.

For these users, an official report published as a document or web page must first be converted into standardized fields before it can be used reliably.

HAAWKS transforms the USDA release into structured data points designed for systematic consumption.

The dataset can support workflows such as:

  • Real-time event detection

  • Automated estimate comparison

  • Surprise calculation

  • Commodity and product classification

  • Current-year and next-year separation

  • Cancellation and net-reduction detection

  • Historical event analysis

  • Quantitative model inputs

  • Automated alerts

  • Trading signal generation

  • Risk-management checks

  • Dashboard and API integration

Consistent field definitions are particularly important when the same report contains numerous commodities, product types, marketing years, destinations, and adjustments.

By normalizing the data, HAAWKS allows systems to compare each new observation with prior releases without repeatedly interpreting the underlying report structure.

From Release to Market Signal

An algorithmic workflow may process the report in several stages:

  1. Receive the structured HAAWKS data.

  2. Validate the commodity, product type, and marketing year.

  3. Compare the reported figure with the expected value.

  4. Calculate the size and direction of the surprise.

  5. Compare the result with prior weeks and historical ranges.

  6. Apply commodity-specific signal thresholds.

  7. Check liquidity, market conditions, and risk limits.

  8. Generate an alert, analytical output, or trading instruction.

Not every statistical surprise creates a meaningful price move.

A large soybean sales figure, for example, may have limited impact if it was widely expected or if it reflects a previously announced transaction. Conversely, an unexpected cancellation or net reduction may matter even when the absolute weekly figure appears relatively small.

The HAAWKS dataset provides the structured inputs needed for users to make those distinctions within their own models and strategies.

More Than a Headline Figure

The detailed structure of the Weekly Export Sales Report helps users look beyond aggregate demand.

Important questions include:

  • Which commodity or product class was sold?

  • Does the sale apply to the current or next marketing year?

  • Were previous commitments cancelled or reduced?

  • Which destinations were involved?

  • Are sales concentrated among one or several buyers?

  • How does the result compare with the pace needed to meet USDA projections?

  • Are reported commitments translating into physical exports?

  • Is one commodity class performing differently from another?

For wheat, cotton, rice, and soybeans, product-level differences can be particularly important. Strong demand for one class or type does not necessarily imply equally strong demand for the broader commodity category.

Expanding HAAWKS Agricultural Coverage

The addition of USDA Weekly Export Sales data strengthens HAAWKS’ coverage of both the demand and supply sides of agricultural markets.

USDA Crop Progress data provides insight into planting, crop development, condition, and harvest activity.

USDA Export Sales data provides insight into international demand, cancellations, and forward purchasing commitments.

Together, the datasets help users monitor how U.S. production conditions interact with global demand throughout the agricultural cycle.

By delivering official USDA information in a clean, structured, and machine-readable format, HAAWKS helps traders and analysts move more efficiently from report publication to systematic market analysis.

For algorithmic participants, that means receiving structured data while the directly relevant futures markets are still trading.

Sources

  1. USDA Foreign Agricultural Service — Export Sales Reporting Program
    Official information about the reporting program and the Thursday 8:30 AM ET release schedule.
    https://www.fas.usda.gov/programs/export-sales-reporting-program
  2. USDA Foreign Agricultural Service — Weekly Export Sales
    Official weekly reports and downloadable export-sales data.
    https://apps.fas.usda.gov/esrqs/#/reports
  3. CME Group — Corn Futures
    Contract information and trading hours for CBOT corn futures.
    https://www.cmegroup.com/markets/agriculture/grains/corn.html
  4. CME Group — Soybean Futures
    Contract information and trading hours for CBOT soybean futures.
    https://www.cmegroup.com/markets/agriculture/oilseeds/soybean.html
  5. CME Group — Chicago Wheat Futures
    Contract information and trading hours for CBOT wheat futures.
    https://www.cmegroup.com/markets/agriculture/grains/wheat.html
  6. CME Group — KC Hard Red Winter Wheat Futures
    Contract information for KC HRW wheat futures.
    https://www.cmegroup.com/markets/agriculture/grains/kc-wheat.html
  7. CME Group — Rough Rice Futures
    Contract information and trading hours for rough rice futures.
    https://www.cmegroup.com/markets/agriculture/grains/rough-rice.html
  8. ICE — Cotton No. 2 Futures
    Official contract specifications and trading hours.
    https://www.ice.com/products/254/Cotton-No-2-Futures

Disclaimer: This blog post is for informational purposes only and should not be construed as financial advice. Always conduct thorough research and consider seeking advice from a financial professional before making any investment decisions.

Comment

HAAWKS Adds Weekly USDA Crop Progress Data for Major U.S. Crops

Comment

HAAWKS Adds Weekly USDA Crop Progress Data for Major U.S. Crops

HAAWKS Expands Agricultural Coverage with Weekly USDA Crop Progress Data

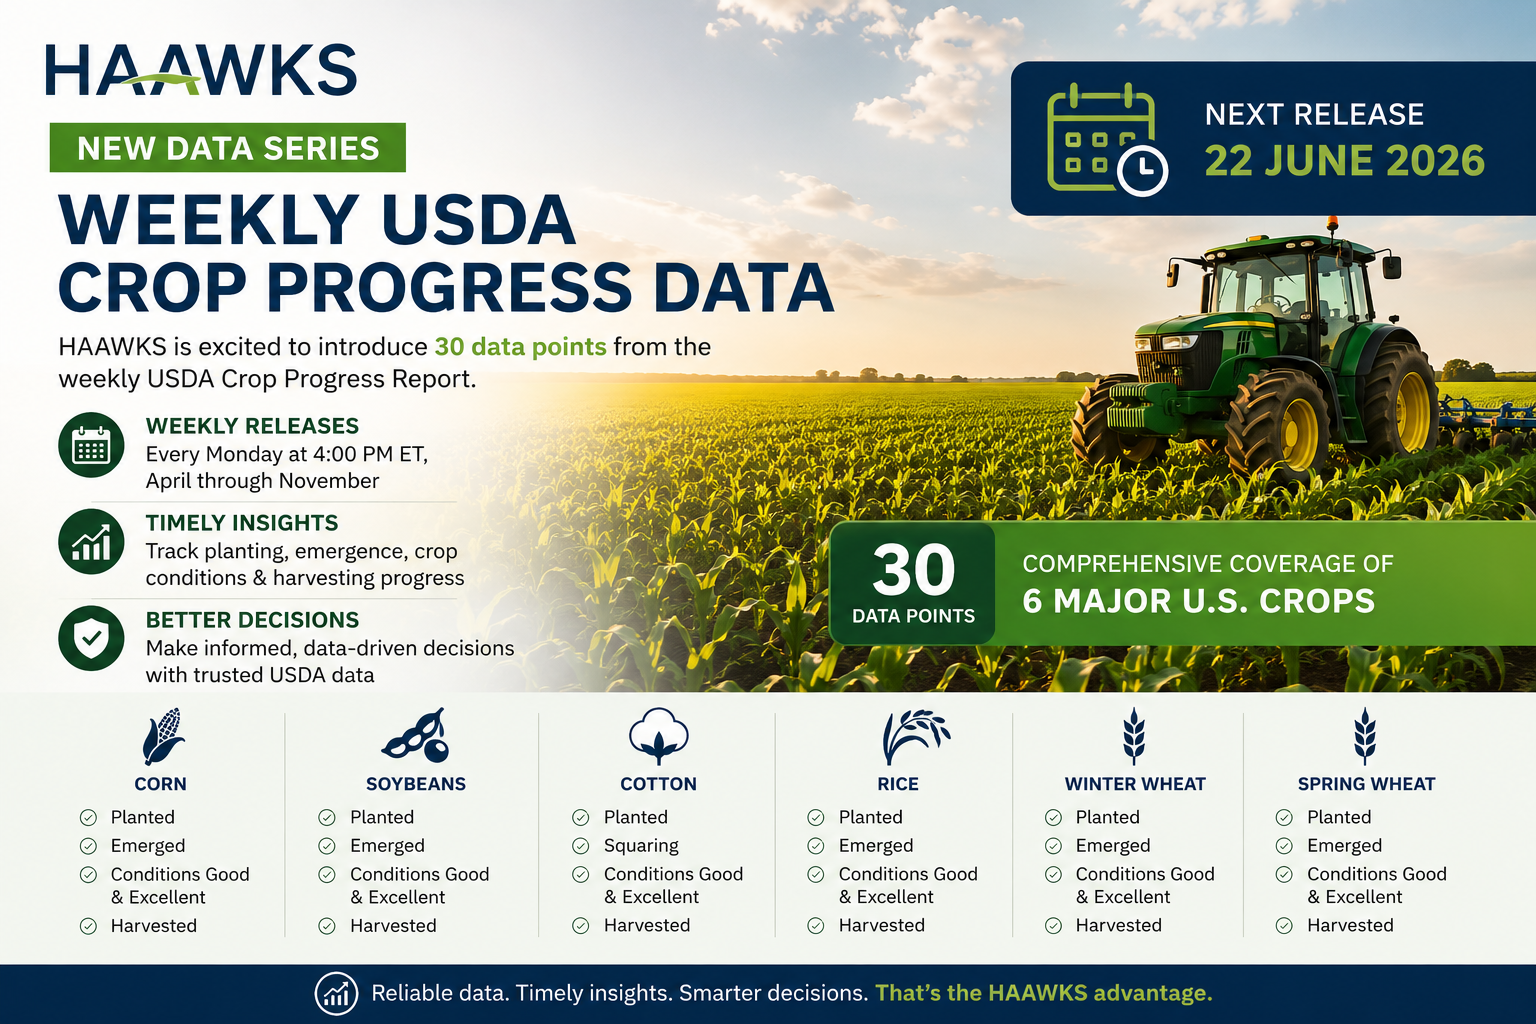
HAAWKS announcement graphic for weekly USDA Crop Progress Data covering 30 data points across six major U.S. crops.

HAAWKS is pleased to announce the upcoming introduction and dissemination of new data points from the weekly USDA Crop Progress Report, one of the key reference sources for monitoring the development and condition of major U.S. crops throughout the growing season.

Released every Monday at 4:00 PM ET from April through November, the USDA Crop Progress Report provides timely updates on planting, emergence, crop conditions, and harvesting progress across major agricultural commodities. The next release is scheduled for 22 June 2026.

To support faster analysis and better market visibility, HAAWKS will introduce 30 weekly crop progress data points, covering six major U.S. crops:

Corn
Planted, emerged, conditions good & excellent, harvested

Soybeans
Planted, emerged, conditions good & excellent, harvested

Cotton
Planted, squaring, conditions good & excellent, harvested

Rice
Planted, emerged, conditions good & excellent, harvested

Winter Wheat
Planted, emerged, conditions good & excellent, harvested

Spring Wheat
Planted, emerged, conditions good & excellent, harvested

By making these data points available in a structured and timely format, HAAWKS helps traders, analysts, and agricultural market participants track crop development more efficiently and respond more quickly to changing supply-side conditions.

The addition of USDA Crop Progress data further strengthens HAAWKS’ commitment to delivering high-quality, market-relevant agricultural data that supports informed decision-making across the commodity markets.

Disclaimer: This blog post is for informational purposes only and should not be construed as financial advice. Always conduct thorough research and consider seeking advice from a financial professional before making any investment decisions.

Source: https://esmis.nal.usda.gov/publication/crop-progress

Comment