According to our analysis crude oil moved 49 ticks on DOE Petroleum Status Report data on 18 October 2023.
Light sweet crude oil (22 ticks)

Brent crude oil (27 ticks)

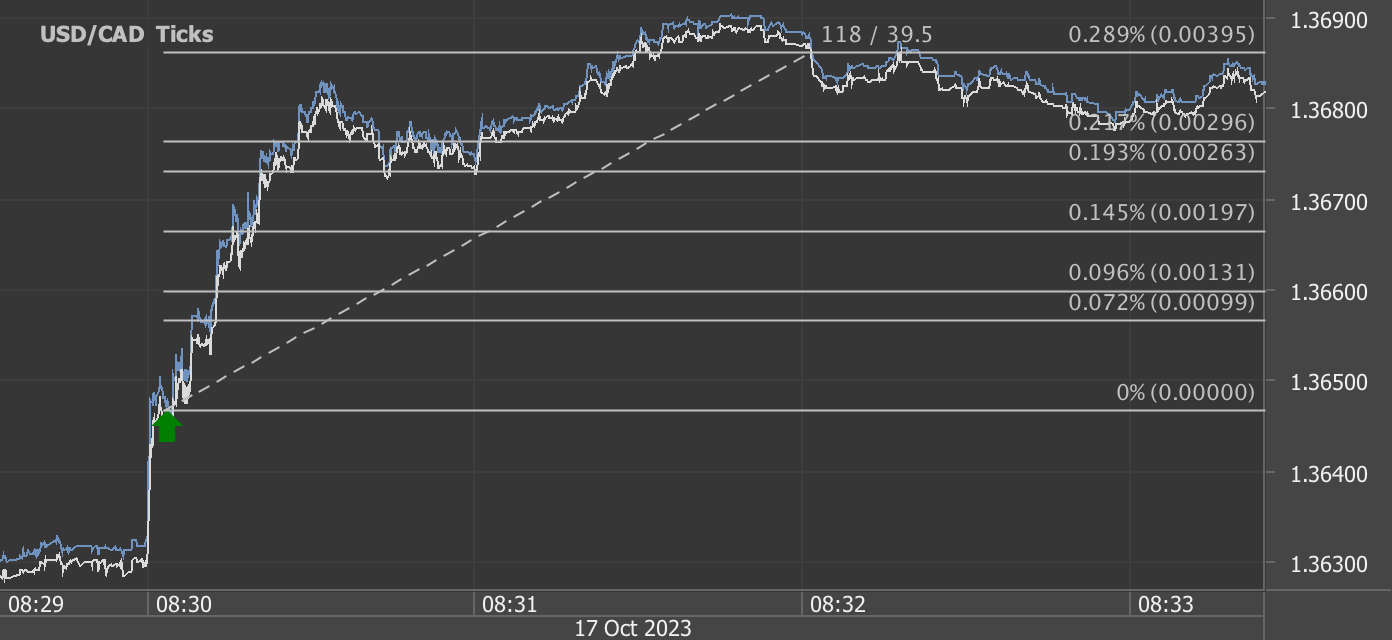
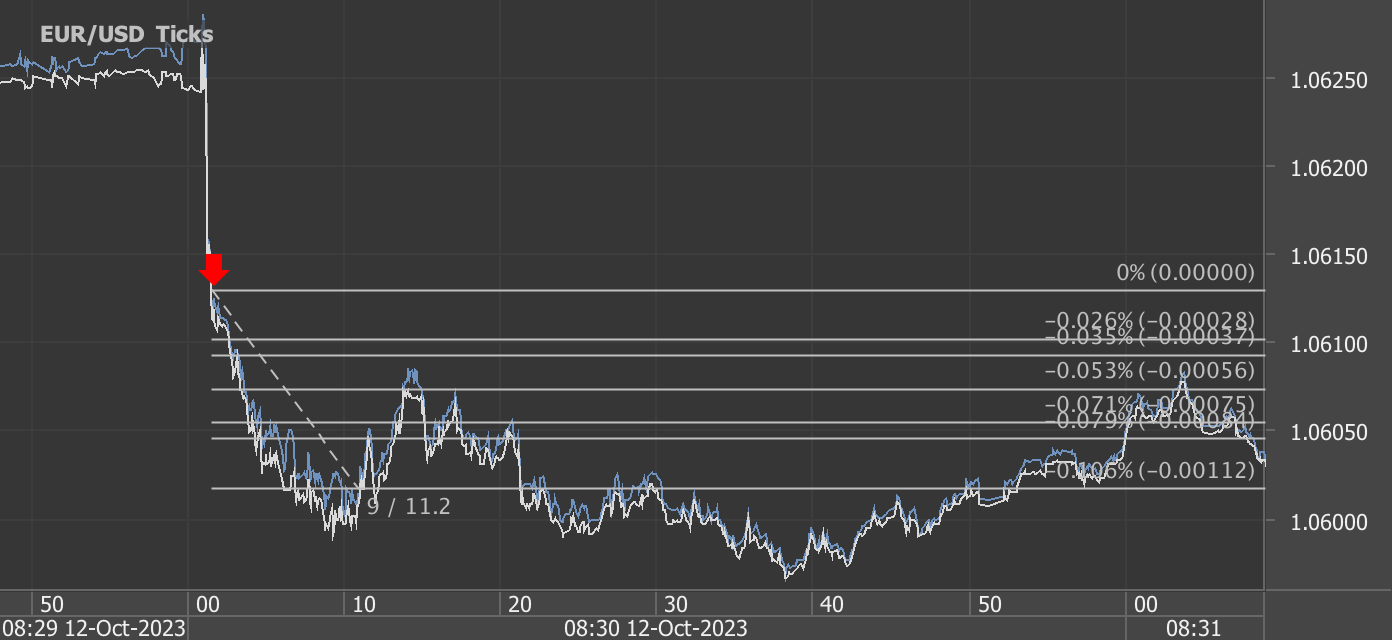
Charts are exported from JForex (Dukascopy).
In recent trading sessions, two significant crude oil benchmarks, West Texas Intermediate (WTI) and Brent crude oil, have experienced notable price movements. WTI has moved up 22 ticks, and Brent has increased by 27 ticks. These price shifts reflect the complex interplay of factors such as global demand, geopolitical tensions, supply concerns, economic recovery, and environmental policies.
One crucial aspect influencing these oil price movements is the weekly Petroleum Status Report for the United States, which provides insights into the nation's crude oil and petroleum product inventories, production rates, and consumption trends.
According to the most recent report for the week ending October 13, 2023:
Crude Oil Refinery Inputs: U.S. crude oil refinery inputs averaged 15.4 million barrels per day during the week, showing an increase of 192 thousand barrels per day from the previous week. Refineries operated at 86.1% of their operable capacity during this period.
Gasoline Production: Gasoline production increased last week, averaging 9.8 million barrels per day.
Distillate Fuel Production: Distillate fuel production decreased last week, averaging 4.7 million barrels per day.
Crude Oil Imports: U.S. crude oil imports averaged 5.9 million barrels per day last week, a decrease of 387 thousand barrels per day from the previous week.
Crude Oil Inventories: U.S. commercial crude oil inventories (excluding those in the Strategic Petroleum Reserve) decreased by 4.5 million barrels from the previous week. At 419.7 million barrels, U.S. crude oil inventories are about 5% below the five-year average for this time of year.
Gasoline and Distillate Inventories: Total motor gasoline inventories decreased by 2.4 million barrels from last week and are slightly above the five-year average for this time of year. Distillate fuel inventories decreased by 3.2 million barrels last week and are about 12% below the five-year average for this time of year.
Total Commercial Petroleum Inventories: Total commercial petroleum inventories decreased by 11.9 million barrels last week.
Products Supplied: Total products supplied over the last four-week period averaged 20.2 million barrels a day, down by 0.9% from the same period last year. Motor gasoline product supplied averaged 8.5 million barrels a day, down by 3.1% from the same period last year. Distillate fuel product supplied averaged 4.0 million barrels a day over the past four weeks, down by 5.1% from the same period last year.
These reports not only reflect the current state of the U.S. petroleum industry but also have a significant impact on global oil markets. The dynamics of supply, production, and consumption outlined in the report play a crucial role in determining the direction of oil prices. This data helps traders, investors, and policymakers make informed decisions in an ever-evolving energy landscape.
Source: https://ir.eia.gov/wpsr/wpsrsummary.pdf
Start futures forex fx crude oil news trading with Haawks G4A low latency machine-readable data, the fastest data feed for DOE Petroleum Status Report data.
Please let us know your feedback. If you are interested in timestamps, please send us an email to sales@haawks.com.