Viewing entries in
USDA Grains News Trading

36 ticks potential profit on 29 September 2023, analysis on trading soybeans futures on USDA Grain Stocks data

Comment

36 ticks potential profit on 29 September 2023, analysis on trading soybeans futures on USDA Grain Stocks data

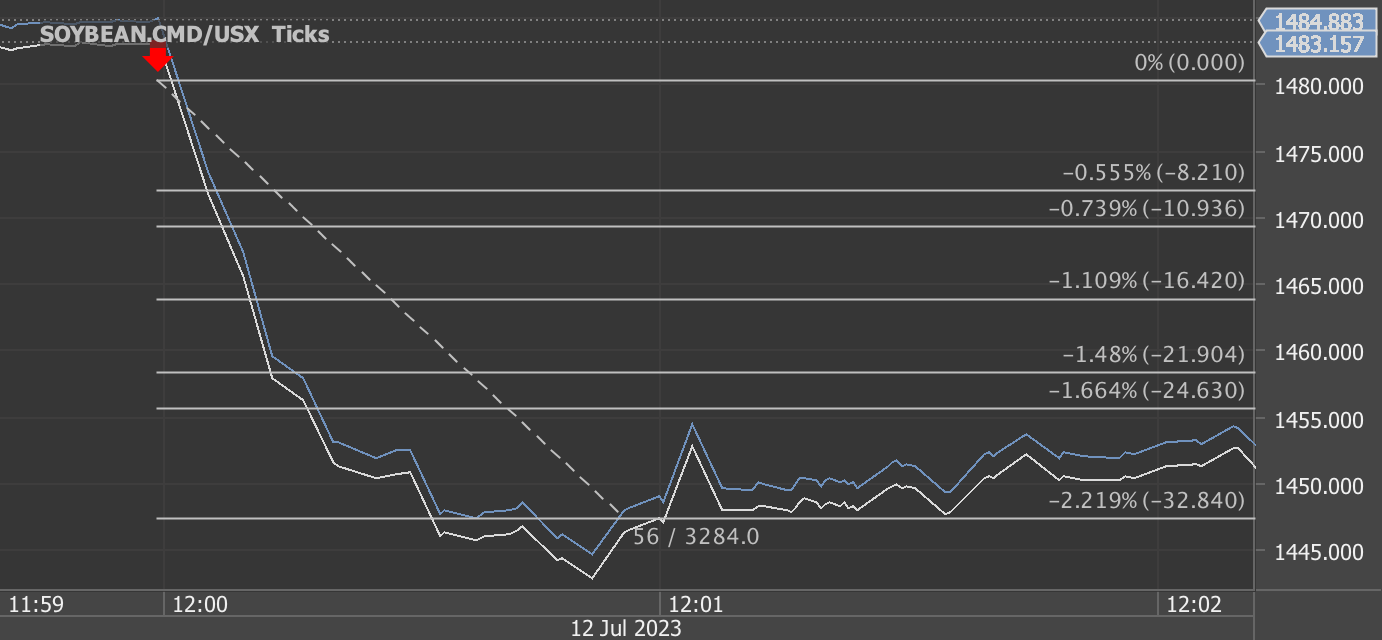
According to our analysis soybeans (ZS) futures prices moved around 36 ticks on USDA Grain Stocks data on 29 September 2023.

Soybeans (36 ticks)

Charts are exported from JForex (Dukascopy).


In the USDA Grain Stocks report dated September 29, 2023, the following key information is highlighted:

Corn Stocks:

  • Old crop corn stocks as of September 1, 2023, amounted to 1.36 billion bushels, down 1 percent from the same date in the previous year.

  • On-farm stocks increased by 19 percent compared to the previous year, totaling 605 million bushels, while off-farm stocks decreased by 13 percent to 756 million bushels.

  • Indicated disappearance for June - August 2023 was 2.75 billion bushels, lower than the previous year.

  • The 2022 corn production was revised down by 15.0 million bushels, with adjustments to planted area, harvested area, yield, and production.

Soybean Stocks:

  • Old crop soybean stocks as of September 1, 2023, totaled 268 million bushels, down 2 percent from the previous year.

  • On-farm stocks increased by 14 percent to 72.0 million bushels, while off-farm stocks decreased by 7 percent to 196 million bushels.

  • Indicated disappearance for June - August 2023 was 528 million bushels, down 24 percent from the previous year.

  • The 2022 soybean production was revised down by 5.93 million bushels, with adjustments to harvested area, yield, and production.

All Wheat Stocks:

  • All wheat stored in all positions on September 1, 2023, totaled 1.78 billion bushels, a slight increase from the previous year.

  • On-farm stocks increased by 1 percent to 598 million bushels, while off-farm stocks decreased by less than 1 percent to 1.18 billion bushels.

  • Indicated disappearance for June - August 2023 was 614 million bushels, up 8 percent from the previous year.

A special note emphasizes that the marketing year for corn and soybeans has concluded, leading to a review of the balance sheet and revisions in acreage, yield, and production for the 2022 crop. These statistics provide valuable insights into stock levels and production changes for corn, soybeans, and wheat, crucial for agricultural planning and market analysis.

Source: https://downloads.usda.library.cornell.edu/usda-esmis/files/xg94hp534/ww72cv37d/3j334m45p/grst0923.pdf


Haawks G4A is the fastest machine-readable data feed for USDA data. We are beating big names in the industry by seconds. Coverage includes monthly USDA WASDE (World Agricultural Supply and Demand Estimates), quarterly USDA Grain Stocks and yearly USDA Prospective Plantings and USDA Acreage.

Please let us know your feedback. If you are interested in timestamps, please send us an email to sales@haawks.com.

Comment

44 ticks potential profit on 12 September 2023, analysis on trading soybeans futures on USDA WASDE data

Comment

44 ticks potential profit on 12 September 2023, analysis on trading soybeans futures on USDA WASDE data

According to our analysis soybeans (ZS) futures prices moved around 44 ticks on USDA WASDE (World Agricultural Supply and Demand Estimates) data on 12 September 2023.

Soybeans (44 ticks)

Charts are exported from JForex (Dukascopy).


The World Agricultural Supply and Demand Estimates (WASDE) report for September 12, 2023, offers the following key insights:

Wheat:

  • The U.S. wheat supply and use outlook for 2023/24 remains unchanged, with a projected season-average farm price of $7.50 per bushel.

  • Globally, wheat supplies, consumption, exports, and ending stocks have decreased compared to the previous month, marking the first year-to-year decline in global wheat production since 2018/19.

  • Major wheat-producing countries, including Australia and Canada, are experiencing decreased production due to adverse weather conditions.

Coarse Grains (Corn):

  • The U.S. corn outlook for 2023/24 anticipates slightly larger supplies and ending stocks, with corn production forecasted at 15.1 billion bushels.

  • Global coarse grain production shows marginal changes, with variations in trade and increased stocks.

  • Foreign corn production remains stable, with Ukraine's production showing an increase and the EU experiencing a slight decline.

  • Major global trade changes include reduced barley exports for Canada and increased exports for Russia.

  • Foreign corn ending stocks have risen, particularly in Brazil, Mexico, Ukraine, and China, offsetting a decline in Argentina.

  • World corn ending stocks have increased relative to the previous month.

Oilseeds (Soybeans):

  • U.S. soybean supply and use changes for 2023/24 include lower beginning stocks, production, crush, exports, and ending stocks.

  • Reduced beginning stocks reflect increased exports in the previous year.

  • Soybean production is projected at 4.1 billion bushels, with a lower yield offset by higher harvested area.

  • The soybean crush and export forecasts have been reduced due to lower supplies, resulting in decreased ending stocks.

  • The U.S. season-average soybean price is forecasted to be $12.90 per bushel.

  • Global oilseed production for 2023/24 has decreased, primarily due to lower rapeseed, sunflowerseed, and cottonseed production in various countries.

  • Global soybean crush and exports have also declined, with reduced crush expected in several major producing nations.

  • Import changes include decreased imports for Pakistan, Thailand, the EU, and Indonesia, while China's imports have increased due to higher crush demand and shipments from Brazil.

These insights from the September 12, 2023, WASDE report provide critical information for stakeholders in the wheat, coarse grains, and oilseeds markets, guiding their decision-making processes in the global agricultural landscape.

Source: https://www.usda.gov/oce/commodity/wasde


Haawks G4A is the fastest machine-readable data feed for USDA data. We are beating big names in the industry by seconds. Coverage includes monthly USDA WASDE (World Agricultural Supply and Demand Estimates), quarterly USDA Grain Stocks and yearly USDA Prospective Plantings and USDA Acreage.

Please let us know your feedback. If you are interested in timestamps, please send us an email to sales@haawks.com.

Comment

92 ticks potential profit on 11 August 2023, analysis on trading soybeans futures on USDA WASDE data

Comment

92 ticks potential profit on 11 August 2023, analysis on trading soybeans futures on USDA WASDE data

According to our analysis soybeans (ZS) futures prices moved around 92 ticks on USDA WASDE (World Agricultural Supply and Demand Estimates) data on 11 August 2023.

ZS 92 ticks

Haawks G4A is the fastest machine-readable data feed for USDA data. We are beating big names in the industry by seconds. Coverage includes monthly USDA WASDE (World Agricultural Supply and Demand Estimates), quarterly USDA Grain Stocks and yearly USDA Prospective Plantings and USDA Acreage.

Please let us know your feedback. If you are interested in timestamps, please send us an email to sales@haawks.com.

Soybeans (92 ticks)

Charts are exported from JForex (Dukascopy).

Comment

188 ticks potential profit on 12 July 2023, analysis on trading corn, wheat and soybeans futures on USDA WASDE data

Comment

188 ticks potential profit on 12 July 2023, analysis on trading corn, wheat and soybeans futures on USDA WASDE data

According to our analysis corn (ZC), wheat (ZW) and soybeans (ZS) futures prices moved around 188 ticks on USDA WASDE (World Agricultural Supply and Demand Estimates) data on 12 July 2023.

ZC 32 ticks, ZW 28 ticks, ZS 128 ticks

Haawks G4A is the fastest machine-readable data feed for USDA data. We are beating big names in the industry by seconds. Coverage includes monthly USDA WASDE (World Agricultural Supply and Demand Estimates), quarterly USDA Grain Stocks and yearly USDA Prospective Plantings and USDA Acreage.

Please let us know your feedback. If you are interested in timestamps, please send us an email to sales@haawks.com.

Soybeans (128 ticks)

Charts are exported from JForex (Dukascopy).

Comment

38 ticks potential profit on 30 June 2023, analysis on trading soybeans futures on USDA Grain Stocks and USDA Acreage data

Comment

38 ticks potential profit on 30 June 2023, analysis on trading soybeans futures on USDA Grain Stocks and USDA Acreage data

According to our analysis soybeans (ZS) futures prices moved around 38 ticks on USDA Grain Stocks and USDA Acreage data on 30 June 2023.

Haawks G4A is the fastest machine-readable data feed for USDA data. We are beating big names in the industry by seconds. Coverage includes monthly USDA WASDE (World Agricultural Supply and Demand Estimates), quarterly USDA Grain Stocks and yearly USDA Prospective Plantings and USDA Acreage.

Please let us know your feedback. If you are interested in timestamps, please send us an email to sales@haawks.com.

Soybeans (38 ticks)

Charts are exported from JForex (Dukascopy).

Comment

48 ticks potential profit on 8 February 2023, analysis on trading soybeans futures on USDA WASDE data

Comment

48 ticks potential profit on 8 February 2023, analysis on trading soybeans futures on USDA WASDE data

According to our analysis soybeans (ZS) futures prices moved around 48 ticks on USDA WASDE (World Agricultural Supply and Demand Estimates) data on 8 February 2023.

Haawks G4A is the fastest machine-readable data feed for USDA data. We are beating big names in the industry by seconds. Coverage includes monthly USDA WASDE (World Agricultural Supply and Demand Estimates), quarterly USDA Grain Stocks and yearly USDA Prospective Plantings and USDA Acreage.

Please let us know your feedback. If you are interested in timestamps, please send us an email to sales@haawks.com.

Soybeans (48 ticks)

Charts are exported from JForex (Dukascopy).

Comment

112 ticks potential profit on 12 January 2023, analysis on trading corn, soybeans and wheat futures on USDA WASDE and USDA Grain Stocks data

Comment

112 ticks potential profit on 12 January 2023, analysis on trading corn, soybeans and wheat futures on USDA WASDE and USDA Grain Stocks data

According to our analysis corn (ZC), soybeans (ZS) and wheat (ZW) futures prices moved around 112 ticks on USDA WASDE (World Agricultural Supply and Demand Estimates) and USDA Grain Stocks data on 12 January 2023.

Haawks G4A is the fastest machine-readable data feed for USDA data. We are beating big names in the industry by seconds. Coverage includes monthly USDA WASDE (World Agricultural Supply and Demand Estimates), quarterly USDA Grain Stocks and yearly USDA Prospective Plantings and USDA Acreage.

Please let us know your feedback. If you are interested in timestamps, please send us an email to sales@haawks.com.

Soybeans (60 ticks)

Charts are exported from JForex (Dukascopy).

Comment

92 ticks potential profit on 9 November 2022, analysis on trading soybeans and wheat futures on USDA WASDE data

Comment

92 ticks potential profit on 9 November 2022, analysis on trading soybeans and wheat futures on USDA WASDE data

According to our analysis soybeans (ZS) and wheat (ZW) futures prices moved around 92 ticks on USDA WASDE (World Agricultural Supply and Demand Estimates) data on 9 November 2022.

Haawks G4A is the fastest machine-readable data feed for USDA data. We are beating big names in the industry by seconds. Coverage includes monthly USDA WASDE (World Agricultural Supply and Demand Estimates), quarterly USDA Grain Stocks and yearly USDA Prospective Plantings and USDA Acreage.

Please let us know your feedback. If you are interested in timestamps, please send us an email to sales@haawks.com.

Soybeans (52 ticks)

Charts are exported from JForex (Dukascopy).

Comment

120 ticks potential profit on 12 October 2022, analysis on trading soybeans futures on USDA WASDE data

Comment

120 ticks potential profit on 12 October 2022, analysis on trading soybeans futures on USDA WASDE data

According to our analysis soybeans (ZS) futures prices moved around 120 ticks on USDA WASDE (World Agricultural Supply and Demand Estimates) data on 12 October 2022.

Haawks G4A is the fastest machine-readable data feed for USDA data. We are beating big names in the industry by seconds. Coverage includes monthly USDA WASDE (World Agricultural Supply and Demand Estimates), quarterly USDA Grain Stocks and yearly USDA Prospective Plantings and USDA Acreage.

Please let us know your feedback. If you are interested in timestamps, please send us an email to sales@haawks.com.

Soybeans (120 ticks)

Charts are exported from JForex (Dukascopy).

Comment

144 ticks potential profit on 30 September 2022, analysis on trading corn and soybeans futures on USDA Grain Stocks data (video included)

Comment

144 ticks potential profit on 30 September 2022, analysis on trading corn and soybeans futures on USDA Grain Stocks data (video included)

According to our analysis corn (ZC) and soybeans (ZS) futures prices moved around 144 ticks on USDA Grain Stocks data on 30 September 2022.

ZC moved 68 ticks, ZS moved 76 ticks.

Haawks G4A is the fastest machine-readable data feed for USDA data. We are beating big names in the industry by seconds. Coverage includes monthly USDA WASDE (World Agricultural Supply and Demand Estimates), quarterly USDA Grain Stocks and yearly USDA Prospective Plantings and USDA Acreage.

Please let us know your feedback. If you are interested in timestamps, please send us an email to sales@haawks.com.

Soybeans (76 ticks)

Charts are exported from JForex (Dukascopy).

Comment