According to our analysis natural gas moved 83 ticks on DOE Natural Gas Storage Report data on 19 October 2023.
Natural gas (83 ticks)

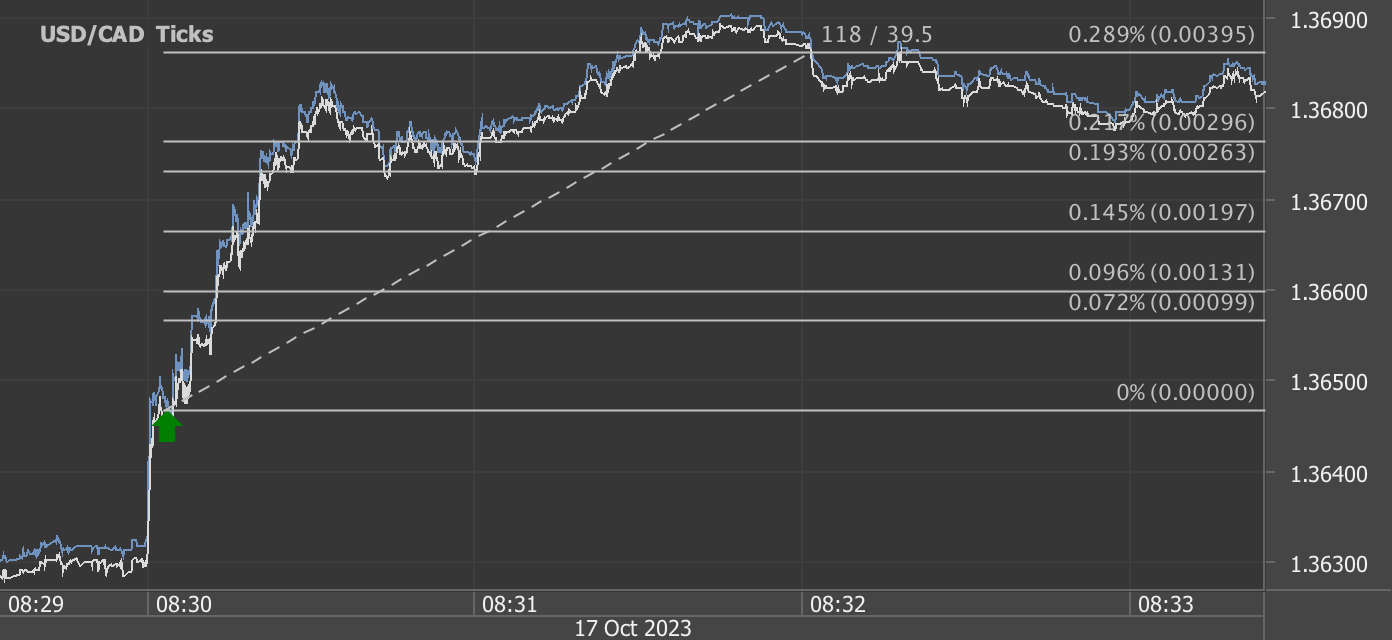
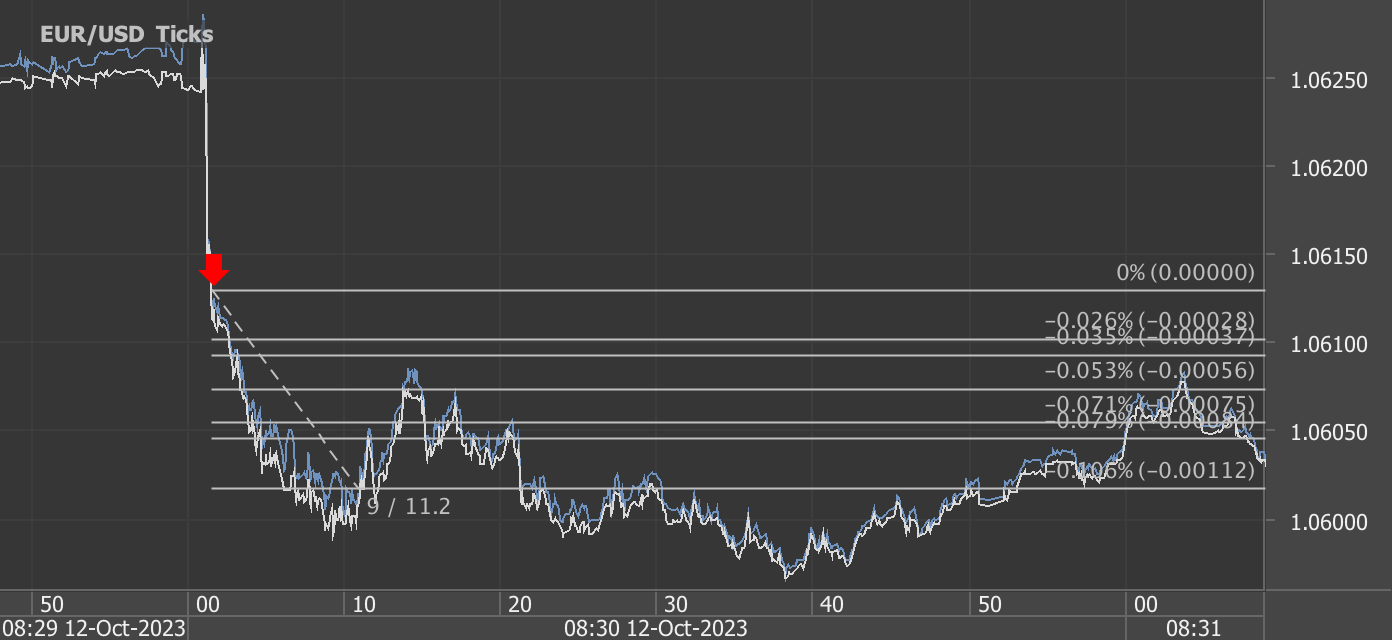
Charts are exported from JForex (Dukascopy).
Natural Gas Weekly Update – October 18, 2023
In the world of energy commodities, natural gas plays a pivotal role in meeting various demands, from residential heating to electricity generation. Understanding the latest developments in the natural gas market is essential for consumers, businesses, and investors. Here's a recap of the key points from the Natural Gas Weekly Update for the week ending October 18, 2023:
Associated Natural Gas Production Surge: In 2022, associated-dissolved natural gas production (associated natural gas) witnessed a significant 9% increase, reaching 15.5 billion cubic feet per day. This surge was primarily attributed to an 8% growth in crude oil production in major U.S. onshore crude oil-producing regions, such as Permian, Bakken, Eagle Ford, Niobrara, and Anadarko. Associated natural gas, which is dissolved in crude oil and released during oil extraction, accounted for over a third of total natural gas production in these regions and 14% of total U.S. natural gas production.
Market Highlights: For the week ending October 18, 2023, here are the natural gas market highlights:
Prices:
The Henry Hub spot price fell from $3.18/MMBtu to $2.90/MMBtu.
The price of the November 2023 NYMEX contract decreased from $3.377/MMBtu to $3.056/MMBtu.
Select regional spot prices showed varying price changes, with some locations experiencing increases.
Supply and Demand:
Total supply of natural gas increased by 1.1% compared to the previous week.
Dry natural gas production averaged 102.6 Bcf/d, reaching the highest weekly average since May 2023.
Total consumption of natural gas rose by 2.4% compared to the previous week.
Industrial sector consumption increased, and residential and commercial sector consumption surged due to cooler temperatures.
Liquefied Natural Gas (LNG):
Average natural gas deliveries to U.S. LNG export terminals increased by 12.2% week over week.
Vessels departing U.S. ports carried a total LNG-carrying capacity of 108 Bcf.
Rig Count:
The natural gas rig count decreased by one rig to 117 rigs, while the oil rig count increased by four rigs.
Storage Report Impact:
The weekly storage report led to a decline in natural gas prices, with the market dropping by 83 ticks.
Storage:
Net injections into storage totaled 97 Bcf for the week ending October 13, slightly above the five-year average.
Working natural gas stocks reached 3,626 Bcf, 5% higher than the five-year average and 9% more than last year at the same time.
The natural gas market is influenced by various factors, including production, consumption, and regional price variations. These insights are valuable for both industry experts and everyday consumers as they navigate the energy landscape. Stay tuned for the next update on October 26, 2023, to keep abreast of the latest developments in the natural gas market.
Source: https://www.eia.gov/naturalgas/weekly/
Start futures forex fx commodity news trading with Haawks G4A low latency machine-readable data, one of the fastest data feeds for DOE data.
Please let us know your feedback. If you are interested in timestamps, please send us an email to sales@haawks.com.