Viewing entries tagged
cfd

Comment

42 ticks potential profit in 87 seconds on 21 May 2025, analysis on futures news trading crude oil on DOE Petroleum Status Report data

According to our analysis crude oil moved 42 ticks on DOE Petroleum Status Report data on 21 May 2025.

Light sweet crude oil (42 ticks)

Charts are exported from JForex (Dukascopy).


U.S. Weekly Petroleum Update: Refinery Activity Rises, Inventories Continue to Build

Published: May 21, 2025

The U.S. Energy Information Administration’s (EIA) latest weekly petroleum data, covering the week ending May 16, 2025, reveals a modest uptick in refinery operations and a continued rise in inventories across several fuel categories, even as product demand shows year-over-year declines.

Refinery Inputs and Production

U.S. crude oil refinery inputs averaged 16.5 million barrels per day, an increase of 89,000 barrels per day compared to the previous week. Refineries operated at 90.7% capacity, maintaining a strong operational pace heading into the summer driving season.

Fuel production also saw gains:

  • Gasoline production rose to an average of 9.6 million barrels per day.

  • Distillate fuel production increased significantly, up 131,000 barrels per day to an average of 4.7 million barrels per day.

Imports on the Rise

Crude oil imports increased notably, averaging 6.1 million barrels per day, up 247,000 barrels per day from the week prior. Despite the weekly increase, the four-week average of 5.9 million barrels per day still lags 13.5% behind the same period last year.

Other key import figures:

  • Motor gasoline imports averaged 747,000 barrels per day.

  • Distillate fuel imports averaged 141,000 barrels per day.

Inventory Levels Continue to Climb

Commercial petroleum inventories grew across the board last week:

  • Crude oil inventories (excluding the Strategic Petroleum Reserve) rose by 1.3 million barrels, totaling 443.2 million barrels. This places current stockpiles about 6% below the five-year seasonal average.

  • Motor gasoline inventories increased by 0.8 million barrels, now standing about 2% below the five-year average.

  • Distillate fuel inventories rose by 0.6 million barrels, though they remain 16% below the seasonal norm.

  • Propane/propylene inventories surged by 2.7 million barrels, but still sit 7% below average levels.

In total, commercial petroleum inventories rose by 4.9 million barrels.

Product Demand Trends

Despite the increases in production and inventory, product demand remains soft:

  • Total products supplied averaged 19.6 million barrels per day over the past four weeks, a 2.8% decrease from the same period last year.

  • Motor gasoline demand dipped by 1%, averaging 8.8 million barrels per day.

  • Distillate fuel demand saw a sharper drop of 4.2%, averaging 3.6 million barrels per day.

  • On a brighter note, jet fuel demand climbed 4% year-over-year.

Takeaway

The latest data points to a petroleum market that is stabilizing in supply but facing persistent demand headwinds. With refinery utilization high and inventories rising, the market may be well-positioned for summer travel season, but muted year-over-year product demand could temper price pressures in the near term.

Stay tuned for more updates and analysis as the season progresses.

Disclaimer: This blog post is for informational purposes only and should not be construed as financial advice. Always conduct thorough research and consider seeking advice from a financial professional before making any investment decisions.

Source: https://ir.eia.gov/wpsr/wpsrsummary.pdf


Start futures forex fx commodity news trading with Haawks G4A low latency machine-readable data, one of the fastest data feeds for DOE data.

Please let us know your feedback. If you are interested in timestamps, please send us an email to sales@haawks.com.

Comment

Comment

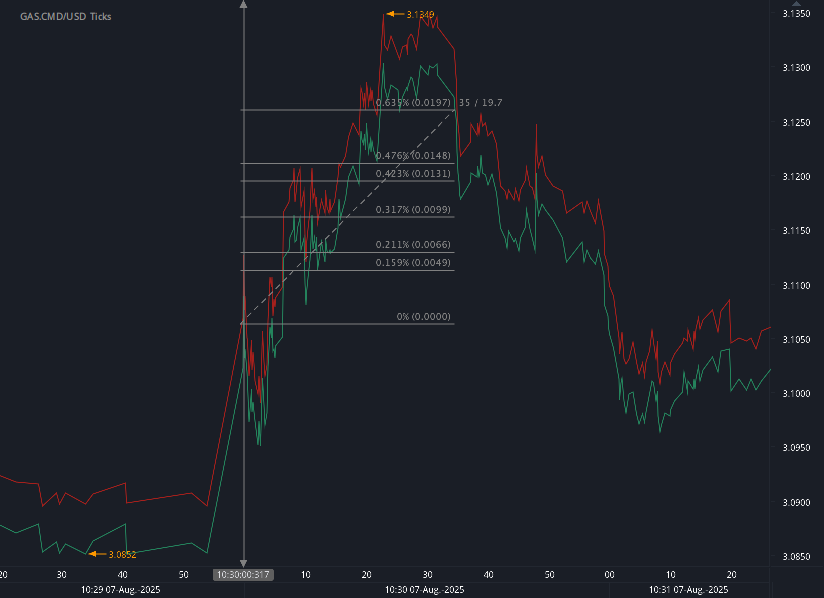
19 ticks potential profit in 17 seconds on 15 May 2025, analysis on futures news trading natural gas on DOE Natural Gas Storage Report data

According to our analysis natural gas moved 17 ticks on DOE Natural Gas Storage Report data on 15 May 2025.

Natural gas (19 ticks)

Charts are exported from JForex (Dukascopy).


U.S. Natural Gas Storage Sees Strong Build Amid Seasonal Demand Shifts

Published: May 16, 2025

The latest report from the U.S. Energy Information Administration (EIA) reveals a significant weekly injection into underground natural gas storage, marking an important trend as the industry transitions from the heating season toward summer cooling demand.

Key Highlights

  • Total U.S. working gas in storage: 2,255 billion cubic feet (Bcf)

  • Weekly change: +110 Bcf

  • Compared to one year ago: 375 Bcf lower

  • Compared to five-year average (2020–2024): 57 Bcf higher

This 110 Bcf net injection reflects robust storage activity, exceeding typical mid-May seasonal expectations. Despite being significantly below last year’s levels, total inventories are now 2.6% above the five-year average, providing some cushion ahead of the peak summer demand season.

What This Means for the Market

Natural gas prices may remain relatively stable or even soften in the short term due to this above-average injection and healthy storage buffer. However, the year-over-year deficit—particularly in major demand regions like the East and Midwest—could become a concern if summer heat drives stronger cooling-related demand or if supply disruptions occur.

The market will also be closely watching for shifts in LNG export volumes, production growth from shale regions, and any early-season heat waves, all of which could influence injection rates in the coming months.

A Closer Look at Historical Context

  • Year-Ago Storage (May 9, 2024): 2,630 Bcf

  • Five-Year Average: 2,198 Bcf

  • Current Storage: 2,255 Bcf

Despite being well below last year’s unusually high levels, current stocks remain comfortably within the historical range, as noted in the EIA's shaded graph data.

Final Thoughts

As we progress further into the 2025 injection season, the pace of storage builds and demand pressures from the power generation sector will be critical indicators for summer gas market dynamics. This week’s data suggests solid fundamentals, but with a lingering note of caution due to year-over-year deficits.

Stay tuned for the next release on May 22, 2025, which will offer further insights into how the storage trend is shaping up ahead of the high-demand summer period.

Disclaimer: This blog post is for informational purposes only and should not be construed as financial advice. Always conduct thorough research and consider seeking advice from a financial professional before making any investment decisions.

Source: https://ir.eia.gov/ngs/ngs.html


Start futures forex fx commodity news trading with Haawks G4A low latency machine-readable data, one of the fastest data feeds for DOE data.

Please let us know your feedback. If you are interested in timestamps, please send us an email to sales@haawks.com.

Comment

Comment

55 ticks potential profit in 42 seconds on 1 May 2025, analysis on futures news trading natural gas on DOE Natural Gas Storage Report data

According to our analysis natural gas moved 55 ticks on DOE Natural Gas Storage Report data on 1 May 2025.

Natural gas (55 ticks)

Charts are exported from JForex (Dukascopy).


Natural Gas Storage Inches Upward as Spring Builds Continue

May 2, 2025

The U.S. Energy Information Administration (EIA) released its latest Weekly Natural Gas Storage Report on May 1, 2025, revealing a notable build in underground natural gas stocks as the country transitions deeper into spring. For the week ending April 25, 2025, working gas in storage across the Lower 48 states rose by 107 billion cubic feet (Bcf), bringing total inventories to 2,041 Bcf.

This increase keeps gas storage slightly ahead of the five-year average of 2,036 Bcf and narrows the year-on-year deficit, although stocks still trail last year's levels by 435 Bcf, a decline of 17.6%.

Regional Storage Trends

Breaking it down by region:

  • East: Added 36 Bcf, reaching 331 Bcf—down 21.7% from last year.

  • Midwest: Increased by 29 Bcf to 425 Bcf, 24.4% lower than a year ago.

  • Mountain: Saw a modest build of 3 Bcf to 174 Bcf, only 3.9% off from 2024 levels.

  • Pacific: Added 5 Bcf to hit 226 Bcf, down 5.4% from last year but still 19.6% above the five-year average.

  • South Central: Gained 34 Bcf to reach 885 Bcf, with the Salt component up 15 Bcf and Nonsalt up 20 Bcf.

Despite the year-over-year deficit, this week's build puts national storage comfortably within the five-year historical range—an encouraging sign for market stability heading into the summer months.

A Closer Look at Variability

The EIA also provided sampling variability estimates. The total coefficient of variation for stocks was just 0.4%, suggesting high reliability in this week's numbers. Standard error for the net change was only ±1.0 Bcf, reinforcing confidence in the reported 107 Bcf injection.

Outlook

With injection season ramping up, attention turns to weather forecasts, LNG export trends, and domestic demand as key drivers of storage trajectories in the weeks ahead. If moderate builds like this week’s continue, the market could see a more balanced setup heading into the heating season later this year, despite the current shortfall relative to 2024.

Stay tuned for the next report on May 8, 2025, for updates on how U.S. storage levels are evolving.

Disclaimer: This blog post is for informational purposes only and should not be construed as financial advice. Always conduct thorough research and consider seeking advice from a financial professional before making any investment decisions.

Source: https://ir.eia.gov/ngs/ngs.html


Start futures forex fx commodity news trading with Haawks G4A low latency machine-readable data, one of the fastest data feeds for DOE data.

Please let us know your feedback. If you are interested in timestamps, please send us an email to sales@haawks.com.

Comment

Comment

28 ticks potential profit in 48 seconds on 24 April 2025, analysis on futures news trading natural gas on DOE Natural Gas Storage Report data

According to our analysis natural gas moved 28 ticks on DOE Natural Gas Storage Report data on 24 April 2025.

Natural gas (28 ticks)

Charts are exported from JForex (Dukascopy).


Natural Gas Market Update: Week Ending April 23, 2025

The U.S. natural gas market experienced a broad decline in prices and demand this past week, influenced primarily by unseasonably warm weather and lower residential consumption across key regions. Here's a snapshot of the major trends driving the market, based on data from the U.S. Energy Information Administration (EIA) and S&P Global Commodity Insights.

Price Movements

National Benchmarks:

  • Henry Hub Spot Price dropped by 28 cents, from $3.21/MMBtu to $2.93/MMBtu.

  • May 2025 NYMEX Futures fell by 23 cents, ending at $3.022/MMBtu.

  • The 12-month strip (May 2025–April 2026) averaged $3.756/MMBtu, down 17 cents from the prior week.

Regional Highlights:

  • Northeast prices saw sharp declines due to warming temperatures. Boston’s Algonquin Citygate fell 68 cents to $2.19/MMBtu, while Transco Zone 6 NY dropped 65 cents to $2.08/MMBtu.

  • Waha Hub in the Permian Basin saw the largest regional decline, falling $1.33.

  • Houston Ship Channel stood out with an 11-cent increase.

Weather and Demand Impacts

Temperature swings significantly reduced heating demand in the Northeast:

  • Boston: Avg. temperature rose from 45°F to 56°F, leading to 72 fewer heating degree days.

  • New York (Central Park): Avg. temperature climbed 14°F to 62°F.

This warming trend led to a 51% drop in residential and commercial natural gas consumption in the Northeast, down 4.6 Bcf/d week-over-week.

Supply and Demand Overview

  • Total supply of natural gas fell by 1.0 Bcf/d (0.9%), mainly due to a 16.3% drop in net imports from Canada.

  • Dry gas production remained flat at 106.3 Bcf/d.

  • Total U.S. consumption dropped by 6.3 Bcf/d (8.7%), driven by a:

    • 31.7% decline in residential and commercial use (-6.7 Bcf/d),

    • 2.6% decline in industrial consumption (-0.6 Bcf/d),

    • Slight 3.3% increase in power generation use (+0.9 Bcf/d).

LNG Exports and Pipeline Activity

  • LNG pipeline receipts averaged 16.1 Bcf/d, down 0.7 Bcf/d from the previous week.

    • South Louisiana terminals led the drop, down 6.7% (0.7 Bcf/d).

    • South Texas and other U.S. terminals held steady.

  • 27 LNG vessels departed U.S. ports, carrying a combined 102 Bcf of natural gas.

Rig Activity

  • Natural gas rig count increased by 1 rig to 98.

    • Gains were noted in the Marcellus (+1) and Utica (+2).

    • Two rigs were dropped in unspecified regions.

  • Oil-directed rigs also rose by 1, bringing the total U.S. rig count to 585, still 34 rigs fewer than the same time last year.

Storage Update

  • Net injections into storage totaled 88 Bcf, above both the five-year average (58 Bcf) and last year’s injections (86 Bcf) for this week.

  • Working gas stocks stood at 1,934 Bcf, which is:

    • 2% below the five-year average,

    • 20% below last year’s level at this time.

Key Takeaway:
Warmer weather across the U.S. has significantly reduced natural gas consumption, especially in the Northeast, leading to falling prices and a slight build in storage. While supply has held relatively steady, the combination of reduced imports, softening demand, and flat production paints a picture of a well-supplied market under less pressure—at least for now.

Disclaimer: This blog post is for informational purposes only and should not be construed as financial advice. Always conduct thorough research and consider seeking advice from a financial professional before making any investment decisions.

Source: https://www.eia.gov/naturalgas/weekly/archivenew_ngwu/2025/04_24/


Start futures forex fx commodity news trading with Haawks G4A low latency machine-readable data, one of the fastest data feeds for DOE data.

Please let us know your feedback. If you are interested in timestamps, please send us an email to sales@haawks.com.

Comment

Comment

19 ticks potential profit in 93 seconds on 23 April 2025, analysis on futures news trading crude oil on DOE Petroleum Status Report data

According to our analysis crude oil moved 19 ticks on DOE Petroleum Status Report data on 23 April 2025.

Light sweet crude oil (19 ticks)

Charts are exported from JForex (Dukascopy).


U.S. Weekly Petroleum Snapshot – April 18, 2025

The U.S. petroleum landscape for the week ending April 18, 2025, reveals a dynamic balance of supply, demand, and prices amid seasonal transitions and evolving energy trends. Let’s break down the latest Weekly Petroleum Status Report from the U.S. Energy Information Administration (EIA).

Refinery Operations and Output

U.S. crude oil refinery inputs averaged 15.9 million barrels per day, rising by 326,000 barrels per day compared to the previous week. Refineries operated at 88.1% of their operable capacity, reflecting an uptick as refineries ramp up ahead of peak driving season.

  • Gasoline production: Rose to 10.1 million barrels/day

  • Distillate fuel production: Dropped slightly to 4.6 million barrels/day

Imports and Inventories

Crude oil imports fell notably:

  • Crude imports: Dropped to 5.6 million barrels/day, down 412,000 from the previous week

  • Four-week average: 6.1 million barrels/day, 6.8% lower than last year

Meanwhile, inventory trends showed a mixed bag:

  • Crude oil inventories (excluding SPR): Up by 0.2 million barrels to 443.1 million barrels, still 5% below the five-year seasonal average

  • Gasoline inventories: Down 4.5 million barrels, now 3% below average

  • Distillate inventories: Down 2.4 million barrels, a significant 13% below average

  • Propane/propylene: Up 2.3 million barrels, but 7% below average

  • Total commercial petroleum inventories: Declined 0.7 million barrels

Product Demand

Demand remained relatively strong:

  • Total products supplied: Averaged 19.9 million barrels/day, up 0.4% year-over-year

  • Gasoline supplied: 8.7 million barrels/day, slightly down (0.4%) from last year

  • Distillate fuel supplied: 3.9 million barrels/day, up a robust 12.8%

  • Jet fuel supplied: Surged 13.8%, signaling increased air travel demand

Retail Fuel Prices

Prices continued their downward trend:

  • Regular gasoline: Averaged $3.141/gallon, down $0.027 from last week and $0.527 below last year

  • Diesel fuel: Averaged $3.534/gallon, down $0.045 week-over-week and $0.458 below year-ago levels

Looking Ahead

The report suggests a seasonal tightening in gasoline inventories even as production ramps up. Meanwhile, strong distillate and jet fuel demand reflects broader economic activity. Retail fuel prices remain considerably lower than in 2024, which could support continued consumer travel and freight movement into the summer.

Refiners appear to be preparing for peak season with increased utilization and production. However, below-average inventories in key product categories may make markets more sensitive to disruptions or spikes in demand.

Conclusion With gasoline inventories dropping and demand for jet and distillate fuels rising sharply, all eyes are on how refiners and importers respond heading into summer. Continued lower prices at the pump are welcome news for consumers, though tightening supply conditions warrant close monitoring.

Disclaimer: This blog post is for informational purposes only and should not be construed as financial advice. Always conduct thorough research and consider seeking advice from a financial professional before making any investment decisions.

Source: https://www.eia.gov/petroleum/supply/weekly/archive/2025/2025_04_23/pdf/highlights.pdf


Start futures forex fx commodity news trading with Haawks G4A low latency machine-readable data, one of the fastest data feeds for DOE data.

Please let us know your feedback. If you are interested in timestamps, please send us an email to sales@haawks.com.

Comment

Comment

24 ticks potential profit in 23 seconds on 17 April 2025, analysis on futures news trading natural gas on DOE Natural Gas Storage Report data

According to our analysis natural gas moved 24 ticks on DOE Natural Gas Storage Report data on 17 April 2025.

Natural gas (24 ticks)

Charts are exported from JForex (Dukascopy).


Natural Gas Market Update: Prices Decline Despite Regional Spikes and Supply Constraints
Week Ending April 16, 2025

This past week in the natural gas market saw a notable divergence between national and regional pricing trends, slight shifts in supply and demand dynamics, and continued robust activity in liquefied natural gas (LNG) exports.

Price Trends: National Benchmarks Down, Regional Prices Mixed

Henry Hub Prices:
The benchmark Henry Hub spot price dropped by $0.22, settling at $3.21/MMBtu. Futures prices followed suit, with the May 2025 NYMEX contract falling $0.57 to $3.247/MMBtu. The 12-month strip (May 2025–April 2026) also declined $0.34 to average $3.929/MMBtu.

Regional Spot Markets:
Spot price movements were varied. While the Algonquin Citygate saw a steep $0.66 drop, the Northwest Sumas hub surged $1.01 to $1.82/MMBtu, driven by cooler temperatures and a temporary outage at the Columbia Nuclear Generating Station. Southern California's SoCal Citygate also saw a $0.23 increase, coinciding with warmer weather and elevated cooling demand.

International LNG Markets:
East Asian LNG prices fell $0.45 to $12.40/MMBtu, while Dutch TTF futures dropped $0.39 to $11.35/MMBtu. Despite these decreases, both markets remain well above their year-ago levels.

Supply and Demand Dynamics

Supply:
Total U.S. natural gas supply dipped slightly by 0.1% to 106.3 Bcf/d. Dry production increased by 0.5 Bcf/d, but net imports from Canada fell 9.3%, or 0.6 Bcf/d—impacted in part by reduced flows into the Pacific Northwest.

Demand:
Overall consumption fell 6.9%, with the most significant drop in the residential/commercial sector (-14.1%). Power generation demand declined 5.4%, and industrial use slipped 1.4%. Exports to Mexico fell by 3.6%, while LNG feed gas deliveries rose modestly by 0.2 Bcf/d to 16.8 Bcf/d.

LNG Activity Remains Strong

Thirty-four LNG vessels departed U.S. terminals between April 10 and April 16, carrying a total capacity of 129 Bcf. Sabine Pass led departures with 10 vessels. Deliveries to South Louisiana terminals increased, while South Texas saw a minor decline.

Storage Levels Lag Behind Seasonal Norms

Net injections into storage were 16 Bcf—well below the five-year average of 50 Bcf and last year’s 46 Bcf. Total working stocks now sit at 1,846 Bcf, marking a 4% deficit against the five-year average and a 21% shortfall year-over-year.

Rig Count Shows Slight Rebalancing

The natural gas rig count rose by one to 97. Regional shifts included a gain in Haynesville and a drop in the Marcellus. The overall rig count (including oil and miscellaneous) fell to 583, down 34 from a year ago.

Conclusion:
Despite seasonal shifts in weather and slight production gains, the natural gas market continues to feel pressure from subdued demand and underwhelming storage injections. While regional price volatility reflects localized supply issues and temperature-driven demand, national and international markets are trending downward—pointing to a cautious short-term outlook.

Disclaimer: This blog post is for informational purposes only and should not be construed as financial advice. Always conduct thorough research and consider seeking advice from a financial professional before making any investment decisions.

Source: https://www.eia.gov/naturalgas/weekly/archivenew_ngwu/2025/04_17/


Start futures forex fx commodity news trading with Haawks G4A low latency machine-readable data, one of the fastest data feeds for DOE data.

Please let us know your feedback. If you are interested in timestamps, please send us an email to sales@haawks.com.

Comment

Comment

29 ticks potential profit in 29 seconds on 9 April 2025, analysis on futures news trading crude oil on DOE Petroleum Status Report data

According to our analysis crude oil moved 29 ticks on DOE Petroleum Status Report data on 9 April 2025.

Light sweet crude oil (29 ticks)

Charts are exported from JForex (Dukascopy).


U.S. Petroleum Market Snapshot – Week Ending April 4, 2025

The U.S. Energy Information Administration’s latest Weekly Petroleum Status Report offers a detailed overview of refinery activity, inventory shifts, import levels, and product supply trends. The data highlights a broadly steady refining environment with subtle but important changes in stock levels and product flows.

Refinery Activity

During the week ending April 4, 2025, U.S. crude oil refinery inputs averaged 15.6 million barrels per day. This represents a slight increase of 69,000 barrels per day compared to the previous week. Refineries operated at 86.7% of operable capacity, nearly unchanged from the prior week's 86.6%, but lower than the 88.3% level recorded during the same period last year.

Production of key refined products showed a week-over-week decline. Motor gasoline production averaged 8.9 million barrels per day, while distillate fuel oil production averaged 4.7 million barrels per day—both lower than the previous week’s figures and also below year-ago levels.

Crude Oil and Product Imports

U.S. crude oil imports averaged 6.2 million barrels per day, a decrease of 277,000 barrels per day from the prior week. Over the last four weeks, imports have averaged 6.1 million barrels per day, 6.9% less than during the same period last year.

Motor gasoline imports last week averaged 778,000 barrels per day, while distillate fuel imports came in at 69,000 barrels per day.

Net imports over the past four weeks averaged:

  • Crude oil: 1.96 million barrels per day

  • Petroleum products: -4.95 million barrels per day

  • Total: -2.98 million barrels per day

Inventory Changes

Commercial crude oil inventories, excluding those in the Strategic Petroleum Reserve (SPR), increased by 2.6 million barrels, reaching a total of 442.3 million barrels. This level is approximately 5% below the five-year average for this time of year.

Motor gasoline inventories decreased by 1.6 million barrels to 236.0 million barrels, which is in line with the five-year average. Within that category, finished gasoline stocks increased, while blending component inventories decreased.

Distillate fuel inventories dropped significantly, falling by 3.5 million barrels to 111.1 million barrels. These inventories are now about 9% below the five-year average. Propane/propylene inventories rose by 1.5 million barrels but remain 5% below the seasonal norm.

Total commercial petroleum inventories increased modestly by 1.2 million barrels over the week.

Product Supplied

The four-week average for total products supplied—a proxy for demand—was 19.6 million barrels per day, down 1.9% compared to the same period last year.

Motor gasoline product supplied averaged 8.6 million barrels per day over the past four weeks, down 2.8% from the same period last year. In contrast, distillate fuel oil product supplied rose by 7.3% to 3.8 million barrels per day. Jet fuel product supplied also increased, up 5.2% year-over-year.

This data reflects ongoing structural shifts in supply and demand across key fuel categories and underscores the importance of monitoring both production levels and inventory trends.

Disclaimer: This blog post is for informational purposes only and should not be construed as financial advice. Always conduct thorough research and consider seeking advice from a financial professional before making any investment decisions.

Source: https://www.eia.gov/petroleum/supply/weekly/archive/2025/2025_04_09/pdf/highlights.pdf


Start futures forex fx commodity news trading with Haawks G4A low latency machine-readable data, one of the fastest data feeds for DOE data.

Please let us know your feedback. If you are interested in timestamps, please send us an email to sales@haawks.com.

Comment

Comment

27 ticks potential profit in 26 seconds on 3 April 2025, analysis on futures forex fx news trading natural gas on DOE Natural Gas Storage Report data

According to our analysis natural gas moved 27 ticks on DOE Natural Gas Storage Report data on 3 April 2025.

Natural gas (27 ticks)

Charts are exported from JForex (Dukascopy).


Weekly Natural Gas Storage Report: Bearish Signal as Storage Builds, Prices Slip

Published April 5, 2025

Natural Gas Slips as Storage Climbs—Is a Bearish Trend Setting In?

Traders keeping a close eye on the EIA's Weekly Natural Gas Storage Report just got a fresh signal—and it’s leaning bearish.

For the week ending March 28, 2025, working gas in storage across the Lower 48 increased by 29 Bcf, bringing total inventories to 1,773 Bcf. This marks a steady build from the prior week’s 1,744 Bcf and sends a clear message: demand isn’t outpacing supply just yet.

The market reacted accordingly—natural gas futures slid 27 ticks on the report release. With warmer spring temps starting to roll in and injection season underway, traders are now weighing the potential for additional downside in the weeks ahead.

Key Takeaways from the Report:

  • Total Storage: 1,773 Bcf (+29 Bcf week-over-week)

  • Year-over-Year Deficit: -491 Bcf vs. March 28, 2024

  • 5-Year Average Gap: -80 Bcf

  • Regions Seeing Gains:

    • South Central led with a 33 Bcf build

    • Pacific and Mountain regions also saw increases

  • Declines Noted:

    • East (-14 Bcf) and Midwest (-3 Bcf) showed drawdowns, but not enough to offset overall builds

What This Means for Traders:

Despite inventories still being below the 5-year average, the consistent builds—and especially the strength from the South Central region—are signaling a pivot from withdrawal season into a more storage-heavy pattern. That’s typically bearish unless unexpected weather shifts or LNG exports shake up demand.

The fact that natural gas dropped 27 ticks post-release reinforces that sentiment. Traders are likely seeing this as confirmation that supply is adequate for now.

Price Action & Market Outlook:

This 27-tick drop could be the start of a broader move if upcoming reports show continued builds. With total stocks still within the 5-year historical range, the downside may have room to run unless production slows or cooling demand picks up unexpectedly.

Watchlist for Next Week:

  • April 10, 2025: Next storage report

  • Weather forecasts—any late-season cold could shift the tone

  • LNG export data—still a wild card for demand strength

Source: https://ir.eia.gov/ngs/ngs.html


Start futures forex fx commodity news trading with Haawks G4A low latency machine-readable data, one of the fastest data feeds for DOE data.

Please let us know your feedback. If you are interested in timestamps, please send us an email to sales@haawks.com.

Comment

Comment

35 ticks potential profit in 16 seconds on 12 December 2024, analysis on futures forex fx news trading natural gas on DOE Natural Gas Storage Report data

According to our analysis natural gas moved 35 ticks on DOE Natural Gas Storage Report data on 12 December 2024.

Natural gas (35 ticks)

Charts are exported from JForex (Dukascopy).


Weekly Natural Gas Storage Report Analysis for December 6, 2024

Released: December 12, 2024
Next Release: December 19, 2024

The Energy Information Administration (EIA) has released its latest Weekly Natural Gas Storage Report for the week ending December 6, 2024. This report provides valuable insights into natural gas inventories across the United States, helping analysts, traders, and policymakers understand supply and demand dynamics during the winter season.

Key Highlights

  • Total Working Gas in Storage: 3,747 billion cubic feet (Bcf)

  • Net Decrease: 190 Bcf from the previous week’s total of 3,937 Bcf

  • Year-Over-Year Comparison: 67 Bcf higher than the same period last year

  • Five-Year Average Comparison: 165 Bcf above the five-year average of 3,582 Bcf

At 3,747 Bcf, the current storage levels remain within the five-year historical range, indicating a relatively balanced inventory despite a notable weekly draw.

Summary of Regional Trends

  • East Region: The East saw a significant withdrawal of 58 Bcf, bringing current stocks to 856 Bcf. Compared to last year and the five-year average, this is a modest decrease of 0.7% and 0.3%, respectively.

  • Midwest Region: The Midwest experienced a 60 Bcf drawdown, reducing storage to 1,055 Bcf. Inventories are 0.8% lower than last year but still 1.9% above the five-year average.

  • Mountain Region: Despite a relatively small withdrawal of 7 Bcf, the Mountain region’s storage levels remain robust at 282 Bcf. This represents a 15.6% increase over last year and a 33% increase over the five-year average.

  • Pacific Region: The Pacific region saw an 8 Bcf draw, ending the week at 302 Bcf. Stocks are 4.5% higher than a year ago and 11.9% above the five-year average.

  • South Central Region: This region had the largest total withdrawal of 59 Bcf, bringing the total to 1,251 Bcf. Salt facilities contributed a 22 Bcf decline, while nonsalt facilities saw a 37 Bcf reduction. Despite the draw, stocks remain 2.4% higher than last year and 3.6% above the five-year average.

Key Insights and Market Implications

  1. Seasonal Draws Begin to Ramp Up: With winter demand in full swing, withdrawals are accelerating. The total net decrease of 190 Bcf underscores the increased consumption driven by colder weather.

  2. Healthy Inventories: Despite significant weekly draws, storage levels are still above both last year’s figures and the five-year average. This suggests a cushion against potential supply disruptions during peak winter demand.

  3. Regional Variations: The Mountain and Pacific regions continue to show robust storage levels compared to historical averages, while the East and Midwest are experiencing tighter supplies.

  4. Potential Market Impact: These storage dynamics can influence natural gas prices. Continued draws at this pace may push prices higher, particularly if cold weather persists.

Looking Ahead

The next report, scheduled for December 19, 2024, will provide further insights into how winter demand is impacting natural gas inventories. As we move deeper into the season, monitoring these weekly changes will be critical for assessing market stability and price trends.

Stay tuned for more updates and analysis!

Source: https://ir.eia.gov/ngs/ngs.html


Start futures forex fx commodity news trading with Haawks G4A low latency machine-readable data, one of the fastest data feeds for DOE data.

Please let us know your feedback. If you are interested in timestamps, please send us an email to sales@haawks.com.

Comment

Comment

34 ticks potential profit in 48 seconds on 24 October 2024, analysis on futures forex fx news trading natural gas on DOE Natural Gas Storage Report data

According to our analysis natural gas moved 34 ticks on DOE Natural Gas Storage Report data on 24 October 2024.

Natural gas (38 ticks)

Charts are exported from JForex (Dukascopy).


Weekly Natural Gas Storage Report: October 18, 2024 – Key Highlights and Insights

As we approach the colder months, the latest Weekly Natural Gas Storage Report released by the U.S. Energy Information Administration (EIA) offers crucial insights into the current state of natural gas reserves. For the week ending October 18, 2024, working gas in underground storage across the Lower 48 states reached 3,785 billion cubic feet (Bcf), representing a net increase of 80 Bcf compared to the previous week. This puts total storage levels 106 Bcf higher than the same period last year and 167 Bcf above the five-year average.

Regional Breakdown and Implied Flows

The report highlights steady growth in gas reserves across various regions:

  • East Region: The working gas in storage increased by 8 Bcf to reach 901 Bcf, which is slightly below last year’s figure of 905 Bcf, representing a small 0.4% decrease. However, it remains 1.9% above the five-year average of 884 Bcf.

  • Midwest Region: A significant uptick of 21 Bcf brought storage to 1,088 Bcf. This represents a 1.9% increase from last year and a 3.0% increase over the five-year average of 1,056 Bcf, signaling healthy storage levels in this critical region.

  • Mountain Region: Although the region saw a smaller increase of 4 Bcf, its reserves now stand at 291 Bcf, marking a substantial 15.9% growth compared to last year and a 30.5% rise over the five-year average, which sits at 223 Bcf. This is one of the most pronounced increases of all regions.

  • Pacific Region: With an additional 7 Bcf, the Pacific region’s gas reserves are now at 300 Bcf. This is 6.4% higher than last year’s 282 Bcf and 6.8% above the five-year average of 281 Bcf.

  • South Central Region: The largest weekly net change came from the South Central region, where storage levels increased by 39 Bcf, reaching a total of 1,205 Bcf. This includes a 21 Bcf increase in salt-dome storage, now at 314 Bcf, and a 19 Bcf increase in nonsalt storage, bringing that total to 891 Bcf. The region is performing 2.7% better than last year and is 2.6% above the five-year average.

Total Storage and Implications

At 3,785 Bcf, total working gas in storage is comfortably within the five-year historical range. This storage level provides a cushion as we head into the winter heating season, where demand typically spikes. The net increase of 80 Bcf from the prior week is a healthy signal that the market is preparing adequately for potential weather-driven demand surges in the coming months.

The 106 Bcf year-over-year surplus and 167 Bcf surplus over the five-year average indicate robust storage levels, which should help moderate price volatility as temperatures drop and heating demand rises. With winter approaching, natural gas storage figures will be critical in determining price stability and supply adequacy in the coming months.

Key Takeaways:

  1. Healthy Storage Levels: The 3,785 Bcf in storage positions the market well for the winter season, with a notable 106 Bcf increase over last year.

  2. Regional Variations: Some regions, like the Mountain and Pacific, are showing significant year-over-year increases, reflecting improved storage capabilities and preparedness.

  3. Implied Flow of 80 Bcf: The overall weekly increase of 80 Bcf is consistent with seasonal storage trends and ensures a stable supply going into winter.

  4. Price and Supply Outlook: With storage levels above historical averages, there’s a strong foundation to mitigate supply concerns and manage price spikes that may arise from unexpected weather events or surges in demand.

The next release on October 31, 2024, will offer further insight as we monitor natural gas reserves closely during this critical period. Stay tuned for updates, as storage dynamics play a crucial role in the natural gas market and energy planning throughout the winter season.

Source: https://ir.eia.gov/ngs/ngs.html


Start futures forex fx commodity news trading with Haawks G4A low latency machine-readable data, one of the fastest data feeds for DOE data.

Please let us know your feedback. If you are interested in timestamps, please send us an email to sales@haawks.com.

Comment