
According to our analysis crude oil moved 39 ticks on DOE Weekly Petroleum Status Report (WPSR) data on 10 September 2026.
WTI crude oil (30 ticks)
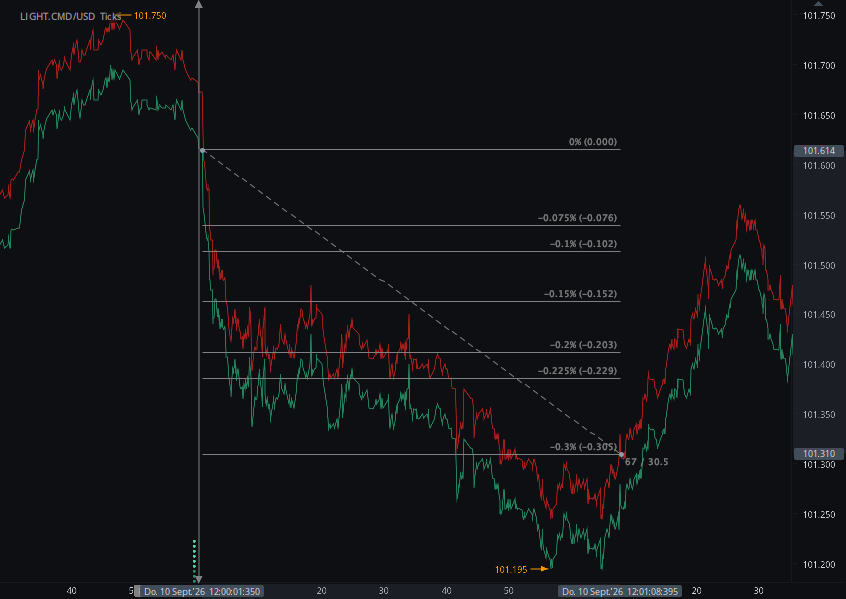
Charts are exported from JForex (Dukascopy).
Early EIA Petroleum Data Sends WTI Crude Oil Down 30 Ticks
The market reacted to EIA's early Weekly Petroleum Status Report data before publication of the full report, as a smaller-than-expected crude draw and surprise gasoline and distillate builds delivered a bearish inventory signal.
On September 10, 2026, WTI crude oil reacted immediately when the first EIA Weekly Petroleum Status Report data became available at 12:00 p.m. ET — before publication of the complete report later in the day.
The early EIA overview and petroleum tables already contained the high-value fields news traders needed to assess the release: commercial crude stocks, gasoline, distillates, Cushing inventories, refinery inputs and utilization, production, imports, exports and product supplied.
Commercial crude stocks declined by only 391,000 barrels, substantially less than the approximately 1.55 million-barrel draw expected in a Reuters analyst survey.
At the same time, gasoline and distillate inventories unexpectedly increased, reinforcing the initial bearish interpretation.
Why the Early EIA Release Matters to News Traders
The important distinction: EIA does not require traders to wait for the complete Weekly Petroleum Status Report before key petroleum statistics become available.
The early release includes the WPSR summary, overview and core statistical tables. The remaining full-report PDF and HTML material is published later.
For traditional analysis, waiting for the complete report may make little difference. For latency-sensitive news trading, however, the distinction is critical.
The market can begin repricing as soon as the key inventory and supply fields become public. By the time a trader manually opens and reads the complete report, part of the initial market reaction may already have taken place.
HAAWKS view: for WPSR news trading, the relevant event is the first public dissemination of the market-moving data — not the later appearance of the full formatted report.
Key Inventory Surprises at 12:00 p.m. ET
| Inventory Field | Market Estimate | Actual | Surprise | News-Trader Read |
|---|---|---|---|---|
| Commercial Crude Oil |
−1.55M
Reuters survey |
−0.391M | Smaller draw | Bearish relative to expectations despite the negative headline inventory change. |
| Gasoline |
−1.09M
StreetInsider estimate |
+1.269M | Build vs. expected draw | A large bearish swing relative to expectations. |
| Distillates |
−0.632M
StreetInsider estimate |
+2.087M | Build vs. expected draw | Another clear bearish product-inventory surprise. |
| Cushing, Oklahoma | — | −0.684M | Draw | A bullish counter-signal because Cushing is the delivery point for NYMEX WTI futures. |
WTI Falls 30 Ticks on the Early Data
HAAWKS tick-chart analysis recorded an immediate downside reaction as the petroleum figures entered the market.
HAAWKS measured the move following the 12:00 p.m. ET early EIA petroleum-data release on September 10, 2026.
The reaction illustrates an important principle in petroleum news trading: a negative crude-stock number is not automatically bullish.
What matters is the difference between the actual data and what the market had already priced in.
Traders expected a materially larger crude draw. Instead, inventories fell by only 391,000 barrels. Gasoline and distillates simultaneously moved in the opposite direction from expectations and posted inventory builds.
What Was Already Available in the Early Overview?
The early EIA overview contained considerably more information than the three headline inventory figures.
| Early-Release Data Point | Current Week | Previous Week | Change / Context |
|---|---|---|---|
| Commercial Crude Stocks | 424.1M barrels | 424.5M barrels | Approximately −0.4M barrels |
| Cushing Crude Stocks | 21.8M barrels | 22.5M barrels | Approximately −0.7M barrels |
| Gasoline Stocks | 206.9M barrels | 205.7M barrels | Approximately +1.3M barrels |
| Distillate Stocks | 106.3M barrels | 104.2M barrels | Approximately +2.1M barrels |
| Total Commercial Petroleum Stocks Ex-SPR | 1,248.6M barrels | 1,242.3M barrels | +6.3M barrels |
| Refinery Crude Inputs | 17.586M b/d | 17.496M b/d | +91K b/d |
| Refinery Utilization | 97.8% | 98.0% | Refineries remained near very high utilization levels. |
| U.S. Crude Production | 13.947M b/d | 13.862M b/d | +85K b/d |
In other words, a news-trading system did not need the later full report to know that crude inventories disappointed expectations, product inventories built, Cushing drew, refinery utilization remained very high and U.S. crude production increased.
Imports, Exports and Supply Added More Context
The early overview also showed a material change in crude trade flows.
| Crude Supply Measure | Current Week | Previous Week | Weekly Change |
|---|---|---|---|
| Crude Imports | 6.824M b/d | 6.770M b/d | +53K b/d |
| Crude Exports | 3.417M b/d | 4.483M b/d | −1.066M b/d |
| Net Crude Imports | 3.407M b/d | 2.287M b/d | +1.119M b/d |
The large decline in crude exports and increase in net imports helped explain why domestic commercial crude stocks registered only a small draw despite exceptionally high refinery runs.
Demand Indicators Were Also Available Before the Full Report
The overview included product-supplied statistics, giving news traders an immediate view of implied petroleum demand.
| Product Supplied | Latest Week | Four-Week Average | Four-Week YoY |
|---|---|---|---|
| Total Products | 19.313M b/d | 20.119M b/d | −3.7% |
| Finished Motor Gasoline | 8.551M b/d | 8.801M b/d | −1.4% |
| Distillate Fuel Oil | 3.678M b/d | 3.715M b/d | −2.6% |
| Jet Fuel | 1.785M b/d | 1.731M b/d | −2.3% |
Why the Initial WTI Signal Was Bearish
Crude Drew Less Than Expected
The market expected a substantially larger decline in commercial crude stocks. A 391K draw was therefore bearish relative to the consensus expectation despite being a draw in absolute terms.
Gasoline Swung to a Build
Gasoline inventories increased by approximately 1.27M barrels versus expectations for a decline. That created one of the clearest bearish surprises in the early data.
Distillates Also Built
Distillate inventories increased by approximately 2.09M barrels rather than posting the expected draw, reinforcing the product-side bearish signal.
Total Commercial Stocks Rose
Total commercial petroleum inventories excluding the Strategic Petroleum Reserve increased by 6.3M barrels during the week, providing broader evidence of inventory accumulation.
But the Release Was Not Bearish in Every Detail
Professional news traders also had to process several opposing signals.
Cushing inventories fell by approximately 684,000 barrels, which was supportive for WTI because Cushing is the NYMEX crude futures delivery point.
Refineries were also operating at a very high 97.8% utilization rate, with crude inputs of 17.586 million barrels per day.
Meanwhile, early EIA summary information showed gasoline and distillate inventories still below their respective five-year seasonal averages despite the week's builds.
HAAWKS view: the dominant immediate surprise was bearish because crude missed the expected draw and both major refined-product categories built. However, the Cushing draw and historically tight product inventories provided counter-signals that a complete trading model should not ignore.
What This Release Shows Professional News Traders
The Market Does Not Wait for the Full PDF
The key trading information was already public in the early overview, summary and statistical tables. The later complete report added presentation and additional context, but the principal inventory surprises were already available to the market.
Machine-Readable Fields Matter
A WPSR strategy may need to process crude inventories, Cushing stocks, gasoline, distillates, production, refinery utilization, imports, exports and product supplied at virtually the same time.
Consensus Is Essential
A crude draw is not automatically bullish. The 391K decline was bearish relative to expectations because traders had positioned for a much larger draw.
Different Fields Can Conflict
National crude and product inventories produced a bearish initial signal, while Cushing inventories produced a bullish one. News traders need rules for weighting conflicting data rather than reacting to only one field.
Low Latency Is About the First Public Data
For latency-sensitive trading, the relevant workflow begins when the earliest official data become available. Waiting for a later formatted report can mean waiting until after the first market repricing has already occurred.
The 30-Tick Reaction Was Not the Full-Day Oil Story
HAAWKS measured approximately 30 ticks of downside WTI movement in response to the early EIA data.
That should be separated from the broader September 10 oil session. Global crude prices were simultaneously being driven by severe geopolitical supply risks.
WTI ultimately settled above $100 per barrel and rose more than 6% on the day as attacks on shipping and Middle Eastern energy infrastructure increased concerns about global supply disruptions.
News-trading distinction: a release-window move measures the immediate repricing caused by a specific data event. It does not necessarily predict the direction of the market for the remainder of the trading session.
HAAWKS Conclusion
The September 10 EIA release provides a useful example of why publication timing matters for professional news traders.
The market-moving petroleum data were available at 12:00 p.m. ET, before publication of the complete Weekly Petroleum Status Report.
Commercial crude stocks declined by 391,000 barrels, considerably less than expected. Gasoline inventories increased by 1.269 million barrels, while distillate stocks rose by 2.087 million barrels.
Total commercial petroleum stocks excluding the SPR increased by 6.3 million barrels, while Cushing crude stocks provided a counter-signal with a roughly 684,000-barrel draw.
HAAWKS measured approximately 30 ticks of immediate downside movement in WTI crude oil following the early release.
For professional news traders, the lesson is straightforward: the trading event begins when the first official machine-readable information enters the market — not when the complete report becomes convenient to read manually.
Trade smart. Stay informed. Stay ahead.
Low-Latency Data for Professional News Traders
HAAWKS G4A provides low-latency machine-readable U.S. macroeconomic and commodity data, together with macroeconomic data covering Canada and Europe.
Data is delivered in structured machine-readable format via API access in Chicago, New York and London, supporting professional and latency-sensitive automated news-trading applications.
Free trials are available for qualified professional users.
Explore HAAWKS G4A Low-Latency DataSources
-
U.S. Energy Information Administration —
Weekly Petroleum Status Report
Official EIA source for the September 10, 2026 petroleum data covering the week ending September 4. -
EIA — Weekly Petroleum Status Report Release Schedule
EIA publication schedule explaining the earlier release of the WPSR summary, overview and core tables ahead of the remaining full-report PDF and HTML files. -
Reuters — September 10, 2026 Oil Market Report
Source for the Reuters analyst expectation of a 1.55M-barrel crude draw and broader oil-market context. -
StreetInsider — EIA Inventory Release, September 10, 2026
Timestamped at 12:00 p.m. EDT and used for the product inventory consensus estimates: gasoline −1.09M barrels and distillates −0.632M barrels. -
HAAWKS internal tick-chart analysis — September 10, 2026
Source for the measured immediate 30-tick WTI crude oil reaction.
Built for traders who compete on speed. HAAWKS G4A delivers low-latency, machine-readable macroeconomic and commodity data via API infrastructure in Chicago, New York and London. Explore the feed, share your feedback, or contact us to request a free trial for qualified professionals.
