Viewing entries tagged
USDCAD

Comment

Canada Labour Force Survey: USD/CAD Rises 32 Pips After 68,000 Employment Decline

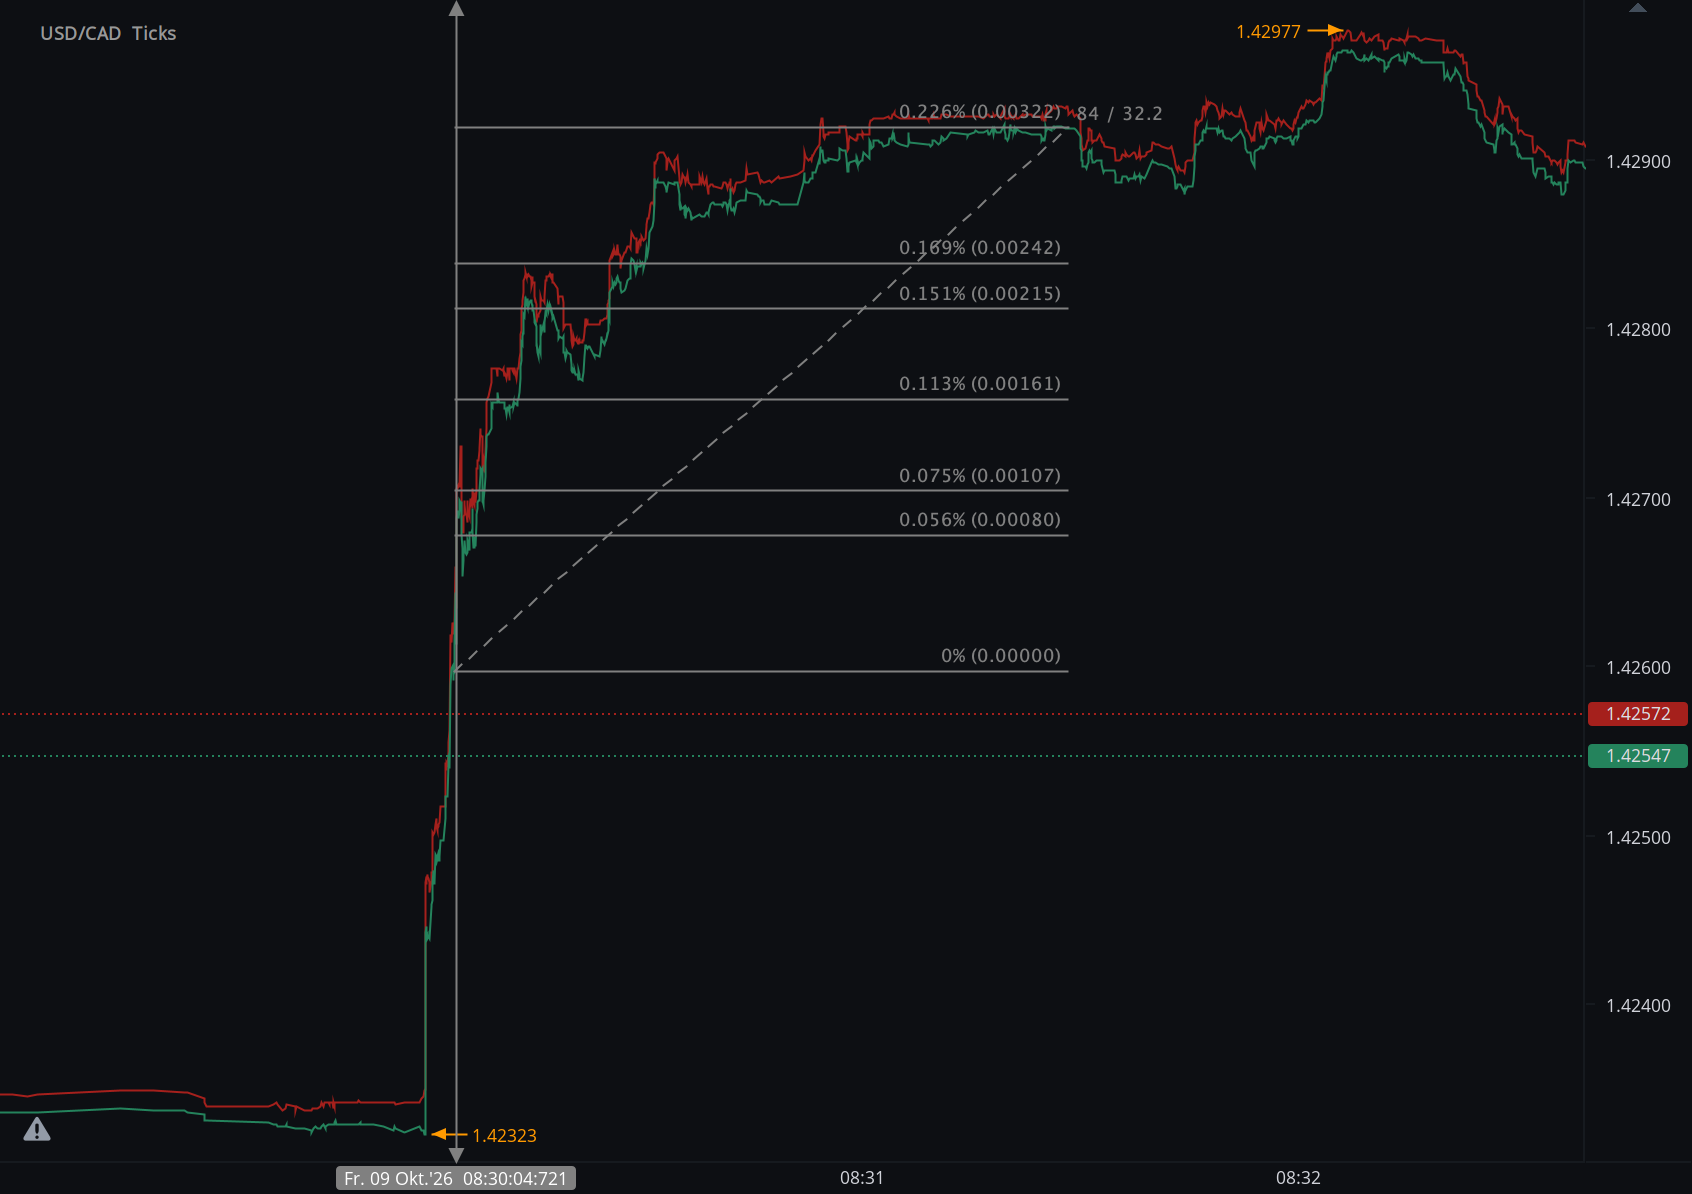
According to our analysis USD/CAD moved 32 pips on Canada Labour Force Survey (LFS) data on 9 October 2026.

USD/CAD (32 pips)
Charts are exported from JForex (Dukascopy).


HAAWKS Research

Canada Labour Force Survey: USD/CAD Rises 32 Pips as Employment Falls 68,000

Canada's September labour report delivered a substantial downside employment surprise, weakening the Canadian dollar and prompting an immediate repricing of Bank of Canada expectations.

9 October 2026 • Release time: 8:30 a.m. ET • Statistics Canada Labour Force Survey • USD/CAD +32 pips

Statistics Canada's September 2026 Labour Force Survey delivered a considerably weaker employment result than markets had expected, producing an immediate repricing in the Canadian dollar and domestic rate expectations.

Canadian employment declined by approximately 68,000 in September, following a decline of roughly 42,000 in August.

A Reuters survey of economists had anticipated an increase of 9,200 jobs. The difference between the reported result and the survey average was therefore approximately 77,500 jobs to the downside.

The unemployment rate increased by 0.1 percentage point to 6.5%, matching the Reuters consensus forecast. The employment surprise, rather than the unemployment-rate headline, was therefore the clearest deviation from pre-release expectations.

HAAWKS release-window measurement: USD/CAD rose approximately 32 pips following publication of the September Labour Force Survey, reflecting an immediate weakening of the Canadian dollar against the U.S. dollar.

Immediate USD/CAD Market Response

USD/CAD Release-Window Movement

+32 Pips

HAAWKS measured a rapid upward repricing in USD/CAD after the 8:30 a.m. ET publication.

A rise in USD/CAD corresponds to a weaker Canadian dollar relative to the U.S. dollar. The measurement represents market movement around the release, not necessarily achievable trading P&L.

The HAAWKS tick-level chart shows the currency pair moving sharply higher immediately after publication as the market incorporated the weaker employment data.

Reuters subsequently reported that USD/CAD traded as high as approximately 1.4298, corresponding to the weakest level for the Canadian dollar against the U.S. dollar since April 2025.

The broader session move therefore remained directionally consistent with the initial release-window response measured by HAAWKS.

Actual Data vs. Pre-Release Expectations

Indicator Previous Reuters Consensus September Actual Release Signal
Employment Change −41.7K +9.2K −68.3K Large downside surprise
Unemployment Rate 6.4% 6.5% 6.5% In line
Participation Rate 65.0% — 64.8% −0.2 ppt
Employment Rate 60.8% — 60.6% −0.2 ppt
Average Hourly Wages +2.0% YoY — +2.3% YoY Wage growth accelerated
HAAWKS view: the employment headline carried the dominant surprise. The unemployment rate itself matched the Reuters survey, while wage growth accelerated. The release was therefore not uniformly weak across every field, but the scale of the employment decline provided a clear negative labour-demand signal.

The Composition of the Employment Decline

The headline decline was broad enough to matter beyond a single employment category.

Full-time employment fell by approximately 35,000, while part-time employment declined by approximately 33,000.

Total Employment −68K September monthly change
Full-Time −35K −0.2% month over month
Part-Time −33K −0.9% month over month
Employment Rate 60.6% Down 0.2 percentage point

September represented a second consecutive monthly employment decline. Statistics Canada reported employment down by approximately 42,000 in August after gains earlier in the year.

Despite the recent weakness, total employment remained approximately 95,000 higher than one year earlier, an increase of about 0.5%.

Public-Sector Employment Drives Much of the Weakness

One of the most important details beneath the national headline was the continued decline in public-sector employment.

Statistics Canada reported that the number of public-sector employees fell by approximately 70,000 in September, or 1.5%.

This represented a fourth consecutive monthly decline in public-sector employment. Compared with September 2025, the number of public-sector employees was down approximately 119,000.

Private-sector employment was little changed during the month, while self-employment edged down by approximately 23,000.

Class of Worker September Change Year-on-Year Context
Public Sector −70K −119K / −2.6%
Private Sector Little changed +163K / +1.2%
Self-Employment −23K +51K / +1.9%

Employment Weakness Concentrated in Several Major Industries

The industry breakdown showed losses across education, health-related services and manufacturing.

Industry September Employment Change Monthly Percentage Change
Educational Services −35K −2.2%
Health Care & Social Assistance −23K −0.8%
Manufacturing −13K −0.7%
Other Services +17K +2.1%

Manufacturing is particularly relevant for macro analysis given its exposure to cross-border trade and U.S.-Canada economic conditions. However, the largest monthly losses were recorded in educational services and health care and social assistance.

Participation Falls to 64.8%

The labour-force participation rate declined by 0.2 percentage point to 64.8%.

Statistics Canada noted that this was the lowest participation rate since December 1997, excluding the exceptional conditions during 2020.

The agency emphasized that population aging is an important structural contributor to the decline in participation.

People aged 65 and older represented 23.2% of the working-age population in September 2026, compared with 20.5% in September 2019.

Analytical distinction: a decline in participation can limit the increase in the unemployment rate even when employment falls materially. For real-time interpretation, employment, unemployment and participation therefore need to be processed together rather than treated as independent headlines.

Youth Employment Accounts for a Significant Share of the Decline

Employment among people aged 15 to 24 fell by approximately 48,000, or 1.8%, in September.

It was the second consecutive monthly decline for youth employment. Over August and September combined, youth employment decreased by approximately 67,000.

The number of young people participating in the labour force also declined, helping keep the youth unemployment rate broadly unchanged at approximately 13.0%.

This is another example of why the unemployment rate alone can provide an incomplete reading of labour-market momentum.

Regional Labour-Market Divergence

Employment weakness was not evenly distributed across Canada.

Province Employment Change Monthly Change Unemployment Rate
Quebec −49K −1.1% 6.0%
British Columbia −20K −0.7% 6.4%
Ontario −20K −0.2% 7.0%
Alberta +23K +0.9% 6.4%

Quebec recorded the largest provincial employment decline, while Alberta moved in the opposite direction with an increase of approximately 23,000 jobs.

Wage Growth Prevents an Unambiguously Soft Reading

Average hourly wages among employees increased 2.3% year over year in September, compared with 2.0% in August.

The average hourly wage level increased by approximately $0.86 to $37.64 from a year earlier.

From a monetary-policy perspective, that detail matters. Employment growth weakened substantially, but wage growth did not simultaneously decelerate.

The report therefore contained a strong negative employment surprise alongside a somewhat firmer wage signal.

Bank of Canada Expectations Reprice

The currency response was accompanied by a shift in Canadian interest-rate expectations.

Reuters reported that investors reduced the implied probability of a Bank of Canada rate increase at the October meeting to approximately 25%, from around 40% before the employment report.

Canadian government bond yields also moved lower as markets incorporated a weaker near-term labour outlook.

This transmission mechanism is central to understanding the USD/CAD response:

Employment Surprise

Employment fell substantially instead of delivering the modest increase expected by the Reuters survey.

Policy Expectations

A weaker labour backdrop reduced the market-implied probability of near-term Bank of Canada tightening.

Canadian Rates

Lower policy expectations were accompanied by lower Canadian government bond yields.

FX Transmission

The resulting relative-rate repricing was consistent with a weaker Canadian dollar and higher USD/CAD.

Why the Labour Force Survey Requires Multi-Field Processing

The September release demonstrates why professional real-time economic data infrastructure cannot rely on a single headline field.

Within one publication, the market received information on employment, unemployment, participation, full-time and part-time work, wages, public and private employment, industry-level changes, demographics and regional labour markets.

Data Field September Reading Why It Matters
Employment Change −68K Primary measure of monthly labour demand and the largest consensus surprise.
Unemployment Rate 6.5% Important policy variable, but matched the cited consensus.
Participation Rate 64.8% Helps explain movements in unemployment and labour supply.
Full-Time / Part-Time −35K / −33K Shows the composition and breadth of employment changes.
Wage Growth +2.3% YoY Adds information relevant to domestic inflation pressure and monetary policy.
Industry Breakdown Education, health care and manufacturing lower Helps distinguish broad labour weakness from isolated sector volatility.

Implications for Event-Driven Macro Strategies

Consensus Is Part of the Information Set

Employment falling by 68,300 is economically relevant on its own, but its immediate market significance was amplified by the fact that economists surveyed by Reuters had expected an increase of 9,200.

The approximately 77,500-job gap between actual and expected employment provided the clearest quantitative surprise in the release.

Not Every Field Pointed in the Same Direction

Employment was substantially weaker, participation declined and the employment rate fell. At the same time, unemployment matched the consensus estimate and wage growth accelerated.

Automated interpretation therefore benefits from evaluating multiple fields rather than assigning a directional signal from one headline.

Cross-Market Confirmation Matters

The Canadian dollar weakened while domestic yields declined and expectations for near-term Bank of Canada tightening were reduced. That cross-market response provides additional context for the initial USD/CAD move.

The Immediate Window Should Be Separated from the Session

HAAWKS measured approximately 32 pips of USD/CAD movement around the release itself.

Later session prices reflected not only the original Labour Force Survey but also subsequent liquidity, broader U.S. dollar movement, commodity prices, positioning and other market information.

Release Vintage Matters

Historical systematic research is most robust when it preserves the exact values, expectations and timestamps available when the release became public rather than relying solely on later databases.

HAAWKS Conclusion

Canada's September Labour Force Survey delivered a substantial downside employment surprise.

Employment fell by approximately 68,000, compared with a Reuters consensus forecast for an increase of 9,200.

The unemployment rate increased to 6.5%, matching expectations, while labour-force participation declined to 64.8%.

Employment weakness was distributed across full-time and part-time work and was particularly visible in public-sector employment, educational services, health care and social assistance, manufacturing and youth employment.

Wage growth provided a countervailing signal, accelerating to 2.3% year over year.

HAAWKS measured USD/CAD approximately 32 pips higher during the immediate release window as the Canadian dollar weakened and markets reduced expectations for near-term Bank of Canada tightening.

For professional market infrastructure, the release reinforces the importance of combining official data, consensus expectations, supporting labour-market fields and precise timestamps in one structured real-time framework.

Real-Time Data. Structured Intelligence. Professional Markets.

Real-Time Canadian Economic Data

HAAWKS G4A provides low-latency, structured macroeconomic and commodity data covering the United States, Canada and Europe.

The feed supports systematic strategies, professional trading desks and latency-sensitive applications requiring field-level economic data as official releases become public.

API access is available through infrastructure in Chicago, New York and London. Free trials are available for qualified professional users.

Explore HAAWKS G4A Low-Latency Data

Sources

  1. Statistics Canada — Labour Force Survey, September 2026
    Official source for employment, unemployment, participation, wage, industry, demographic and provincial labour-market data.
  2. Reuters — Canada's Employment Unexpectedly Shrinks in September
    Source for the pre-release economist survey: employment +9,200 expected and unemployment rate 6.5% expected, as well as initial market reaction.
  3. Reuters — Canadian Dollar Hits 18-Month Low as Jobs Data Clips Rate-Hike Bets
    Source for subsequent Canadian-dollar performance and changes in market-implied Bank of Canada policy expectations.
  4. HAAWKS internal tick-level market analysis — 9 October 2026
    Source for the measured immediate release-window movement of USD/CAD +32 pips.
Data note: Statistics Canada figures are official published statistics. Pre-release expectations are based on the Reuters economist survey referenced above and may differ from estimates published by other providers. HAAWKS market-movement figures are internal release-window measurements.

Disclaimer: This material is provided for informational and research purposes only and does not constitute financial advice, investment advice or a recommendation to buy or sell any financial instrument. The 32-pip USD/CAD movement represents historical market movement measured around the release and does not represent guaranteed or necessarily achievable trading profit. Actual execution depends on market-data latency, processing latency, liquidity, spreads, slippage, order type, execution venue and risk management. Past market behavior is not indicative of future results.

Built for traders who compete on speed. HAAWKS G4A delivers low-latency, machine-readable macroeconomic and commodity data via API infrastructure in Chicago, New York and London. Explore the feed, share your feedback, or contact us to request a free trial for financial institutions.

Comment

Comment

20 pips potential profit in 61 seconds on 30 April 2024, analysis on futures forex fx news trading USDCAD on Canada GDP data

According to our analysis USDCAD moved 20 pips on Canada Gross Domestic Product (GDP) data on 30 April 2024.

USDCAD (20 pips)

Charts are exported from JForex (Dukascopy).


Analyzing the Nuances of Canada's GDP Growth in February 2024

In February 2024, Canada's real Gross Domestic Product (GDP) witnessed a modest increase of 0.2%, maintaining a stable yet slower growth compared to the 0.5% rise observed in January. This growth was primarily driven by the services-producing industries, with notable performances in transportation and warehousing sectors.

Sectoral Highlights of February's GDP Growth

Transportation and Warehousing Take the Lead

The transportation and warehousing sector showcased a significant growth of 1.4%, marking the largest monthly growth rate since January 2023. A notable rebound in rail transportation, which surged by 5.5%, played a critical role in this expansion. The uplift in rail activities came as operations normalized following the harsh weather conditions in Western Canada earlier in the year. Additionally, air transportation also saw a substantial increase of 4.8%, fueled by a rise in international travel, particularly to Asia around the Lunar New Year.

Utilities and Manufacturing Face Downturns

Contrasting the gains in transportation and warehousing, the utilities sector experienced a decline of 2.6%. This downturn is partly attributed to a decrease in demand for heating following a particularly cold January. Similarly, the manufacturing sector faced challenges, declining by 0.4%, with significant setbacks in transportation equipment manufacturing due to ongoing retooling shutdowns.

Mining and Oil & Gas Sectors Bounce Back

The mining, quarrying, and oil and gas extraction sector witnessed a growth of 2.5%, effectively recuperating from a 2.3% drop in January. This recovery was led by a 3.3% increase in oil and gas extraction, excluding oil sands, which saw growth across various production types. This sector's rebound underscores its volatile nature and susceptibility to external conditions, such as weather impacts on operational capabilities.

Public Sector and Financial Services Show Steady Growth

The public sector continued to grow, although at a slower pace of 0.2%, with educational services and healthcare contributing modestly. Meanwhile, the finance and insurance sector recorded a 0.3% increase, marking its third consecutive month of growth, driven by robust activities in financial investment services.

Looking Forward: Preliminary Estimates for March 2024

Preliminary data for March 2024 suggests that the real GDP remained largely unchanged, with gains in utilities and real estate being offset by declines in manufacturing and retail trade. This points to a mixed economic landscape where certain sectors are expanding while others retract, reflecting the complex interplay of domestic and global economic factors.

Conclusion

As we await the official first-quarter GDP figures due for release on May 31, 2024, it's clear that Canada's economy is experiencing a period of cautious optimism mixed with sector-specific challenges. The ongoing fluctuations across different industries highlight the need for businesses and policymakers to remain adaptable and responsive to changing economic conditions. This nuanced picture of Canada's economic health offers valuable insights into the resilience and vulnerabilities within its diverse sectors.

Source: https://www150.statcan.gc.ca/n1/daily-quotidien/240430/dq240430a-eng.htm


Start futures forex fx news trading with Haawks G4A low latency machine-readable data today, one of the fastest news data feeds for US macro-economic and commodity data.

Please let us know your feedback. If you are interested in timestamps, please send us an email to sales@haawks.com.

Comment

Comment

13 pips potential profit in 90 seconds on 24 April 2024, analysis on futures forex fx news trading USDCAD on Canada Retail Sales data

According to our analysis USDCAD moved 13 pips on Canada Retail Sales data on 24 April 2024.

USDCAD (13 pips)

Charts are exported from JForex (Dukascopy).


Canadian Retail Sales Slightly Dip in February 2024

In February 2024, Canadian retail sales experienced a marginal decline, edging down 0.1% to $66.7 billion. This subtle decrease reflects a challenging month for several key subsectors, according to the latest data from Statistics Canada.

Subsector Performance

The decrease in retail sales was primarily led by a 2.2% drop at gasoline stations and fuel vendors. This sector also saw a significant reduction in volume terms, with sales decreasing by 3.9%. Despite the overall dip, not all areas experienced declines. The motor vehicle and parts dealers subsector, for example, saw an increase of 0.5%. Within this group, other motor vehicle dealers reported a robust growth of 5.1%, with new car dealers also up by 0.3%.

Core Retail Sales Hold Steady

Interestingly, when excluding gasoline stations and fuel vendors as well as motor vehicle and parts dealers, core retail sales remained unchanged from January. This stability is noteworthy, considering the fluctuations seen in specific subsectors. General merchandise retailers reported a rise of 1.1%, while health and personal care stores saw a smaller increase of 0.4%.

However, these gains were offset by decreases in other areas, including a 1.5% fall in sales at furniture, home furnishings, electronics, and appliance retailers. Clothing and related products retailers also faced challenges, with sales decreasing by 1.0%.

Regional Insights

Provincially, sales trends varied. Alberta witnessed the largest decline with a 1.1% decrease, primarily driven by lower sales at motor vehicle and parts dealers. In contrast, British Columbia recorded the largest increase, with sales rising by 1.2%, led by the same subsector.

In Ontario, a modest decrease of 0.2% was observed, with lower sales at gasoline stations and fuel vendors contributing to this trend. The Toronto metropolitan area experienced a more pronounced decrease of 2.3%.

E-commerce Continues to Grow

Retail e-commerce sales presented a brighter spot in February's retail landscape. On a seasonally adjusted basis, e-commerce sales climbed 1.9% to $3.8 billion, now representing 5.7% of total retail trade. This marks a slight increase from the 5.6% share observed in January, suggesting a continued shift towards online shopping among Canadian consumers.

Looking Ahead

Providing a glimpse into the future, Statistics Canada's advance retail indicator suggests that retail sales remained stable in March. This estimate, based on responses from 61.9% of companies surveyed, will be revised as more data becomes available. However, it offers a preliminary sign that the retail sector might be steadying after a fluctuating start to the year.

In conclusion, while the overall decrease in retail sales for February was slight, the varied performance across different sectors and regions highlights the ongoing challenges and opportunities within the Canadian retail landscape. As businesses continue to adapt to shifting consumer preferences and economic conditions, the coming months will be critical in shaping the trajectory of the retail sector in 2024.

Source: https://www150.statcan.gc.ca/n1/daily-quotidien/240424/dq240424a-eng.htm


Start futures forex fx news trading with Haawks G4A low latency machine-readable data today, one of the fastest news data feeds for US macro-economic and commodity data.

Please let us know your feedback. If you are interested in timestamps, please send us an email to sales@haawks.com.

Comment

Comment

46 pips potential profit in 132 seconds on 5 April 2024, analysis on futures forex fx news trading USDCAD on Canada Labour Force Survey data

According to our analysis USDCAD moved 46 pips on Canada Labour Force Survey data on 5 April 2024.

USDCAD (46 pips)

Charts are exported from JForex (Dukascopy).


Canada's Labour Force Survey: An Overview of March 2024

Canada's latest Labour Force Survey for March 2024 presents a mixed bag of results, reflecting the dynamic and fluctuating nature of the country's economy. Released on April 5th, 2024, the survey offers a comprehensive look at employment trends, unemployment rates, industry shifts, and regional differences across Canada. Here, we delve into the key findings and what they signify for Canadians.

Employment Rates: A Steady Scene with Minor Adjustments

The headline figure from the survey is the minimal change in employment for March 2024, with a slight decrease of 2,200 jobs, marking a -0.0% change. This stability follows a modest increase in February (+41,000) and January (+37,000), suggesting a period of relative steadiness in the job market. However, it's notable that the employment rate has seen a slight decline for the sixth consecutive month, falling by 0.1 percentage points to 61.4%.

Unemployment on the Rise

A more concerning trend is the uptick in the unemployment rate, which rose by 0.3 percentage points to 6.1% in March. This increase adds to a year-over-year rise of 1.0 percentage points, indicating a growing number of Canadians are finding themselves out of work. Particularly striking is the unemployment rate among youth aged 15 to 24, which increased by 1.0 percentage points in just a month to 12.6%, and by 3.1 percentage points from March 2023.

Sectoral and Demographic Disparities

The survey highlights significant differences in employment changes across various demographics and industries. Youth employment continued to decline, falling by 28,000 (-1.0%), while core-aged men saw an increase of 20,000 (+0.3%). The decline in youth employment is a concerning trend that has seen virtually no net employment growth for this group since December 2022.

Industries such as accommodation and food services, wholesale and retail trade, and professional, scientific and technical services saw employment decreases, while health care and social assistance led with an increase of 40,000 (+1.5%). These sectoral shifts reflect broader economic changes and areas of growth and contraction within the Canadian economy.

Regional Variations

The survey also sheds light on regional disparities, with employment decreasing in Quebec, Saskatchewan, and Manitoba, while Ontario experienced an increase. This variation underscores the diverse economic conditions across the country and the impact of regional industries and policies on employment rates.

Looking Ahead

The March 2024 Labour Force Survey paints a picture of a Canadian economy experiencing slow movement in its labor market, with notable disparities across different sectors and regions. The rise in unemployment, particularly among the youth, poses a significant challenge, highlighting the need for targeted interventions and policies to support job creation and skill development in affected sectors and demographics.

As Canada navigates these complex labor market dynamics, the insights from the Labour Force Survey will be crucial for policymakers, businesses, and individuals alike in making informed decisions and adapting to the changing economic landscape.

Source: https://www150.statcan.gc.ca/n1/daily-quotidien/240405/dq240405a-eng.htm


Start futures forex fx news trading with Haawks G4A low latency machine-readable data today, one of the fastest news data feeds for US macro-economic and commodity data.

Please let us know your feedback. If you are interested in timestamps, please send us an email to sales@haawks.com.

Comment

Comment

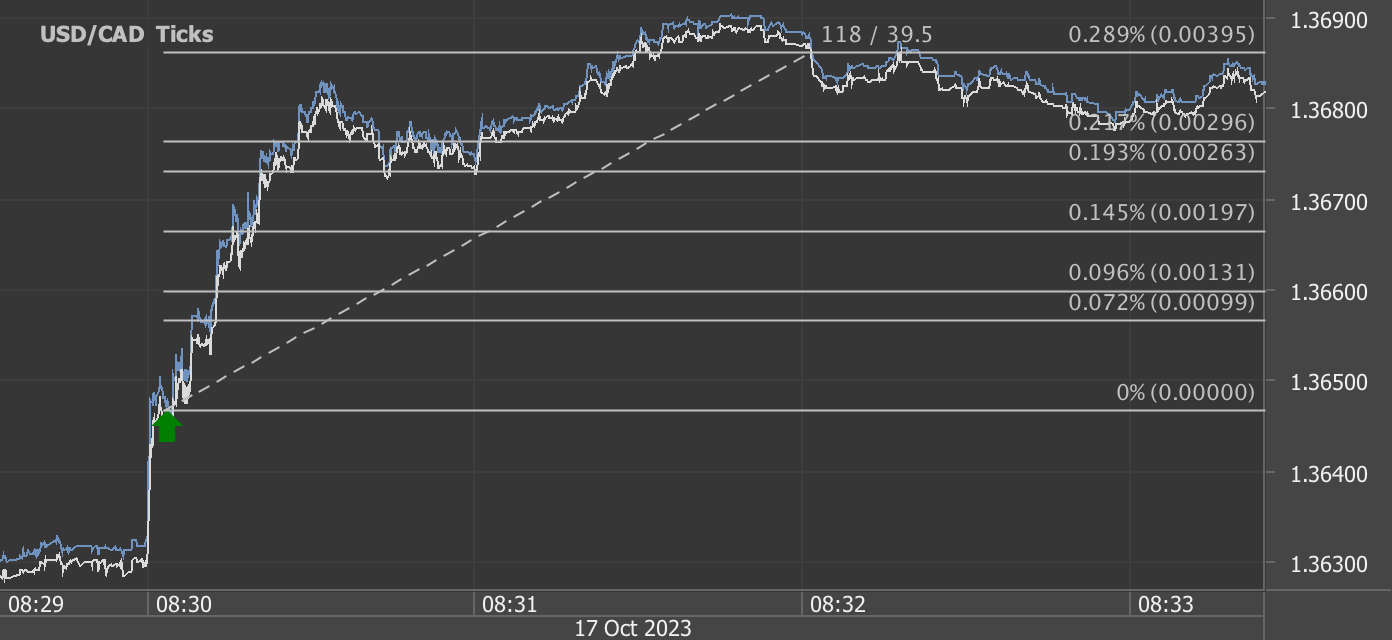
39 pips potential profit in 118 seconds on 17 October 2023, analysis on futures forex fx news trading USDCAD on Canada Consumer Price Index (CPI) data

According to our analysis USDCAD moved 39 pips on Canada Consumer Price Index (CPI) data on 17 October 2023.

USDCAD (39 pips)

Charts are exported from JForex (Dukascopy).


In September 2023, Canada's Consumer Price Index (CPI) displayed a year-over-year increase of 3.8%, indicating a slight deceleration from the 4.0% gain observed in the previous month of August. This deceleration was influenced by lower prices in several key areas, including travel-related services, durable goods, and groceries.

Despite this moderation, there was an exception to the overall trend: gasoline prices. Gasoline prices accelerated their year-over-year increase in September, with a significant rise of 7.5%. This increase can be attributed to a base-year effect and a notable contrast to the previous month's modest gain of 0.8%.

As Canadian inflation showed signs of moderation, the USD/CAD exchange rate responded with a 39-pip rally. The pair, which represents the value of the US dollar against the Canadian dollar, gained momentum in response to the inflation data.

The 39-pip move in the USD/CAD exchange rate indicated a strengthening of the US dollar against the Canadian dollar. While Canada's inflation rate decelerated, the US dollar saw increased demand, likely influenced by shifting investor sentiment and economic data.

On a monthly basis, the CPI saw a 0.1% decrease in September, compared to a 0.4% gain in August. This monthly decrease was mainly driven by a significant drop in gasoline prices by 1.3% in September.

Grocery prices, while continuing to experience a deceleration in their price growth, remained elevated. In September, they increased by 5.8% year over year, following a 6.9% increase in August. The slowdown was mainly due to the base-year effects, as large monthly increases in grocery prices in September 2022 were no longer a part of the 12-month movements.

Some food products experienced a deceleration in price growth, including meat and dairy products, primarily due to base-year effects. However, fresh fruit, fish, bakery products, and edible fats and oils saw an increase in their year-over-year price growth in September compared to August.

Air transportation costs, which were down by 21.1% year over year, highlighted the notable decline in consumer spending on travel. The decline in air transportation costs coincided with an increase in flights offered by airlines over the previous 12 months.

Furthermore, durable goods, such as furniture and household appliances, experienced a deceleration in their price growth, rising at a slower pace of 0.4% year over year in September, compared to the 1.4% increase in August. This slowdown in price growth was influenced by improvements in inventory levels compared to the previous year.

On the contrary, prices for non-durable goods experienced an acceleration in price growth, with several categories, including fresh fruit, fish, bakery products, and edible fats and oils, seeing notable increases in their year-over-year price growth.

This data reflects the evolving trends in Canadian inflation, highlighting how various factors, including base-year effects and consumer behaviors, have influenced the overall rate of price growth. Despite this moderation, many goods, particularly in the grocery sector, continue to see elevated prices, which can impact the cost of living for Canadian consumers.

The 39-pip rally in the USD/CAD exchange rate underscores how financial markets respond to economic data releases, and it can serve as an example of the intricate relationship between economic indicators and currency movements. Investors and traders closely monitor such data to make informed decisions in the foreign exchange market.

For more detailed insights and to explore the Canadian Consumer Price Index, you can access the official data on the Statistics Canada website. Additionally, stay updated on the latest developments in the USD/CAD exchange rate for a deeper understanding of the currency market dynamics.

Source: https://www150.statcan.gc.ca/n1/daily-quotidien/231017/dq231017a-eng.htm


Start futures forex fx news trading with Haawks G4A low latency machine-readable data today, the fastest news data feed for US economic and commodity data.

Please let us know your feedback. If you are interested in timestamps, please send us an email to sales@haawks.com.

Comment

Comment

28 pips potential profit in 7 minutes on 8 September 2023, analysis on futures forex fx news trading USDCAD on Canada Labour Force Survey data

According to our analysis USDCAD moved 28 pips on Canada Labour Force Survey data on 8 September 2023.

USDCAD (28 pips)

Charts are exported from JForex (Dukascopy).


Canada Labour Force Survey - August 2023:

In August 2023, the Canadian labor market exhibited noteworthy dynamics, surpassing expectations. The key highlights are as follows:

  • Employment Growth Exceeds Forecast: Employment in Canada experienced a robust increase of 40,000 individuals during the month. This impressive growth outpaced the earlier forecast of a 15,000 employment gain, signifying the resilience and strength of the Canadian labor market.

  • Stability in Unemployment Rate: Despite the substantial employment growth, the unemployment rate remained unaltered at 5.5%. This steady rate follows three consecutive monthly increases in May, June, and July, suggesting a degree of consistency in labor market conditions.

  • Demographic and Sectoral Insights: Among the noteworthy trends, core-aged individuals (aged 25 to 54) contributed significantly to employment growth, with both core-aged men and women recording positive gains. Female youth saw substantial employment growth, while male youth experienced a decrease in employment. Additionally, sectors such as professional, scientific, and technical services, as well as construction, witnessed significant employment expansion. However, employment contracted in educational services and manufacturing.

Market Reaction: The release of stronger-than-expected employment data for August 2023 carries significant implications for financial markets and the Canadian Dollar (CAD) in particular:

  • Positive Market Sentiment: The robust employment growth in Canada, exceeding the forecast, may foster positive sentiment among investors and traders. This performance is often perceived as indicative of economic resilience, potentially bolstering confidence in the Canadian economy.

  • CAD Strength: As market participants digest this data, there is potential for the Canadian Dollar (CAD) to strengthen against other currencies. The CAD may benefit from increased investor confidence, but it's crucial to recognize that currency markets are influenced by multifaceted factors, including global economic conditions and central bank policies.

  • Unemployment Stability: The unchanged unemployment rate further contributes to positive sentiment, underscoring a degree of steadiness in the labor market.

In conclusion, the August 2023 Canada Labour Force Survey revealed robust employment growth, surpassing forecasts. While this could positively influence market sentiment and the CAD's performance, a comprehensive analysis must consider a broader economic context and global factors that impact currency markets.

Source: https://www150.statcan.gc.ca/n1/daily-quotidien/230908/dq230908a-eng.htm


Start futures forex fx news trading with Haawks G4A low latency machine-readable data today, the fastest news data feed for US economic and commodity data.

Please let us know your feedback. If you are interested in timestamps, please send us an email to sales@haawks.com.

Comment

Comment

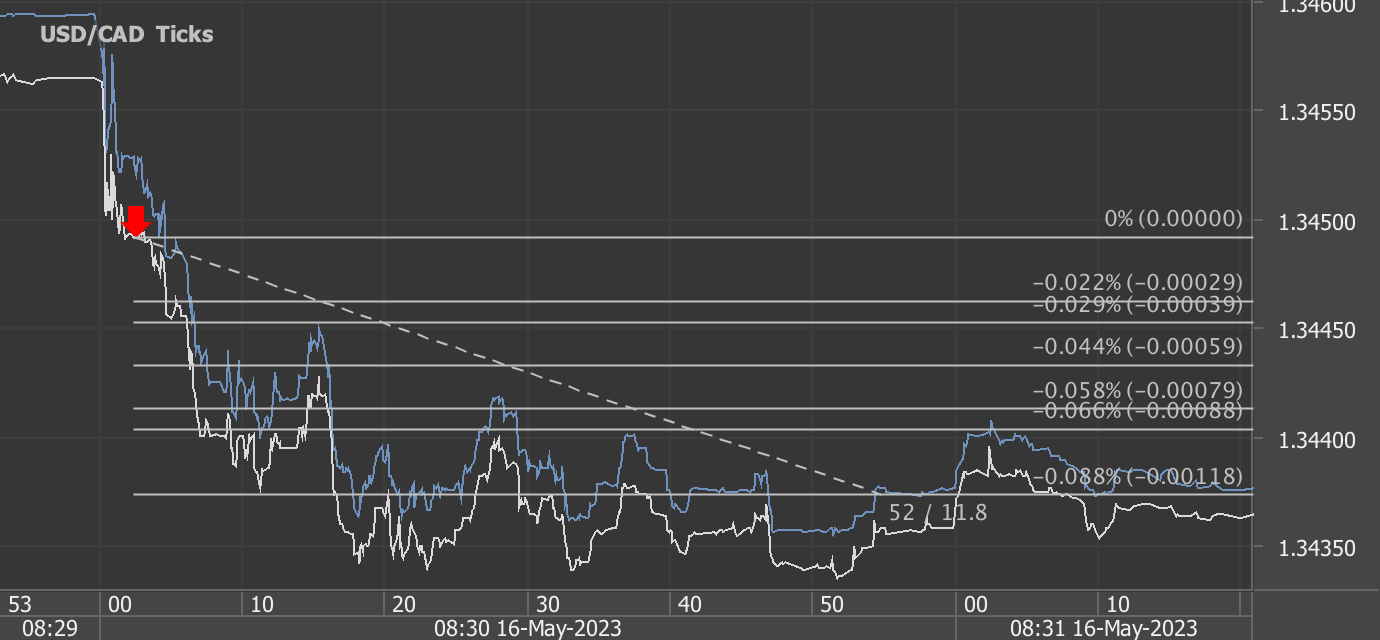
11 pips potential profit in 52 seconds on 16 May 2023, analysis on futures forex fx news trading USDCAD on Canada Consumer Price Index (CPI) data

According to our analysis USDCAD moved 11 pips on Canada Consumer Price Index (CPI) data on 16 May 2023.

Start futures forex fx news trading with Haawks G4A low latency machine-readable data today, the fastest news data feed for US economic and commodity data.

Please let us know your feedback. If you are interested in timestamps, please send us an email to sales@haawks.com.

USDCAD (11 pips)

Charts are exported from JForex (Dukascopy).

Comment

Comment

11 pips potential profit in 18 seconds on 10 February 2023, analysis on futures forex fx news trading USDCAD on Canada Labour Force Survey data

According to our analysis USDCAD moved 11 pips on Canada Labour Force Survey data on 10 February 2023.

Start futures forex fx news trading with Haawks G4A low latency machine-readable data today, the fastest news data feed for US economic and commodity data.

Please let us know your feedback. If you are interested in timestamps, please send us an email to sales@haawks.com.

USDCAD (11 pips)

Charts are exported from JForex (Dukascopy).

Comment

Comment

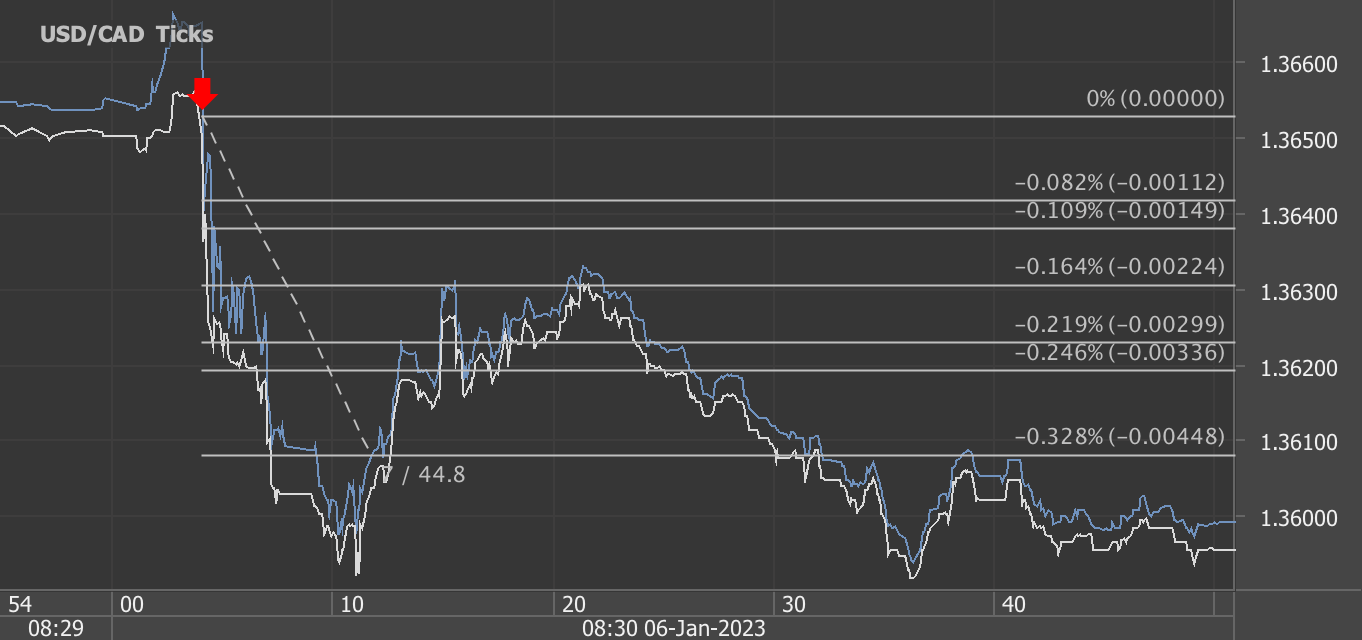
44 pips potential profit in 7 seconds on 6 January 2023, analysis on futures forex fx news trading USDCAD on Canada Labour Force data

According to our analysis USDCAD moved 44 pips on Canada Labour Force data on 6 January 2023.

Start futures forex fx news trading with Haawks G4A low latency machine-readable data today, the fastest news data feed for US economic and commodity data.

Please let us know your feedback. If you are interested in timestamps, please send us an email to sales@haawks.com.

USDCAD (44 pips)

Charts are exported from JForex (Dukascopy).

Comment

Comment

12 pips potential profit in 1 minute on 28 July 2021, analysis on forex fx news trading USDCAD on Canada Consumer Price Index (CPI) data

According to our analysis USDCAD moved 12 pips on Canada Consumer Price Index (CPI) data on 28 July 2021.

Start forex fx news trading with Haawks G4A low latency machine-readable data today, the fastest news data feed for US economic and commodity data.

Please let us know your feedback. If you are interested in timestamps, please send us an email to sales@haawks.com.

USDCAD (12 pips)

Chart_USD_CAD_Ticks_snapshot.png

Charts are exported from JForex (Dukascopy).

Comment