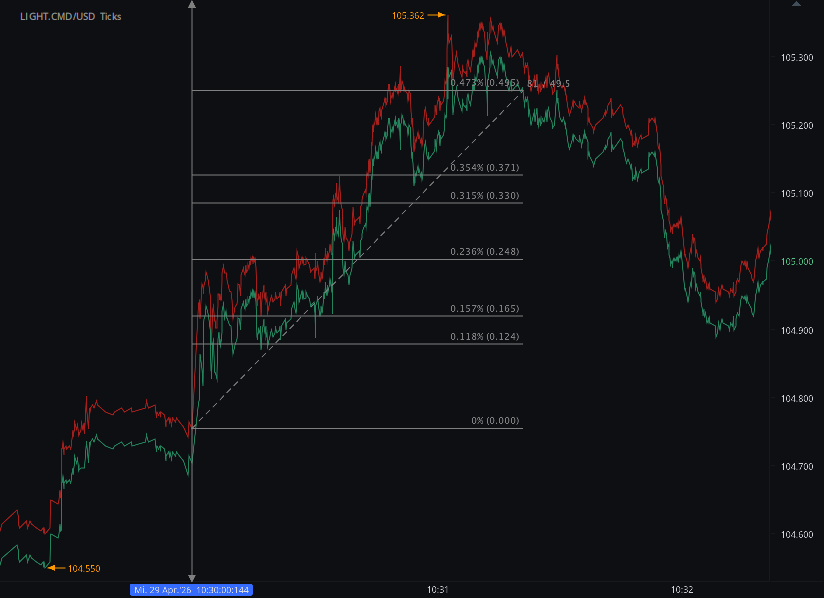
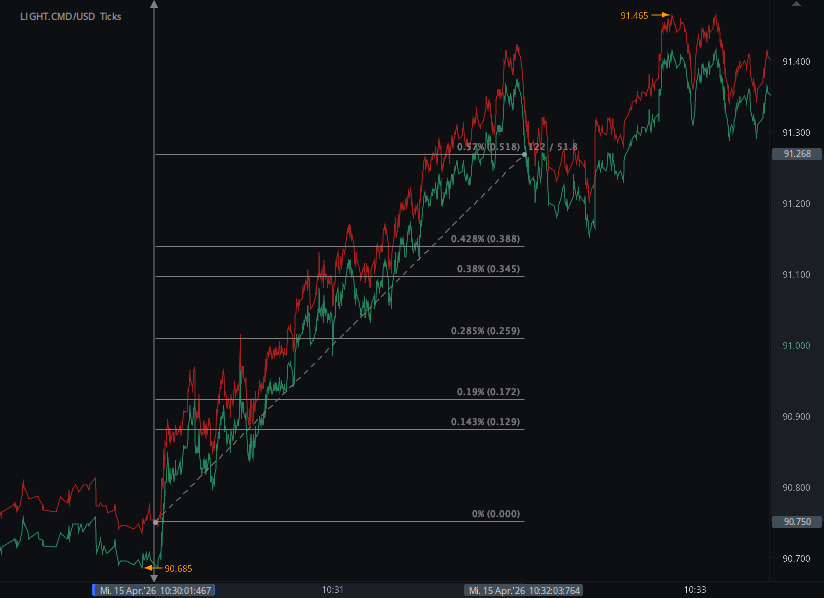
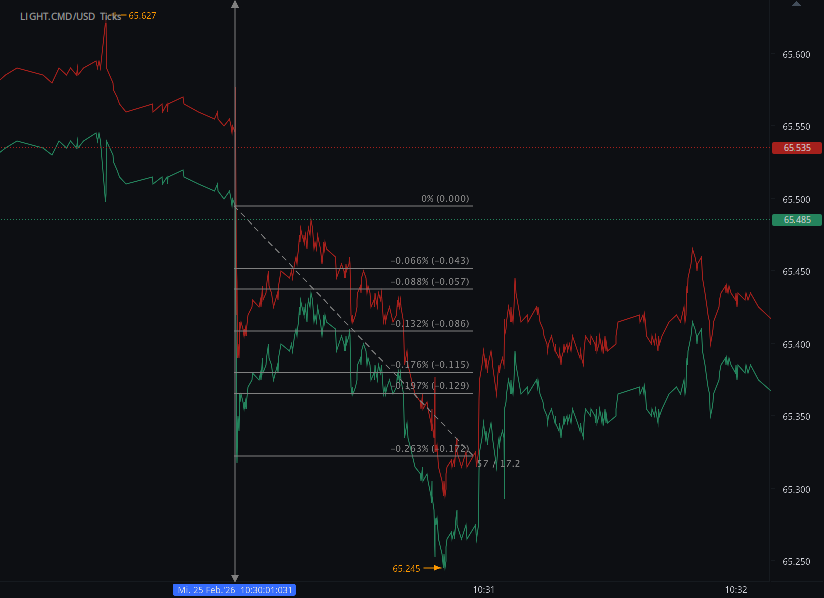
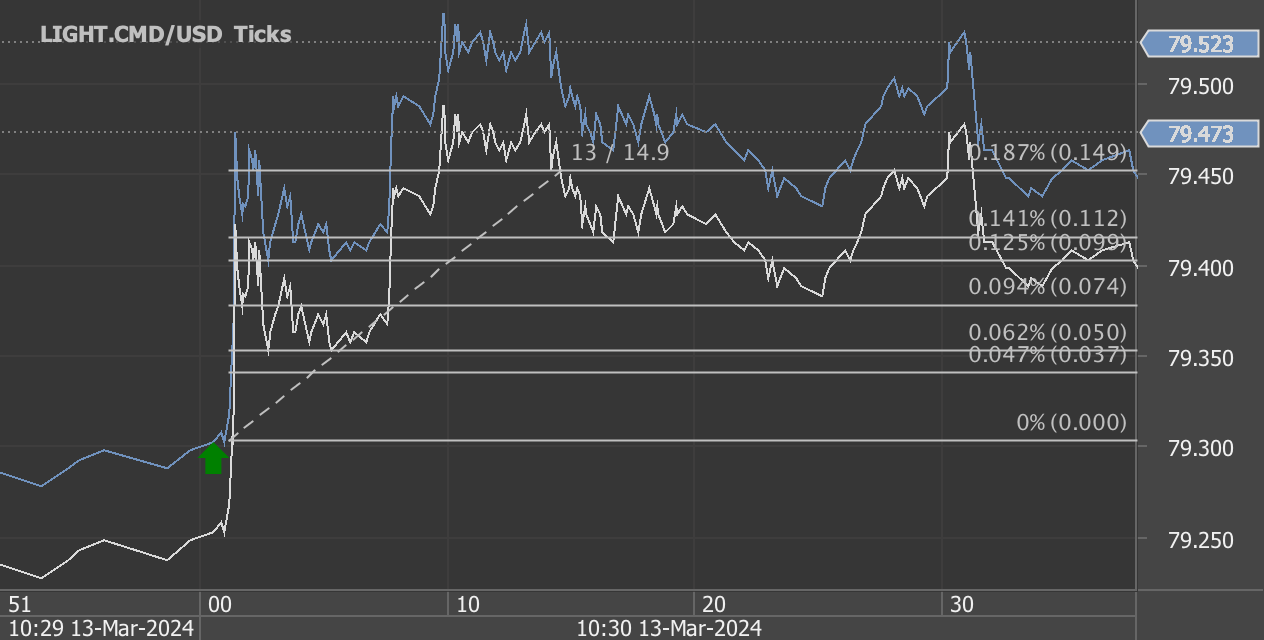
According to our analysis crude oil moved 57 ticks on DOE Petroleum Status Report (WPSR) data on 6 May 2026.
Light sweet crude oil (57 ticks)
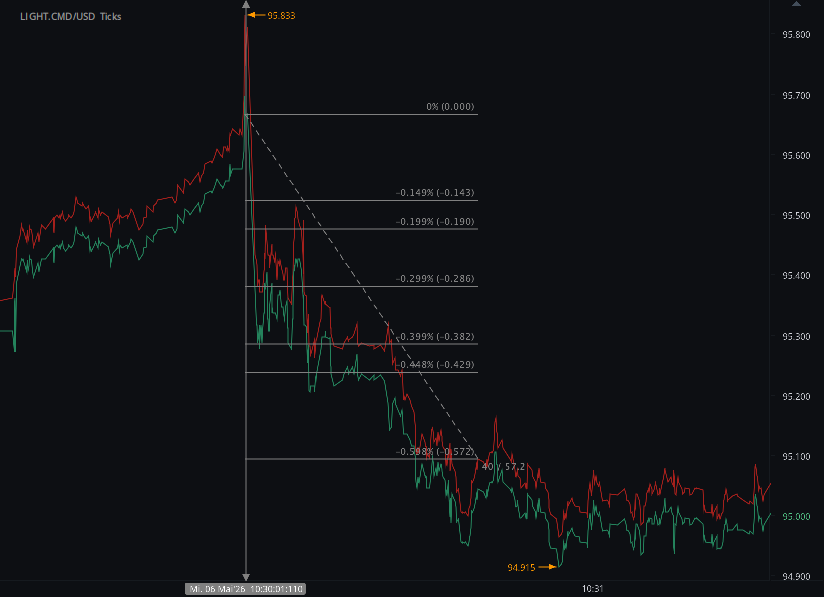
Charts are exported from JForex (Dukascopy).
U.S. Oil Inventories Tighten as Fuel Prices Jump in Early May 2026
The latest Weekly Petroleum Status Report from the U.S. Energy Information Administration shows a petroleum market under renewed pressure. For the week ending May 1, 2026, crude oil inventories declined, refinery activity remained strong, fuel stocks tightened, and retail gasoline and diesel prices moved sharply higher.
The headline number: U.S. commercial crude oil inventories fell by 2.3 million barrels, bringing total crude stocks excluding the Strategic Petroleum Reserve to 457.2 million barrels. That level remains about 1% above the five-year average for this time of year, but the weekly draw still points to a market where supply is being pulled down as refineries continue to run at high utilization.
Refineries Stay Busy, But Inputs Edge Lower
U.S. crude oil refinery inputs averaged 16.0 million barrels per day during the week, down 42,000 barrels per day from the prior week’s average. Refineries operated at 90.1% of operable capacity, a relatively strong utilization rate as the market moves deeper into the spring and closer to peak summer driving demand.
Gasoline production slipped to an average of 9.6 million barrels per day, while distillate fuel production also declined, averaging 4.9 million barrels per day.
Looking at the four-week averages, refinery activity remains slightly ahead of last year. Crude oil input to refineries averaged 16.032 million barrels per day, compared with 15.900 million barrels per day for the same period in 2025. Motor gasoline production also improved year over year, averaging 9.810 million barrels per day, versus 9.663 million barrels per day a year earlier.
Crude Imports Decline
Crude oil imports averaged 5.5 million barrels per day last week, down 273,000 barrels per day from the previous week. Over the past four weeks, imports averaged roughly 5.6 million barrels per day, which is 2.4% lower than the same four-week period last year.
Net crude oil imports over the latest four-week period averaged just 346,000 barrels per day, far below the 1.592 million barrels per day recorded during the comparable period in 2025. That reflects a much stronger net export position for the broader U.S. petroleum market.
Total petroleum net imports were deeply negative at -5.890 million barrels per day, meaning the U.S. exported far more petroleum and petroleum products than it imported on a net basis.
Fuel Inventories Move Lower
The report showed broad draws across key fuel categories.
Motor gasoline inventories fell by 2.5 million barrels to 219.8 million barrels. That leaves gasoline stocks about 4% below the five-year average for this time of year. Finished gasoline inventories increased, but blending component inventories declined enough to pull the overall gasoline stock figure lower.
Distillate fuel inventories declined by 1.3 million barrels to 102.3 million barrels. Distillate stocks are now about 11% below the five-year average, a notable shortfall given the importance of diesel and heating oil to freight, agriculture, industry, and winter fuel markets.
Propane and propylene inventories also decreased by 1.3 million barrels, though they remain exceptionally high by historical standards at 56% above the five-year average.
Total commercial petroleum inventories declined by 5.9 million barrels for the week.
Demand Looks Firm Across Major Products
Total products supplied, a common proxy for demand, averaged 20.3 million barrels per day over the latest four-week period. That is up 2.6% from the same period last year.
Motor gasoline product supplied averaged 9.0 million barrels per day, up 1.0% year over year. Distillate fuel product supplied averaged 3.8 million barrels per day, up 3.5% from the same period last year.
Jet fuel was the weak spot. Jet fuel product supplied was down 6.2% compared with the same four-week period in 2025.
The demand picture is therefore mixed but generally constructive: gasoline and distillate consumption are running ahead of last year, while aviation fuel demand is lagging.
Crude and Fuel Prices Surge
The price section of the report is where the pressure becomes most visible.
The West Texas Intermediate crude oil price stood at $105.38 per barrel on May 1, 2026. That was up $6.96 from the prior week and a striking $45.71 above the year-ago level of $59.67.
Refined product prices were also sharply higher than last year:
New York Harbor conventional gasoline: $3.630 per gallon, up from $1.850 a year ago.
New York Harbor No. 2 heating oil: $3.871 per gallon, up from $1.907 a year ago.
New York Harbor ultra-low sulfur diesel: $4.016 per gallon, up from $2.005 a year ago.
Mont Belvieu propane: $0.884 per gallon, up from $0.731 a year ago.
Retail prices followed the same pattern. The national average price for regular gasoline rose to $4.452 per gallon on May 4, up 32.9 cents from the prior week and $1.305 above the year-ago price.
Diesel prices rose even more dramatically. The national average on-highway diesel price increased to $5.640 per gallon, up 28.9 cents from the previous week and $2.143 higher than one year earlier.
What This Means for the Market
This week’s report points to a tighter and more expensive petroleum market. Crude oil inventories remain slightly above the five-year average, but weekly stock draws, lower imports, firm refinery runs, and declining product inventories suggest that supply is not building comfortably.
The most important pressure point may be distillate fuel. Inventories are 11% below the five-year average, while distillate product supplied is running 3.5% above last year. That combination helps explain why diesel prices remain elevated and why businesses tied to freight, logistics, construction, farming, and manufacturing may continue to face high fuel costs.
Gasoline markets are also tightening as the summer driving season approaches. Inventories are below normal, demand is slightly higher than last year, and retail prices have jumped sharply.
Bottom Line
The May 1, 2026 petroleum report shows a market defined by falling inventories, resilient demand, strong refinery utilization, lower imports, and sharply higher prices.
Crude prices above $105 per barrel and national gasoline prices above $4.45 per gallon suggest that consumers and businesses are already feeling the impact. Unless supply improves or demand softens, fuel prices could remain under pressure heading into the summer travel season.
Disclaimer: This blog post is for informational purposes only and should not be construed as financial advice. Always conduct thorough research and consider seeking advice from a financial professional before making any investment decisions.
Source: https://www.eia.gov/petroleum/supply/weekly/archive/2026/2026_05_06/pdf/highlights.pdf
Start futures forex fx commodity news trading with Haawks G4A low latency machine-readable data, one of the fastest data feeds for DOE data.
Please let us know your feedback. If you are interested in timestamps, please send us an email to sales@haawks.com.