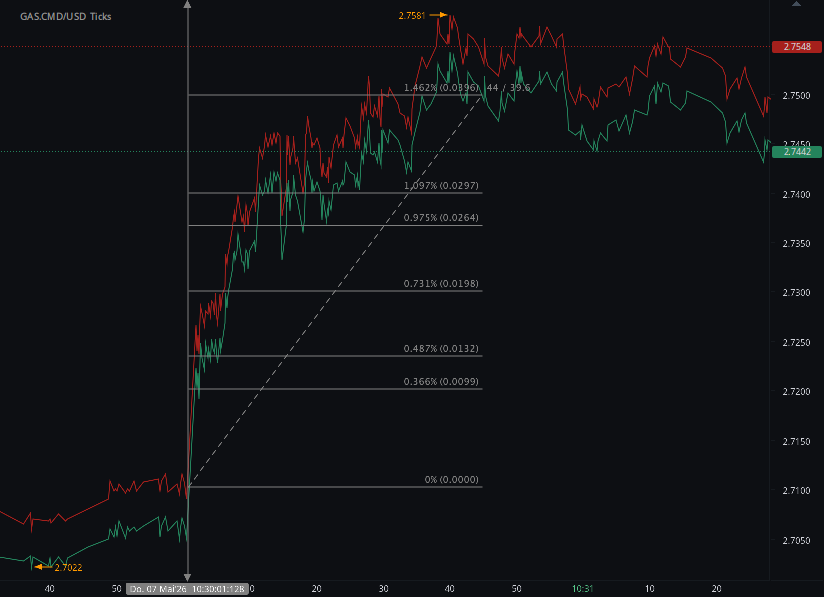
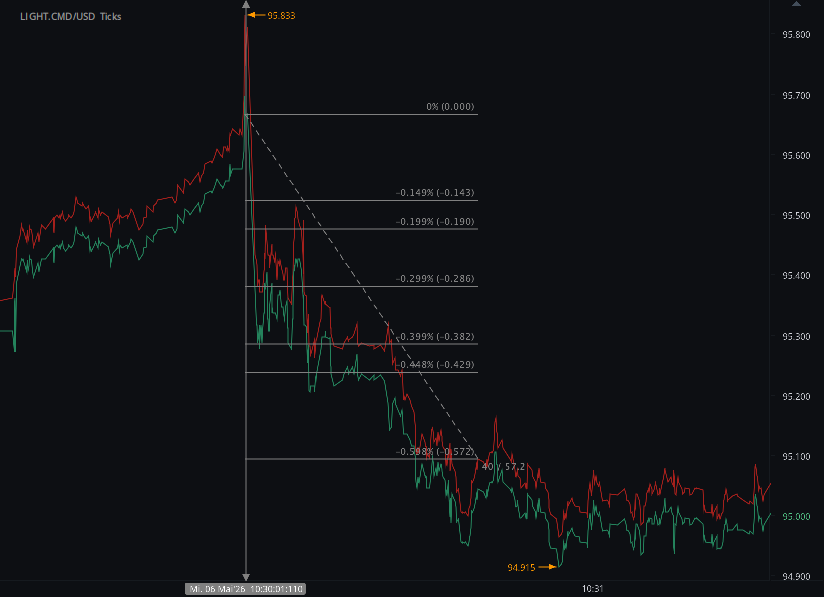
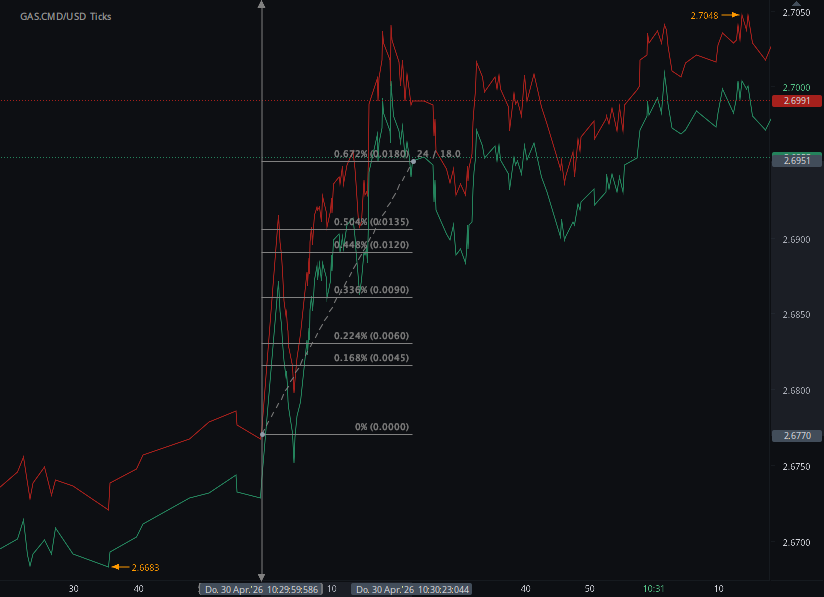
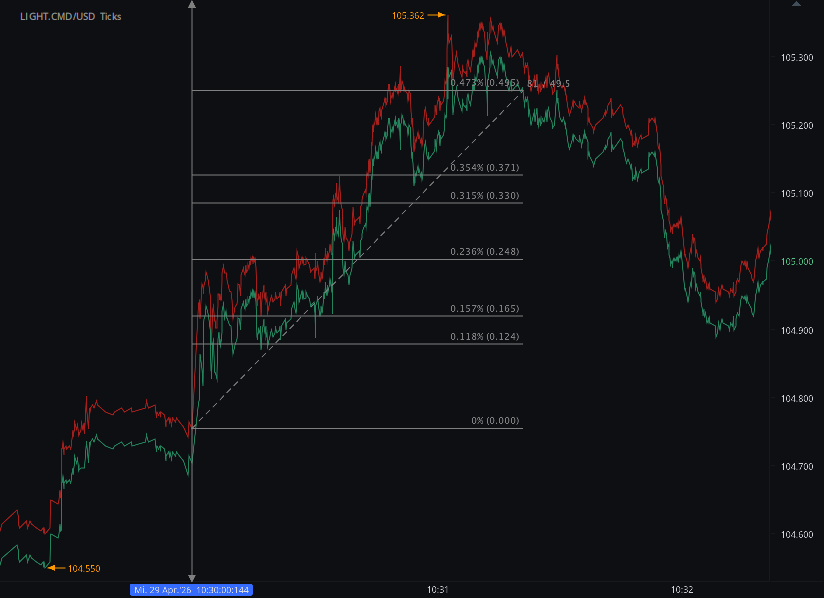
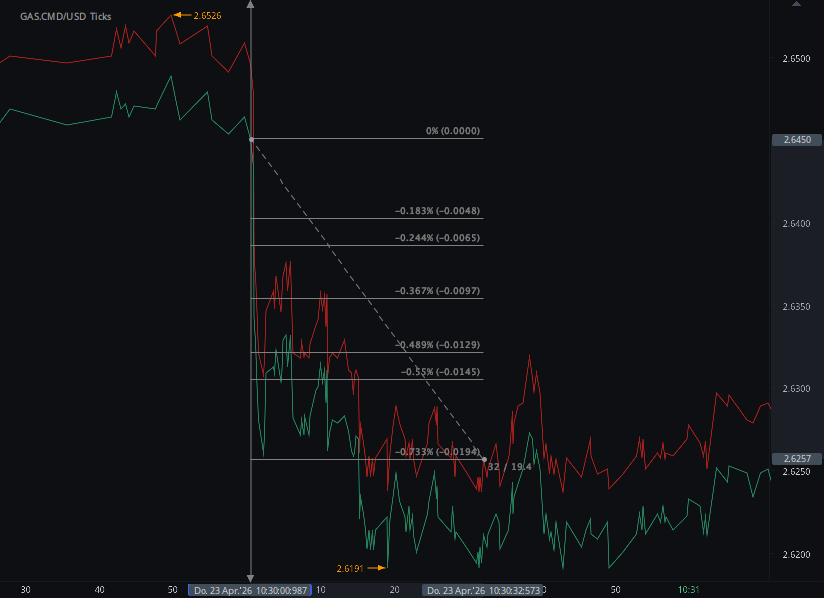
According to our analysis natural gas moved 30 ticks on DOE Natural Gas Storage Report (WNGSR) data on 28 May 2026.
Natural gas (30 ticks)
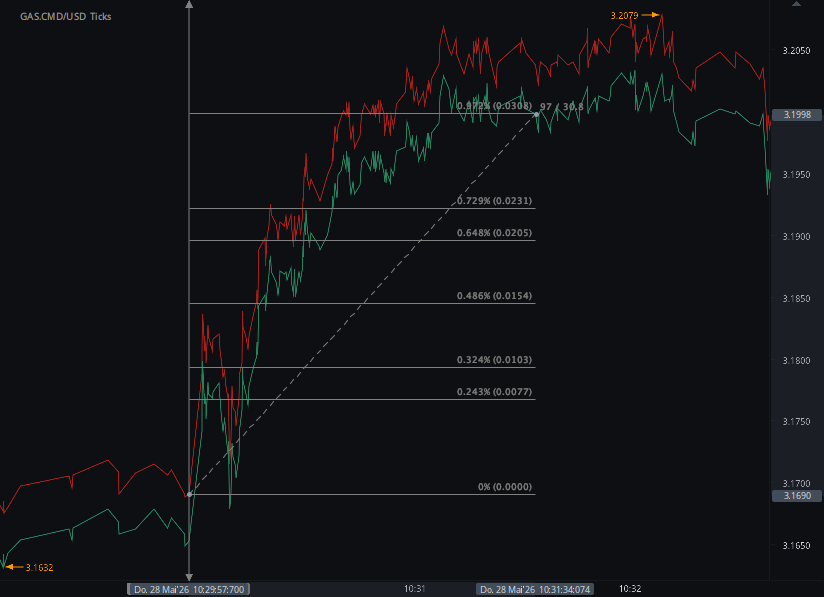
Charts are exported from JForex (Dukascopy).
U.S. Natural Gas Storage Climbs by 92 Bcf, Staying Above the Five-Year Average
U.S. working natural gas in underground storage rose sharply for the week ending May 22, 2026, according to the latest Weekly Natural Gas Storage Report from the U.S. Energy Information Administration. Total working gas stocks reached 2,483 billion cubic feet (Bcf), reflecting a net increase of 92 Bcf from the prior week.
The latest build keeps storage levels slightly above both last year’s mark and the five-year average. Stocks were 21 Bcf higher than the same week in 2025 and 144 Bcf above the five-year average of 2,339 Bcf. At 2,483 Bcf, total working gas remains within the five-year historical range.
Regional Storage Trends
The weekly increase was broad-based across all major Lower 48 storage regions.
The East region reported working gas stocks of 447 Bcf, up 28 Bcf from the previous week. Compared with historical levels, East inventories were 2.4% below last year but 1.1% above the five-year average.
The Midwest posted one of the larger regional gains, rising 34 Bcf to 539 Bcf. That placed Midwest stocks 0.4% above year-ago levels and 1.5% above the five-year average.
In the Mountain region, inventories increased by 3 Bcf to 213 Bcf. Storage levels there remained notably elevated, standing 8.1% above last year and 35.7% above the five-year average.
The Pacific region added 6 Bcf, bringing stocks to 292 Bcf. Pacific inventories were 15.4% higher than last year and 30.9% above the five-year average, making it one of the strongest regions relative to historical norms.
The South Central region reported stocks of 993 Bcf, up 21 Bcf from the previous week. Inventories were 2.4% below last year but still 0.6% above the five-year average.
Within South Central, salt storage rose by 7 Bcf to 305 Bcf, while nonsalt storage increased by 15 Bcf to 688 Bcf. Salt storage remained 6.7% below year-ago levels, though it was 2.0% above the five-year average. Nonsalt storage was nearly unchanged from both last year and the five-year average.
Storage Remains Comfortable Heading Into Summer
The 92 Bcf injection marks a sizable weekly build and leaves U.S. natural gas inventories in a relatively comfortable position heading into the summer cooling season. Total storage is not dramatically above historical norms, but it remains meaningfully stronger than the five-year average.
The regional breakdown also shows important differences. The Mountain and Pacific regions continue to hold inventories far above their five-year averages, while the East and South Central regions are modestly below last year’s levels. Still, the national picture points to adequate storage, with total working gas safely within the five-year historical range.
Key Takeaways
For the week ending May 22, 2026:
Total U.S. working natural gas in storage was 2,483 Bcf
Inventories increased by 92 Bcf from the previous week
Stocks were 21 Bcf higher than last year
Storage was 144 Bcf above the five-year average
Total working gas remained within the five-year historical range
The largest weekly regional increases came from the Midwest, East, and South Central regions
Overall, the latest EIA report suggests that U.S. natural gas storage remains well-positioned, with inventories above average and continued injections supporting supply levels ahead of peak summer demand.
Disclaimer: This blog post is for informational purposes only and should not be construed as financial advice. Always conduct thorough research and consider seeking advice from a financial professional before making any investment decisions.
Source: https://ir.eia.gov/ngs/ngs.html
Start futures forex fx commodity news trading with Haawks G4A low latency machine-readable data, one of the fastest data feeds for DOE data.
Please let us know your feedback. If you are interested in timestamps, please send us an email to sales@haawks.com.