
According to our analysis USD/CAD moved 32 pips on Canada Labour Force Survey (LFS) data on 9 October 2026.
USD/CAD (32 pips)
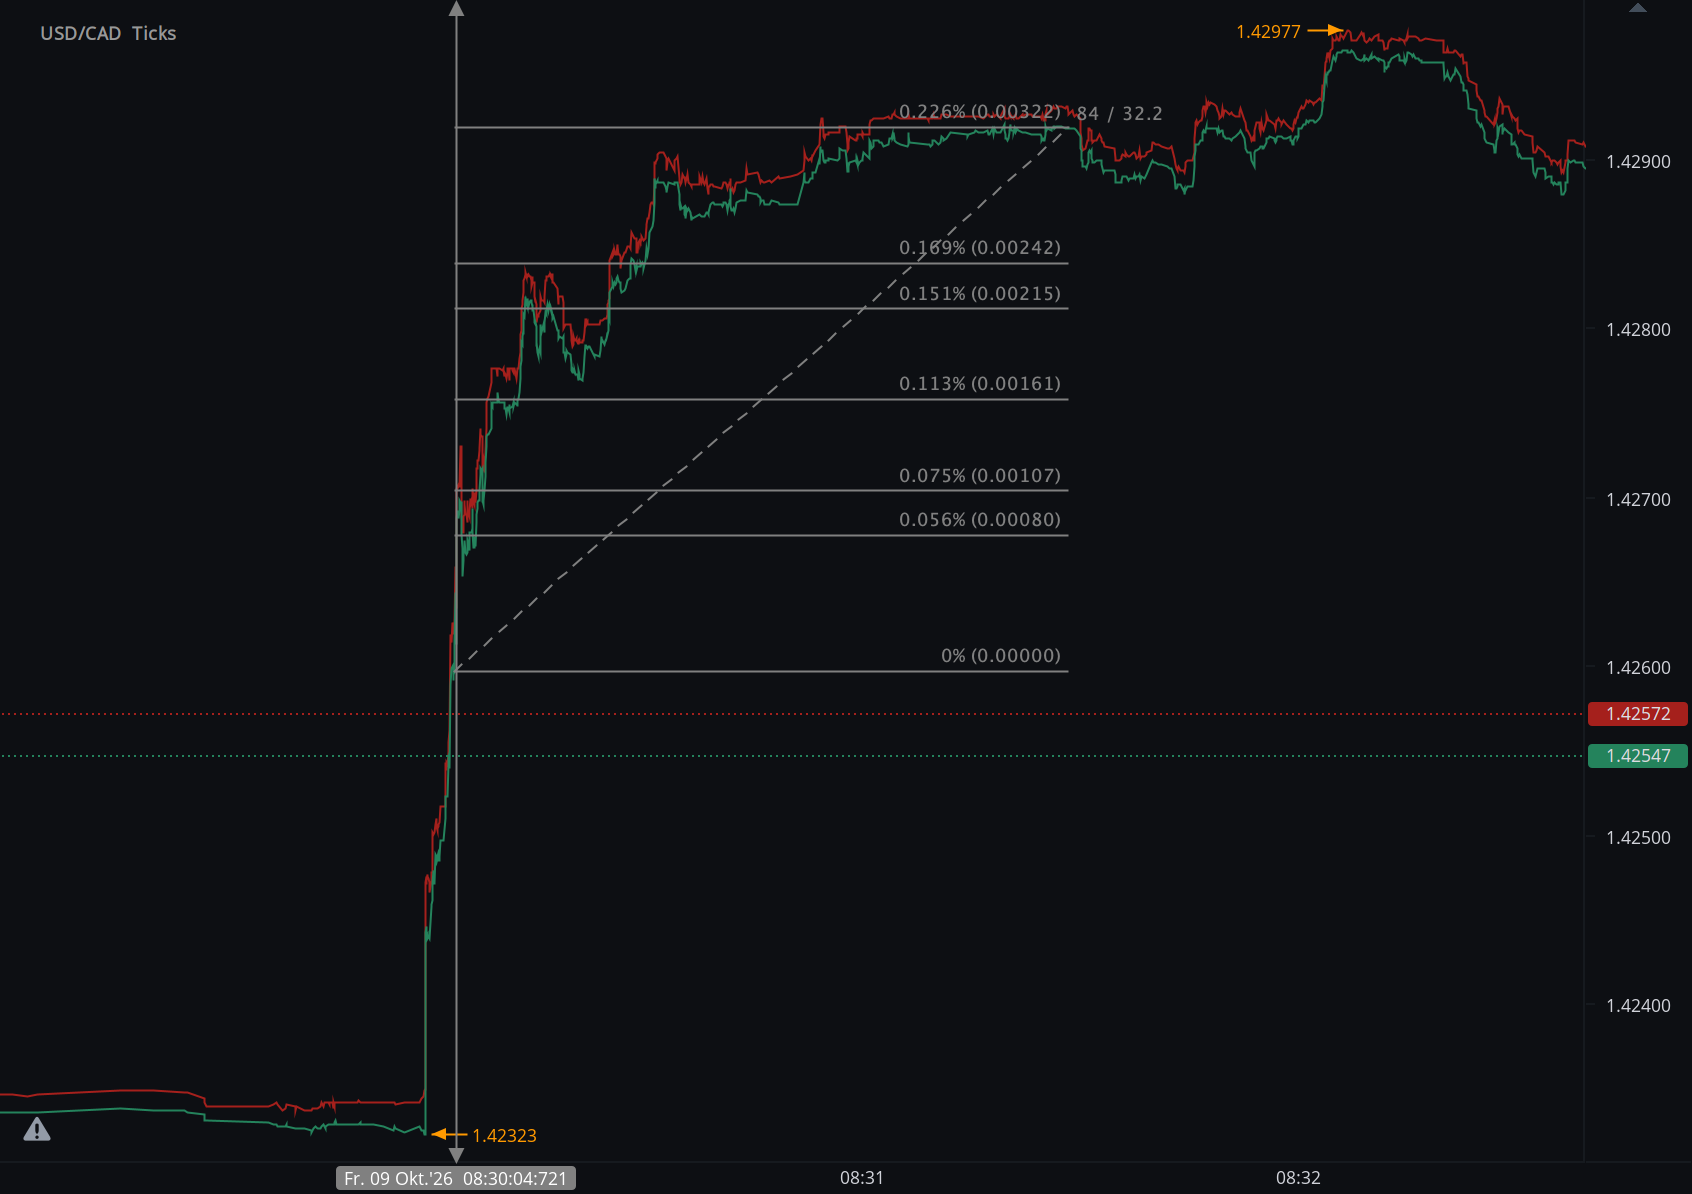
Charts are exported from JForex (Dukascopy).
Canada Labour Force Survey: USD/CAD Rises 32 Pips as Employment Falls 68,000
Canada's September labour report delivered a substantial downside employment surprise, weakening the Canadian dollar and prompting an immediate repricing of Bank of Canada expectations.
Statistics Canada's September 2026 Labour Force Survey delivered a considerably weaker employment result than markets had expected, producing an immediate repricing in the Canadian dollar and domestic rate expectations.
Canadian employment declined by approximately 68,000 in September, following a decline of roughly 42,000 in August.
A Reuters survey of economists had anticipated an increase of 9,200 jobs. The difference between the reported result and the survey average was therefore approximately 77,500 jobs to the downside.
The unemployment rate increased by 0.1 percentage point to 6.5%, matching the Reuters consensus forecast. The employment surprise, rather than the unemployment-rate headline, was therefore the clearest deviation from pre-release expectations.
Immediate USD/CAD Market Response
USD/CAD Release-Window Movement
+32 PipsHAAWKS measured a rapid upward repricing in USD/CAD after the 8:30 a.m. ET publication.
A rise in USD/CAD corresponds to a weaker Canadian dollar relative to the U.S. dollar. The measurement represents market movement around the release, not necessarily achievable trading P&L.
The HAAWKS tick-level chart shows the currency pair moving sharply higher immediately after publication as the market incorporated the weaker employment data.
Reuters subsequently reported that USD/CAD traded as high as approximately 1.4298, corresponding to the weakest level for the Canadian dollar against the U.S. dollar since April 2025.
The broader session move therefore remained directionally consistent with the initial release-window response measured by HAAWKS.
Actual Data vs. Pre-Release Expectations
| Indicator | Previous | Reuters Consensus | September Actual | Release Signal |
|---|---|---|---|---|
| Employment Change | −41.7K | +9.2K | −68.3K | Large downside surprise |
| Unemployment Rate | 6.4% | 6.5% | 6.5% | In line |
| Participation Rate | 65.0% | — | 64.8% | −0.2 ppt |
| Employment Rate | 60.8% | — | 60.6% | −0.2 ppt |
| Average Hourly Wages | +2.0% YoY | — | +2.3% YoY | Wage growth accelerated |
HAAWKS view: the employment headline carried the dominant surprise. The unemployment rate itself matched the Reuters survey, while wage growth accelerated. The release was therefore not uniformly weak across every field, but the scale of the employment decline provided a clear negative labour-demand signal.
The Composition of the Employment Decline
The headline decline was broad enough to matter beyond a single employment category.
Full-time employment fell by approximately 35,000, while part-time employment declined by approximately 33,000.
September represented a second consecutive monthly employment decline. Statistics Canada reported employment down by approximately 42,000 in August after gains earlier in the year.
Despite the recent weakness, total employment remained approximately 95,000 higher than one year earlier, an increase of about 0.5%.
Public-Sector Employment Drives Much of the Weakness
One of the most important details beneath the national headline was the continued decline in public-sector employment.
Statistics Canada reported that the number of public-sector employees fell by approximately 70,000 in September, or 1.5%.
This represented a fourth consecutive monthly decline in public-sector employment. Compared with September 2025, the number of public-sector employees was down approximately 119,000.
Private-sector employment was little changed during the month, while self-employment edged down by approximately 23,000.
| Class of Worker | September Change | Year-on-Year Context |
|---|---|---|
| Public Sector | −70K | −119K / −2.6% |
| Private Sector | Little changed | +163K / +1.2% |
| Self-Employment | −23K | +51K / +1.9% |
Employment Weakness Concentrated in Several Major Industries
The industry breakdown showed losses across education, health-related services and manufacturing.
| Industry | September Employment Change | Monthly Percentage Change |
|---|---|---|
| Educational Services | −35K | −2.2% |
| Health Care & Social Assistance | −23K | −0.8% |
| Manufacturing | −13K | −0.7% |
| Other Services | +17K | +2.1% |
Manufacturing is particularly relevant for macro analysis given its exposure to cross-border trade and U.S.-Canada economic conditions. However, the largest monthly losses were recorded in educational services and health care and social assistance.
Participation Falls to 64.8%
The labour-force participation rate declined by 0.2 percentage point to 64.8%.
Statistics Canada noted that this was the lowest participation rate since December 1997, excluding the exceptional conditions during 2020.
The agency emphasized that population aging is an important structural contributor to the decline in participation.
People aged 65 and older represented 23.2% of the working-age population in September 2026, compared with 20.5% in September 2019.
Analytical distinction: a decline in participation can limit the increase in the unemployment rate even when employment falls materially. For real-time interpretation, employment, unemployment and participation therefore need to be processed together rather than treated as independent headlines.
Youth Employment Accounts for a Significant Share of the Decline
Employment among people aged 15 to 24 fell by approximately 48,000, or 1.8%, in September.
It was the second consecutive monthly decline for youth employment. Over August and September combined, youth employment decreased by approximately 67,000.
The number of young people participating in the labour force also declined, helping keep the youth unemployment rate broadly unchanged at approximately 13.0%.
This is another example of why the unemployment rate alone can provide an incomplete reading of labour-market momentum.
Regional Labour-Market Divergence
Employment weakness was not evenly distributed across Canada.
| Province | Employment Change | Monthly Change | Unemployment Rate |
|---|---|---|---|
| Quebec | −49K | −1.1% | 6.0% |
| British Columbia | −20K | −0.7% | 6.4% |
| Ontario | −20K | −0.2% | 7.0% |
| Alberta | +23K | +0.9% | 6.4% |
Quebec recorded the largest provincial employment decline, while Alberta moved in the opposite direction with an increase of approximately 23,000 jobs.
Wage Growth Prevents an Unambiguously Soft Reading
Average hourly wages among employees increased 2.3% year over year in September, compared with 2.0% in August.
The average hourly wage level increased by approximately $0.86 to $37.64 from a year earlier.
From a monetary-policy perspective, that detail matters. Employment growth weakened substantially, but wage growth did not simultaneously decelerate.
The report therefore contained a strong negative employment surprise alongside a somewhat firmer wage signal.
Bank of Canada Expectations Reprice
The currency response was accompanied by a shift in Canadian interest-rate expectations.
Reuters reported that investors reduced the implied probability of a Bank of Canada rate increase at the October meeting to approximately 25%, from around 40% before the employment report.
Canadian government bond yields also moved lower as markets incorporated a weaker near-term labour outlook.
This transmission mechanism is central to understanding the USD/CAD response:
Employment Surprise
Employment fell substantially instead of delivering the modest increase expected by the Reuters survey.
Policy Expectations
A weaker labour backdrop reduced the market-implied probability of near-term Bank of Canada tightening.
Canadian Rates
Lower policy expectations were accompanied by lower Canadian government bond yields.
FX Transmission
The resulting relative-rate repricing was consistent with a weaker Canadian dollar and higher USD/CAD.
Why the Labour Force Survey Requires Multi-Field Processing
The September release demonstrates why professional real-time economic data infrastructure cannot rely on a single headline field.
Within one publication, the market received information on employment, unemployment, participation, full-time and part-time work, wages, public and private employment, industry-level changes, demographics and regional labour markets.
| Data Field | September Reading | Why It Matters |
|---|---|---|
| Employment Change | −68K | Primary measure of monthly labour demand and the largest consensus surprise. |
| Unemployment Rate | 6.5% | Important policy variable, but matched the cited consensus. |
| Participation Rate | 64.8% | Helps explain movements in unemployment and labour supply. |
| Full-Time / Part-Time | −35K / −33K | Shows the composition and breadth of employment changes. |
| Wage Growth | +2.3% YoY | Adds information relevant to domestic inflation pressure and monetary policy. |
| Industry Breakdown | Education, health care and manufacturing lower | Helps distinguish broad labour weakness from isolated sector volatility. |
Implications for Event-Driven Macro Strategies
Consensus Is Part of the Information Set
Employment falling by 68,300 is economically relevant on its own, but its immediate market significance was amplified by the fact that economists surveyed by Reuters had expected an increase of 9,200.
The approximately 77,500-job gap between actual and expected employment provided the clearest quantitative surprise in the release.
Not Every Field Pointed in the Same Direction
Employment was substantially weaker, participation declined and the employment rate fell. At the same time, unemployment matched the consensus estimate and wage growth accelerated.
Automated interpretation therefore benefits from evaluating multiple fields rather than assigning a directional signal from one headline.
Cross-Market Confirmation Matters
The Canadian dollar weakened while domestic yields declined and expectations for near-term Bank of Canada tightening were reduced. That cross-market response provides additional context for the initial USD/CAD move.
The Immediate Window Should Be Separated from the Session
HAAWKS measured approximately 32 pips of USD/CAD movement around the release itself.
Later session prices reflected not only the original Labour Force Survey but also subsequent liquidity, broader U.S. dollar movement, commodity prices, positioning and other market information.
Release Vintage Matters
Historical systematic research is most robust when it preserves the exact values, expectations and timestamps available when the release became public rather than relying solely on later databases.
HAAWKS Conclusion
Canada's September Labour Force Survey delivered a substantial downside employment surprise.
Employment fell by approximately 68,000, compared with a Reuters consensus forecast for an increase of 9,200.
The unemployment rate increased to 6.5%, matching expectations, while labour-force participation declined to 64.8%.
Employment weakness was distributed across full-time and part-time work and was particularly visible in public-sector employment, educational services, health care and social assistance, manufacturing and youth employment.
Wage growth provided a countervailing signal, accelerating to 2.3% year over year.
HAAWKS measured USD/CAD approximately 32 pips higher during the immediate release window as the Canadian dollar weakened and markets reduced expectations for near-term Bank of Canada tightening.
For professional market infrastructure, the release reinforces the importance of combining official data, consensus expectations, supporting labour-market fields and precise timestamps in one structured real-time framework.
Real-Time Data. Structured Intelligence. Professional Markets.
Real-Time Canadian Economic Data
HAAWKS G4A provides low-latency, structured macroeconomic and commodity data covering the United States, Canada and Europe.
The feed supports systematic strategies, professional trading desks and latency-sensitive applications requiring field-level economic data as official releases become public.
API access is available through infrastructure in Chicago, New York and London. Free trials are available for qualified professional users.
Explore HAAWKS G4A Low-Latency DataSources
-
Statistics Canada — Labour Force Survey, September 2026
Official source for employment, unemployment, participation, wage, industry, demographic and provincial labour-market data. -
Reuters — Canada's Employment Unexpectedly Shrinks in September
Source for the pre-release economist survey: employment +9,200 expected and unemployment rate 6.5% expected, as well as initial market reaction. -
Reuters — Canadian Dollar Hits 18-Month Low as Jobs Data Clips Rate-Hike Bets
Source for subsequent Canadian-dollar performance and changes in market-implied Bank of Canada policy expectations. -
HAAWKS internal tick-level market analysis —
9 October 2026
Source for the measured immediate release-window movement of USD/CAD +32 pips.
Built for traders who compete on speed. HAAWKS G4A delivers low-latency, machine-readable macroeconomic and commodity data via API infrastructure in Chicago, New York and London. Explore the feed, share your feedback, or contact us to request a free trial for financial institutions.
